TXS 0506+056, the first cosmic neutrino source, is not a BL Lac
Abstract
We present evidence that TXS 0506+056, the first plausible non-stellar neutrino source, despite appearances, is not a blazar of the BL Lac type but is instead a masquerading BL Lac, i.e., intrinsically a flat-spectrum radio quasar with hidden broad lines and a standard accretion disk. This re-classification is based on: (1) its radio and O ii luminosities; (2) its emission line ratios; (3) its Eddington ratio. We also point out that the synchrotron peak frequency of TXS 0506+056 is more than two orders of magnitude larger than expected by the so-called “blazar sequence”, a scenario which has been assumed by some theoretical models predicting neutrino (and cosmic-ray) emission from blazars. Finally, we comment on the theoretical implications this re-classification has on the location of the -ray emitting region and our understanding of neutrino emission in blazars.
keywords:
neutrinos — radiation mechanisms: non-thermal — galaxies: active — BL Lacertae objects: general — gamma-rays: galaxies1 Introduction
The IceCube Collaboration together with the multi-messenger community has recently reported on the association of high-energy neutrinos with the blazar TXS 0506+056 (). This has been triggered by the detection of a muon neutrino with most probable energy TeV from the direction of the blazar at the level (IceCube Collaboration et al., 2018). Fermi-LAT observations have revealed that TXS 0506+056 was in a flaring state at the time of the IceCube alert, with a GeV flux higher by a factor than the average reported in the 3LAC catalogue (Ackermann et al., 2015; IceCube Collaboration et al., 2018). Follow-up observations have led to the detection of the source with the MAGIC and VERITAS telescopes at energies 100 GeV, as well as in the X-ray, optical, and radio bands, by Swift/XRT, NuSTAR, ASAS-SN, VLA, and various other facilities (IceCube Collaboration et al., 2018; Abeysekara et al., 2018; Albert et al., 2018; Ansoldi et al., 2018). Subsequent analysis of archival IceCube data has revealed muon neutrinos in excess of background expectations arriving from the same region of the sky on a time-scale of months in 2014–2015, which constitutes evidence for neutrino emission from the direction of TXS 0506+056 (IceCube Collaboration, 2018). A dissection of the region around the neutrino position has further shown that TXS 0506+056 is the only counterpart of all the neutrino emission in the region and therefore the most plausible first high-energy neutrino source (Padovani et al., 2018).
From the optical spectroscopy viewpoint blazars are historically divided in two classes, namely flat-spectrum radio quasars (FSRQs) and BL Lac objects (henceforth, BL Lacs), with the former displaying strong, broad emission lines just like standard quasars, and the latter instead showing at most weak emission lines, sometimes exhibiting absorption features, and in many cases being completely featureless (Urry & Padovani, 1995). Notably, all FSRQs are of the low-energy peaked (LBL111Blazars are divided based on the rest-frame frequency of the low-energy (synchrotron) hump () into LBL sources ( Hz [ 0.41 eV]), intermediate- ( Hz Hz [0.41 eV – 4.1 eV)], and high-energy ( Hz [ 4.1 eV]) peaked (IBL and HBL) sources respectively (Padovani & Giommi, 1995; Abdo et al., 2010).), and in a few cases, IBL type.
In this Letter we show that TXS 0506+056 is not what it looks like, i.e., a blazar of the BL Lac type, but instead is intrinsically an FSRQ. We also briefly comment on the implications this might have on the theoretical modeling of this source. We use a CDM cosmology with km s-1 Mpc-1, , and .
2 The nature of TXS 0506+056
The first clue about the nature of TXS 0506+056 comes from its spectral energy distribution (SED), which shows the double-humped structure typical of blazars (e.g. Padovani et al., 2017) with a Hz, which puts it in the IBL/HBL transition region (see, e.g., Fig. 7 of Padovani et al. 2018 and Fig. 4 of IceCube Collaboration et al. 2018). This is confirmed also by its steep soft X-ray spectrum (e.g. Padovani & Giommi, 1996) and the SED upturn at Hz.
The second clue comes from its optical spectrum (Paiano et al., 2018), which is characterized by a power-law continuum and, apart from faint interstellar features, displays three extremely weak emission lines identified as O ii 3727 Å, O iii 5007 Å, and N ii 6583 Å, with equivalent widths (EWs222The EW of a spectral line is a measure of its strength and it is (roughly) defined as its flux (in units of erg s-1 cm-2) normalized by the continuum level underneath the line (in units of erg s-1 cm-2 Å-1). It is therefore measured in Å.) ranging between 0.05 and 0.17 Å. TXS 0506+056 therefore fully qualifies as a BL Lac according to the standard empirical definition (EW Å; Stickel et al., 1991; Stocke et al., 1991).
Why do BL Lacs have low EWs? Blandford & Rees (1978) had originally suggested that the absence of emission lines in BL Lacs was due to a very bright, Doppler-boosted jet continuum, which was washing out the lines (said differently, the EW was low because the continuum was high; see also Georganopoulos & Marscher 1998). In the years following that paper observations of various BL Lacs, mostly selected in the X-ray band, showed that in many cases their optical spectrum was not swamped by a non-thermal component, as host galaxy features were very visible (Stocke et al., 1991). It was then thought that most BL Lacs had intrinsically weak lines (i.e., the EW was low because the line was weak). To complicate matters some objects appeared to change class (e.g. Vermeulen et al., 1995; Pian et al., 1999). Giommi et al. (2012, 2013) have shown that these two possibilities are not exclusive and indeed are both viable. Therefore, objects so far classified as BL Lacs on the basis of their observed weak, or undetectable, emission lines belong to two physically different classes: intrinsically weak-lined objects, and heavily diluted broad-lined sources, which are in reality quasars. These latter objects have been labelled “masquerading BL Lacs” by Giommi et al. (2013). We stress that these sources typically have relatively high powers and values (see Fig. 10 of Giommi et al. 2012), which translate into more non-thermal jet-related optical light than present in low sources. This implies that the emission lines are more easily diluted, explaining their BL Lac classification. In short, “masquerading BL Lacs” are the missing FSRQs with relatively high .
We stress that “real” BL Lacs and FSRQs belong to very different physical classes, namely objects without and with high-excitation emission lines in their optical spectra, referred to as low-excitation (LEGs) and high-excitation galaxies (HEGs), respectively. As discussed by Padovani et al. (2017) the LEG/HEG classification applies to AGN in general: quasars and Seyferts belong to the HEG category, while low-ionization nuclear emission-line regions (LINERs) and absorption line galaxies are classified as LEGs.
| BL Lacs | FSRQs | Masquerading BL Lacs | |
| accretion | inefficient | efficient | efficient |
| (but apparently not) | |||
| EW | Å | Å | Å |
| any | Hz | Hz |
There are fundamental physical differences between these two types of AGN. Namely, LEGs exhibit radiatively inefficient accretion related to low Eddington ratio333This is the ratio between the (accretion-related) observed luminosity and the Eddington luminosity, erg s-1, where is one solar mass. This is the maximum isotropic luminosity a body can achieve when there is balance between radiation pressure (on the electrons) and gravitational force (on the protons). (), while HEGs accrete in a radiatively efficient manner at high Eddington rates (444As stressed by Padovani et al. (2017) the dividing line in needs to be considered only in a statistical sense. The fundamental physical separation, in fact, may be also be a function of other parameters (such as spin and black hole mass) and in addition one should keep in mind that the observational data used to constrain this separation are subject to measurement and computational uncertainties and biases.; e.g. Padovani et al. 2017). From a theoretical perspective, the observed difference in is generally associated with a switch between a standard accretion, i.e. radiatively efficient, geometrically thin (but optically thick) disk accretion flow (Shakura & Sunyaev, 1973) and a radiatively inefficient, geometrically thick (but optically thin) disk accretion flow (e.g. Narayan & Yi, 1995). Table 1 presents an overview of the properties of masquerading BL Lacs compared to those of real BL Lacs and FSRQs.
We contend that TXS 0506+056 is a HEG and therefore a masquerading BL Lac, i.e., intrinsically an FSRQ with hidden broad lines and a standard Shakura – Sunyaev accretion disk. This claim is based on various pieces of evidence:
- 1.
-
2.
The optical spectrum of TXS 0506+056 resembles that of a Seyfert 2 galaxy from the point of view of the emission line ratios (Paiano et al., 2018), which implies it is a HEG;
-
3.
Its is . We estimate the black hole mass by assuming the host galaxy to be a typical giant elliptical with absolute R-band magnitude (Paiano et al., 2018) and then by using the McLure & Dunlop (2002) relationship between black hole mass and bulge to derive . This translates into erg s-1. We note that the true value cannot be much larger than this. Paiano et al. (2018) have in fact estimated a lower limit on the redshift based on the lack of absorption features due to the host galaxy. Given the closeness of this value to the measured redshift this means that the host galaxy can only be at the same level, or fainter, than assumed, which in turns means that the black hole mass cannot be much higher than estimated and that the resulting is a lower limit. As for the (thermal) bolometric luminosity, we use the relationships between and and (Punsly & Zhang, 2011) to derive erg s-1 and erg s-1 respectively. Since Punsly & Zhang (2011) have shown that these values are overestimated for jetted (radio-loud) quasars because of a sizeable jet-induced contribution we conservatively divide the logarithmic average by 3 (based on their Fig. 3), which gives erg s-1. We finally obtain .
We can also estimate the broad-line region (BLR) luminosity in two different ways (top-down and bottom-up): 1. assuming , which is consistent with typical quasar SEDs (e.g. Richards et al., 2006), we obtain erg s-1, which translates into erg s-1 for a standard covering factor per cent; 2. we derive the narrow line luminosity (NLR) from erg s-1 (Rawlings & Saunders, 1991), from which we get erg s-1 assuming , which is typical of FSRQs (Gu, Chen, & Cao, 2009). These give a logarithmic average erg s-1.
Ghisellini et al. (2011) have proposed a classification scheme to divide BL Lacs from FSRQs, which is based on in Eddington units, and set at a dividing value of , i.e. (for a per cent covering factor). This turns out to be also the value, which separates radiatively efficient from radiatively inefficient regimes and in fact coincides with our LEG/HEG division (since ). In the case of TXS 0506+056 , which implies that this source is an FSRQ also according to the Ghisellini et al. (2011) criterion. Sbarrato et al. (2012) have proposed a further division between BL Lacs and FSRQs at . TXS 0506+056, with (an average) , is well into the FRSQ region.
3 TXS 0506+056 as a “blazar sequence” outlier
The existence of a strong anti-correlation between bolometric luminosity and , the so-called “blazar sequence”, has been the subject of intense debate since it was first proposed by Fossati et al. (1998) and Ghisellini et al. (1998) (see discussion and references in, e.g., Giommi et al., 2012). This is related to the apparent lack of FSRQs of the HBL type (Section 1). We do not wish here to (re-)enter this controversy but simply to look at things from the point of view of TXS 0506+056.
Many blazar sequence outliers have been discovered so far, both in the low power – low (e.g. Padovani et al., 2003; Antón & Browne, 2005; Raiteri & Capetti, 2016) and high power – high (e.g. Padovani, Giommi, & Rau, 2012; Kaur et al., 2017, 2018) regions of parameter space.
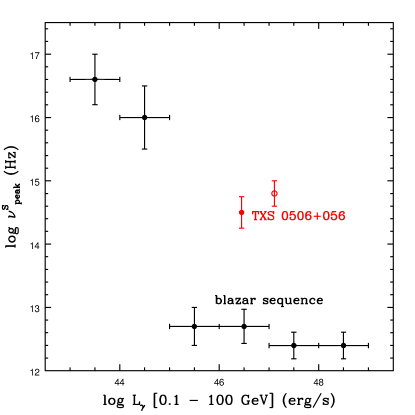
We have estimated for TXS 0506+056 by fitting both its average SED (using all available archival data: Hz) and the one close to the time of the IceCube-170922A neutrino alert (Padovani et al., 2018, Hz; see also Keivani et al. 2018, who find Hz). Given its luminosities at various frequencies ( erg s-1, Section 2, and Padovani et al. 2018), TXS 0506+056 appears to be an outlier of the blazar sequence (see, e.g., Fig. 4 of Meyer et al. 2011, Fig. 10 of Giommi et al. 2012, and Fig. 6 of Padovani, Giommi, & Rau 2012).
Ghisellini et al. (2017) have revisited the blazar sequence by using the Fermi 3LAC sample (Ackermann et al., 2015). now changes quite abruptly as function of (0.1 – 100 GeV), as shown in Fig. 1 (black points). The same figure shows also the location of TXS 0506+056 in its average state (red filled symbol) and during the IceCube-170922A neutrino alert (red open symbol). TXS 0506+056 is an obvious outlier even of the revised blazar sequence: given its , its should be more than two orders of magnitude smaller to fit the sequence. We note that this is not unexpected, as masquerading BL Lacs have high powers and high and therefore are by definition outliers.
Given that the first plausible high-energy neutrino source does not follow the blazar sequence, theoretical models predicting neutrino (and cosmic-ray) emission from blazars, which have the blazar sequence embedded in their calculations (e.g. Murase, Inoue, & Dermer, 2014; Rodrigues et al., 2018) will need to be revised.
4 Theoretical implications and summary
Using estimates of the opacity on BLR photons and of the photopion efficiency, we now discuss the implications of the presence of a BLR region on the location of the -ray emitting region and the neutrino output, assuming that -rays and neutrinos are produced in the same region of the jet.
The BLR photon field attenuates -rays of observed energy (e.g., Ghisellini & Tavecchio, 2009; Sikora et al., 2009), where eV is the energy of the Ly line, which makes the strongest contribution to the total BLR emission (quantities denoted with capital and lowercase letters refer to the observer and black-hole rest frame, respectively). The FSRQ nature of TXS 0506+056 also implies the existence of a dusty torus. However, attenuation of its infrared emission would become important only at TeV.
We thus calculate the optical depth for -rays on the BLR photons of TXS 0506+056 as a function of distance of the emitting region, , from the central engine using the method of Böttcher & Els (2016). We assume that the BLR is a spherical emitting shell with constant emissivity and width , extending from to (see Fig. 1 of Böttcher & Els, 2016). For the luminosity of the BLR we use the value derived in Section 2. We estimate the radius of the BLR as cm (Ghisellini & Tavecchio, 2008), where .
We model the radiation field of the BLR considering the 21 strongest lines from Francis et al. (1991). We find that for the luminosity derived in Section 2 (), at cm. The SED of TXS 0506+056 as measured by MAGIC and VERITAS is consistent with significant absorption above 100 GeV and , when compared to the non strictly simultaneous Fermi-LAT data (Ansoldi et al., 2018; Abeysekara et al., 2018). This absorption is not related to the extragalactic background light, as the optical depth for 100 GeV photons from a source at is . If the reported opacity is attributed to the BLR alone, then the -ray emitting region of TXS 0506+056 should be located at its outer edge, i.e., . Were the emission region closer to the central engine, stronger internal absorption of the 100 GeV -rays by the BLR would have been expected (e.g. Costamante et al., 2018). We note that for our assumed dependence of on , the BLR energy density is independent of . Thus, varying within the uncertainty range quoted in Section 2 changes the allowed range of relative to by per cent.
We can relate the radius of the emission region (blob), , to the distance of the dissipation region from the central engine , by assuming that the blob covers the cross-sectional area of the jet:
| (1) |
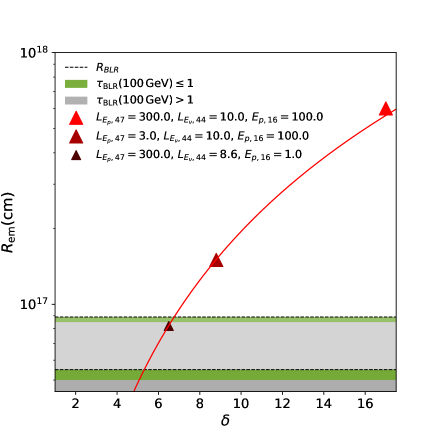
where is the half-opening angle of a conical jet, is the Lorentz factor of the bulk flow, is the Doppler factor, is the observed variability timescale, and primed variables denote quantities in the co-moving frame of the blob. For a fixed (assumed equal to 1 day based on X-ray variability: Keivani et al. 2018), different values of correspond to different locations according to eq. (1), as shown in Fig. 2 (red solid line). The range of where (green bands) lies within the outer radius of the BLR (dashed lines).
We next discuss constraints due to the electromagnetic (EM) cascade emission produced in the source from photohadronic () interactions. We first derive constraints due to interactions with the blazar synchrotron photons (see also numerical results by Gao, Fedynitch, Winter & Pohl, 2018; Cerruti et al., 2019). We then discuss how the presence of the BLR changes these results.
We require that the luminosity of the photon component produced by interactions does not exceed the luminosity in the X-ray band ( keV), i.e. erg s-1 (IceCube Collaboration et al., 2018; Keivani et al., 2018). Using eqs. (9), (13), and (14) of Murase, Oikonomou, & Petropoulou (2018) and assuming that a fraction of the bolometric cascade luminosity will emerge in the X-ray band, we derive a lower limit on the Doppler factor of the emitting region:
| (2) |
where is the photon index in the Swift/XRT energy band (IceCube Collaboration et al., 2018; Keivani et al., 2018), , , cm2, GeV, erg s-1 and eV are the observed (isotropic) synchrotron luminosity and photon energy, respectively. The only free parameters in eq. (2) are the proton energy and isotropic proton luminosity . For and we obtain an upper limit on the all-flavour neutrino luminosity (e.g. Murase, Oikonomou, & Petropoulou, 2018):
| (3) |
in agreement with detailed numerical modeling of the flaring SED of TXS 0506+056 (e.g. Keivani et al., 2018).
The location of a blob moving with can be estimated by substitution of eq. (2) into eq. (1). The results obtained for different values of and are presented in Fig. 2 (red symbols). We find that the blob is located beyond the BLR (dashed horizontal lines) unless PeV or erg s-1. In the latter case, the BLR provides additional target photons for interactions and one might expect that a higher neutrino luminosity can be achieved. However, the accompanying EM cascade component would be accordingly more luminous (see also Petropoulou & Mastichiadis, 2015). By requiring that the EM cascade emission from interactions on BLR photons does not overshoot the X-ray data (see also Petropoulou et al. 2017), we can also derive an upper bound on the expected from a blob located within the BLR, which is still given by eq. (3).
In conclusion, opacity constraints allow the emitting region to be at the outer edge of the BLR (see Fig. 2), but the constraints from the cascade emission place an upper bound of erg s-1 to the all-flavour neutrino luminosity produced within a blob, irrespective of its location with respect to the BLR. We notice that the upper bound derived here is consistent with555In an ensemble of faint sources with a summed expectation of order 1, one might observe a neutrino even if the individual expectation value is (IceCube Collaboration et al., 2018). Hence the upper limits., and well below, the neutrino luminosity implied by the IceCube observations, assuming that the source was emitting neutrinos throughout the whole IceCube observation period of 7.5 years ( erg s-1) and 6 months ( erg s-1) respectively (IceCube Collaboration et al., 2018). The explanation of neutrino luminosities as high as erg s-1 as seen during the 2014–2015 neutrino flare (Padovani et al., 2018; IceCube Collaboration, 2018) requires more complex theoretical scenarios that invoke more than one emitting region (e.g. Murase, Oikonomou, & Petropoulou, 2018).
In summary, the radio and O ii luminosities, emission line ratios, and Eddington ratio of TXS 0506+056, all point to its re-classification as a masquerading BL Lac, namely an FSRQ with the emission lines heavily diluted by a strong, Doppler-boosted jet. Moreover, TXS 0506+056 has a , which is more than two orders of magnitude larger than expected by the blazar sequence. These two facts are likely to have an impact on the theoretical modeling of this source and on our understanding of neutrino emission in blazars.
Acknowledgments
PP thanks the ASI Science Data Center (SSDC) for the hospitality and partial financial support for his visit. PG acknowledges the support of the TUM - IAS, funded by the German Excellence Initiative (and the European Union Seventh Framework Programme under grant agreement no. 291763). MP acknowledges support by the Lyman Jr. Spitzer Postdoctoral Fellowship. FO acknowledges useful corrrspondence and discussions with Markus Böttcher, Paul Els, Konstancja Satalecka, and Michael Unger. This work is supported by the Deutsche Forschungsgemeinschaft through grant SFB 1258 “Neutrinos and Dark Matter in Astro- and Particle Physics”.
References
- Abdo et al. (2010) Abdo A. A., Ackermann M., Ajello M., et al., 2010, ApJ, 716, 30
- Abeysekara et al. (2018) Abeysekara A. U., et al., 2018, ApJ, 861, L20
- Ackermann et al. (2015) Ackermann M., et al., 2015, ApJ, 810, 14
- Albert et al. (2018) Albert A., et al., 2018, ApJ, 863, L30
- Ansoldi et al. (2018) Ansoldi S., et al., 2018, ApJ, 863, L10
- Antón & Browne (2005) Antón S., Browne I. W. A., 2005, MNRAS, 356, 225
- Blandford & Rees (1978) Blandford R. D., Rees M. J., 1978, in Pittsburg Conference on BL Lac Objects, Ed. A. M. Wolfe, Pittsburgh, University of Pittsburgh press, p. 328
- Böttcher & Els (2016) Böttcher M., Els P., 2016, ApJ, 821, 102
- Cerruti et al. (2019) Cerruti, M., Zech, A., Boisson, C., et al. 2019, MNRAS, 483, L12
- Costamante et al. (2018) Costamante L., Cutini S., Tosti G., Antolini E., Tramacere A., 2018, MNRAS, 477, 4749
- Fossati et al. (1998) Fossati G., Maraschi L., Celotti A., Comastri A., Ghisellini G., 1998 MNRAS, 299, 433
- Francis et al. (1991) Francis P. J., Hewett P. C., Foltz C. B., Chaffee F. H., Weymann R. J., Morris S. L., 1991, ApJ, 373, 465
- Gao, Fedynitch, Winter & Pohl (2018) Gao S., Fedynitch A., Winter W., Pohl M., 2018, Nature Astronomy, 154
- Georganopoulos & Marscher (1998) Georganopoulos M., Marscher A. P., 1998, ApJ, 506, 621
- Ghisellini et al. (1998) Ghisellini G., Celotti A., Fossati G., Maraschi L., Comastri A., 1998, MNRAS, 301, 451
- Ghisellini & Tavecchio (2008) Ghisellini G., Tavecchio F., 2008, MNRAS, 387, 1669
- Ghisellini & Tavecchio (2009) Ghisellini G., Tavecchio F., 2009, MNRAS, 397, 985
- Ghisellini et al. (2011) Ghisellini G., Tavecchio F., Foschini L., Ghirlanda G., 2011, MNRAS, 414, 2674
- Ghisellini et al. (2017) Ghisellini G., Righi C., Costamante L., Tavecchio F., 2017, MNRAS, 469, 255
- Giommi et al. (2012) Giommi P., Padovani P., Polenta G., Turriziani S., D’Elia V., Piranomonte S., 2012, MNRAS, 420, 2899
- Giommi et al. (2013) Giommi P., Padovani P. & Polenta G., 2013, MNRAS, 431, 1914
- Gu, Chen, & Cao (2009) Gu M., Chen Z., Cao X., 2009, MNRAS, 397, 1705
- Heckman & Best (2014) Heckman T. M., Best P. N., 2014, ARA&A, 52, 589
- IceCube Collaboration (2018) IceCube Collaboration, 2018, Science, 361, 147
- IceCube Collaboration et al. (2018) IceCube Collaboration, Fermi-LAT, MAGIC, AGILE, ASAS-SN, HAWC, H.E.S.S., INTEGRAL, Kanata, Kiso, Kapteyn, Liverpool Telescope, Subaru, Swift/NuSTAR, VERITAS, VLA/17B-403 teams, 2018, Science, 361, eaat1378
- Kalfountzou et al. (2012) Kalfountzou E., Jarvis M. J., Bonfield D. G., Hardcastle M. J., 2012, MNRAS, 427, 2401
- Kaur et al. (2017) Kaur A., et al., 2017, ApJ, 834, 41
- Kaur et al. (2018) Kaur A., Rau A., Ajello M., Domínguez A., Paliya V. S., Greiner J., Hartmann D. H., Schady P., 2018, ApJ, 859, 80
- Keivani et al. (2018) Keivani A., et al., 2018, ApJ, 864, 84
- McLure & Dunlop (2002) McLure R. J., Dunlop J. S., 2002, MNRAS, 331, 795
- Meyer et al. (2011) Meyer E. T., Fossati G., Georganopoulos M., Lister M. L., 2011, ApJ, 740, 98
- Murase, Inoue, & Dermer (2014) Murase K., Inoue Y., Dermer C. D., 2014, PhRvD, 90, 023007
- Murase, Oikonomou, & Petropoulou (2018) Murase K., Oikonomou F., Petropoulou M., 2018, ApJ, 865, 124
- Narayan & Yi (1995) Narayan R., Yi I., 1995, ApJ, 452, 710
- Padovani & Giommi (1995) Padovani P., Giommi P., 1995, ApJ, 444, 567
- Padovani & Giommi (1996) Padovani P., Giommi P., 1996, MNRAS, 279, 526
- Padovani et al. (2003) Padovani P., Perlman E. S., Landt H., Giommi P., Perri M., 2003, ApJ, 588, 128
- Padovani, Giommi, & Rau (2012) Padovani P., Giommi P., Rau A., 2012, MNRAS, 422, L48
- Padovani et al. (2017) Padovani P., et al., 2017, A&ARv, 25, 2
- Padovani et al. (2018) Padovani P., Giommi P., Resconi E., T. Glauch, B. Arsioli, N. Sahakyan, M. Huber, 2018, MNRAS, 480, 192
- Paiano et al. (2018) Paiano S., Falomo R., Treves A., Scarpa R., 2018, ApJ, 854, L32
- Petropoulou & Mastichiadis (2015) Petropoulou M., & Mastichiadis A., 2015, MNRAS, 447, 36
- Petropoulou et al. (2017) Petropoulou M., Nalewajko K., Hayashida M., Mastichiadis A., 2017, MNRAS, 467, L16
- Pian et al. (1999) Pian E., et al., 1999, ApJ, 521, 112
- Punsly & Zhang (2011) Punsly B., Zhang S., 2011, MNRAS, 412, L123
- Raiteri & Capetti (2016) Raiteri C. M., Capetti A., 2016, A&A, 587, A8
- Rawlings & Saunders (1991) Rawlings S., Saunders R., 1991, Nature, 349, 138
- Richards et al. (2006) Richards G. T., et al., 2006, ApJS, 166, 470
- Rodrigues et al. (2018) Rodrigues X., Fedynitch A., Gao S., Boncioli D., Winter W., 2018, ApJ, 854, 54
- Sbarrato et al. (2012) Sbarrato T., Ghisellini G., Maraschi L., Colpi M., 2012, MNRAS, 421, 1764
- Shakura & Sunyaev (1973) Shakura N. I., Sunyaev R. A., 1973, A&A, 24, 337
- Sikora et al. (2009) Sikora M., Stawarz Ł., Moderski R., Nalewajko K., Madejski G. M., 2009, ApJ, 704, 38
- Stickel et al. (1991) Stickel M., Padovani P., Urry C. M., Fried J. W., Kühr H., 1991, ApJ, 374, 431
- Stocke et al. (1991) Stocke J. T., Morris S. L., Gioia I. M., Maccacaro T., Schild R., Wolter A., Fleming T. A., Henry J. P., 1991, ApJS, 76, 813
- Urry & Padovani (1995) Urry C. M., Padovani P., 1995, PASP, 107, 803
- Vermeulen et al. (1995) Vermeulen R. C., Ogle P. M., Tran H. D., Browne I. W. A., Cohen M. H., Readhead A. C. S., Taylor G. B., Goodrich R. W., 1995, ApJ, 452, L5