A Correction for GALEX Spectroscopic UV Flux Distributions from Comparisons with CALSPEC and IUE
Abstract
The CALSPEC database of absolute spectral energy distributions (SEDs) from the Hubble Space Telescope (HST) is based on pure hydrogen model atmosphere calculations for three unreddened white dwarf (WD) stars and represents the current UV flux calibration standard with a precision approaching 1% for well observed stars. Following our previous work to correct IUE fluxes, this paper provides an average correction for the GALEX spectral database that places GALEX fluxes on the current CALSPEC scale. Our correction is derived by comparing GALEX spectroscopic flux distributions with CALSPEC and corrected IUE SEDs. This re-calibration is relevant for any project based on GALEX archival spectroscopic data, e.g. UV or multi-wavelength analyses, correlating GALEX spectra with other existing or future databases, and planning of new observations. The re-calibration will be applied to our planned catalog of corrected GALEX SEDs.
1 Introduction
Accurate absolute stellar fluxes as a function of wavelength are required for many astrophysical purposes. The fundamental parameters of stars, including mass, radius, metallicity, and age are inferred by matching accurate stellar atmosphere models to precisely calibrated UV spectroscopic data from which the effective temperature, surface gravity, composition, and interstellar reddening are determined for all types of hot stellar objects, e.g. Bianchi & Garcia (2002, 2014); Bianchi (2012); Bianchi et al. (2018b) and references therein: Herald & Bianchi (2007, 2011); Garcia & Bianchi (2004); Pala et al. (2015); Joyce et al. (2018). The set of 100,000 GALEX UV spectra with a homogeneous spectral range of 1300-3000Å) and resolution of 8Å in the far-ultraviolet (FUV) and 20Å in the near-ultraviolet (NUV) is a resource with similar characterstics to the IUE spectral database but with about ten times larger sample and fainter fluxes. UV extinction curves can be derived for up to 1000 sight-lines within the Milky Way, yielding unique information on properties of interstellar dust and producing extinction maps from a larger sample (Bianchi, L. et al. in preparation) than previous studies from the IUE spectral collection, e.g. Valencic et al. (2004) with about 400 extinction curves.
Bertone & Chavez (2011) used an extensive sample of early GALEX stellar spectra to measure stellar line indices for classification. Their work demonstrated the potential of the GALEX spectral database in spite of limitations of the flux calibration and of the initial spectral extraction software, which has been subsequently improved. Bianchi et al. (2012) showed the potential of grism spectra for studying extended objects with UV emission lines. GALEX grism spectra have been used to study different types of stellar objects, e.g. Montez et al. (2017); Godon et al. (2014); Gal-Yam et al. (2008), and of extra-galactic sources (Burgarella et al., 2005), including Ly emitters (Deharveng et al., 2008; Cowie et al., 2010; Wold et al., 2017; Barger et al., 2012) . The latter two works extracted a spectral sample of Ly emitters that is fainter than the GALEX pipeline extraction limits by stacking the grism images taken at different orientations, as in the standard pipeline procedure, but searching for line emission, regardless of a detectable continuum. These examples illustrate the broad range of topics that can make use of the GALEX serendipitous spectral collection and underscore the importance of a calibration consistent with the current standard flux scale.
Critical for any study using GALEX spectra is the verification of the flux calibration of GALEX spectra from the cross-strapping of hot white dwarfs of intermediate brightness between GALEX and HST/IUE UV calibration standards. The resulting recalibration that is presented in this work will support any investigation using GALEX spectra and will allow more meaningful comparisons with models or with observations of the same targets from other instruments. Therefore, this updated calibration is available here, before our release of a major spectral database with source classification (Bianchi et al., 2018a).
Currently, the best choice of fundamental standards in the UV to near-IR seems to be the CALSPEC models for the primary pure hydrogen white dwarfs (WDs) G191B2B, GD153, and GD71. Our previous publication (Bohlin & Bianchi, 2018) specifies the correction required to place IUE spectral energy distributions (SEDs) on this HST/CALSPEC111http://www.stsci.edu/hst/observatory/crds/calspec.html absolute flux scale of Bohlin et al. (2014).
2 GALEX Spectra
The GALEX spacecraft was launched on 2003 April 28 and had 10 years of success in obtaining broadband UV photometry at effective wavelengths of 1539 (FUV) and 2316 Å (NUV), in addition to spectrophotometry with a CaF2 grism that is sampled at 3.5 Å intervals from 1300 to 3000 Å. The spectral resolution is 8 Å in the far-ultraviolet (FUV) second order and 20 Å in the near-ultraviolet (NUV) first order with a gap near 1820 Å between the FUV and NUV ranges (Morrissey et al., 2007). Each grism observation was obtained with several different orientations; and for each source identified in the corresponding direct image in each detector (FUV and NUV), the portions of the source spectrum not contaminated by overlapping spectra of nearby sources in each orientation sub-exposure are extracted (see figure 1 of Bianchi et al. (2018a)). All the non-contaminated segments are coadded by the pipeline into a 2-dimensional spectral “strip” from which the spectral flux and background are extracted and calibrated, resulting in a one-dimensional (wavelength, flux, sigma) spectrum for each source in an observation. These one-dimensional GALEX final extracted spectral *.fits files are the only GALEX data products analyzed in this paper. The exposure time is not necessarily uniform even across one single spectrum, because each archival SED is made up of all segments that are not contaminated by overlapping spectra of nearby sources in the separate exposures at the several orientations that comprise one observation (Morrissey et al., 2007). The effect of varying exposure time within each spectrum is captured by the statistical error array (sigma) that accompanies the GALEX final extracted flux distribution. Our analysis always weights each GALEX sample point by its statistical uncertainty.
Both the CALSPEC and IUE222http://archive.stsci.edu/iue/ data sets are compared with GALEX333http://galex.stsci.edu/GR6/ spectral flux distributions in preparation for a re-calibration and publication of the relatively unexploited 125,564 GALEX prism spectra, which comprise a homogeneous set fainter and tenfold larger than the IUE sample (Bianchi et al. (2018a), Bianchi et al. in prep). Our new database will facilitate future use of GALEX spectra for a variety of purposes.
Each GALEX match is verified during both sets of comparisons, i.e. with the few overlapping CALSPEC stars in Section 3 and with several IUE SEDs in Section 4. Section 5 combines the results of the previous two sections to derive a final best average update to the GALEX flux calibration, while Section 6 details the electronic access to our results.
3 Comparison of GALEX and CALSPEC
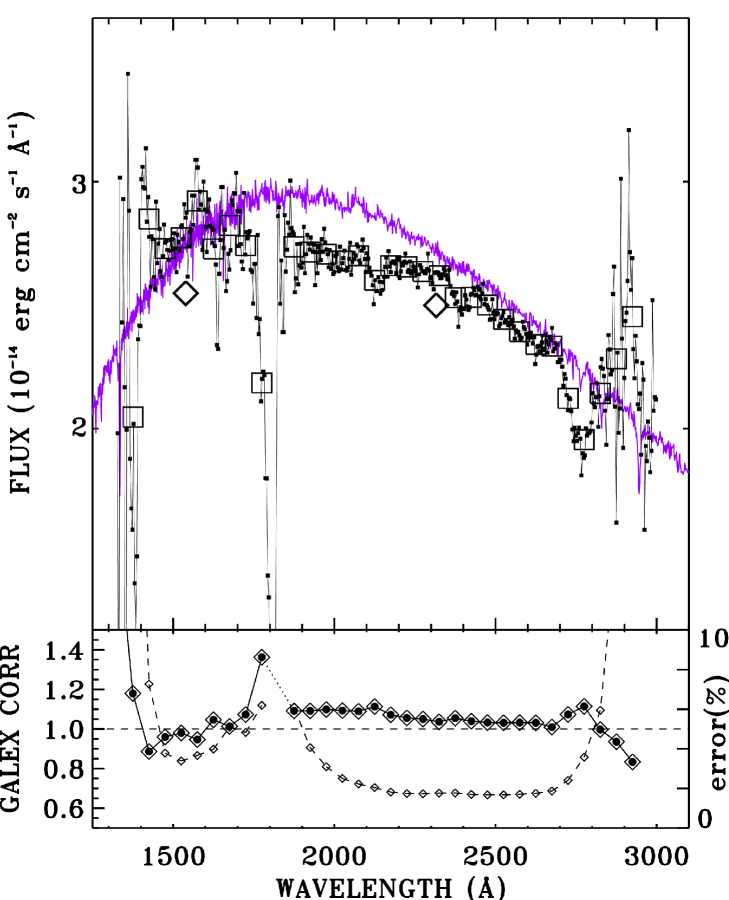
GALEX spectra exist for 11 CALSPEC stars, and Table 1 summarizes the 11 matches. Figure 1 illustrates the comparison of the GALEX and CALSPEC SEDs for the GALEX primary calibration star LDS749B (Bohlin & Koester, 2008). However, the GALEX data of many of the 11 CALSPEC stars show saturation, as illustrated for HZ43 in Figure 2. In general, GALEX spectra have some saturation when the true stellar flux is more than 4.5e-13 erg cm-2 s-1 Å-1 in either the FUV or NUV near the GALEX broadband-photometry effective-wavelengths of 1539 and 2316 Å. These two reference wavelengths lie within the regions of the greatest spectrophotometric sensitivity for the GALEX effective area444https://asd.gsfc.nasa.gov/archive/galex/Documents/PostLaunchResponseCurveData.html. The effective area is within 10% of peak from 1470–1550 for the FUV and 2150–2630 Å for the NUV.
The GALEX delay-line type of detector is a photoelectron-counting, microchannel-plate device that is similar to the COS detector on HST. Due to inherent limits on how fast the electronics can count pulses, a 10% non-linearity (i.e, saturation of the pulse-counting circuits) occurs at a global rate of 18,000 counts s-1 for both the FUV and NUV detectors or at a total local count rate of 114 and 303 counts s-1 for the FUV and NUV, respectively, for point source photometry (Morrissey et al., 2007). According to the encircled energy curves of Morrissey et al. (2007), the central pixel (1.5″ x 1.5″ size) encloses 10% of the total, so the bright limit for a single pixel is about 11 and 30 counts s-1 for FUV and NUV, respectively. This local count rate limit arises because of the high 107 gain of the microchannel plates555http://www.galex.caltech.edu/researcher/techdoc-ch1.html#2 and consequent limit on the local rate of charge extraction from the cathodes without causing damage. For spectrophotometry, the total system peak effective areas of 20 (FUV) and 40 (NUV) cm2 determine the count rates for our 4.5e-13 erg cm-2 s-1 Å-1 bright limit for both the FUV and NUV. Using spectral widths of 2.46 (FUV) and 6.06 (NUV) Å pixel-1, the corresponding count s-1 rates for an infinite extraction width perpendicular to the dispersion are 1.7 (FUV) and 12.7 (NUV), which are conservative and well below the 11 and 30 count rate limits for a 10% non-linearity and single pixel area. For a single spectrum of a hot star with our brightness limit, the total grism count rate is also well below the 18,000 global rate limit. For example, the FWHM of the NUV GALEX effective area is 700 Å, the number of pixels at 6.06 Å pixel-1 is 116, and the total count rate is of order 116*12.7, i.e. 1500 count s-1.
| Star | CALSPEC Name | FUVaa10-13erg s-1 cm-2 Å-1 for the CALSPEC SED at the reference wavelengths of 1539 and 2316 Å. | NUVaa10-13erg s-1 cm-2 Å-1 for the CALSPEC SED at the reference wavelengths of 1539 and 2316 Å. | Comment |
|---|---|---|---|---|
| BD+33∘2642 | bd_33d2642_fos_003 | 28.0 | 13.5 | Saturation |
| G191B2B | g191b2b_mod_010 | 70.1 | 16.5 | Saturation |
| GD153 | gd153_mod_010 | 13.3 | 3.34 | FUV Saturation |
| GRW+70∘5824 | grw_70d5824_stisnic_007 | 8.81 | 2.75 | FUV Saturation, NUV Outlier |
| HZ4 | hz4_stis_005.fits | … | 0.31 | No STIS or FOS at 1850 Å |
| HZ21 | hz21_stis_004 | 4.10 | 1.08 | Good, 1625 Å bin omitted |
| HZ43 | hz43_stis_004 | 22.7 | 5.47 | Saturation |
| HZ44 | hz44_stis_004 | 43.1 | 15.9 | Saturation |
| LDS749B | lds749b_stisnic_006 | 0.27 | 0.27 | Good |
| P177D | p177d_stisnic_007 | … | 0.004 | No CALSPEC 2222 Å Noisy Outlier |
| P330E | p330e_stisnic_008 | … | 0.009 | No CALSPEC 2000 Å Noisy Outlier |
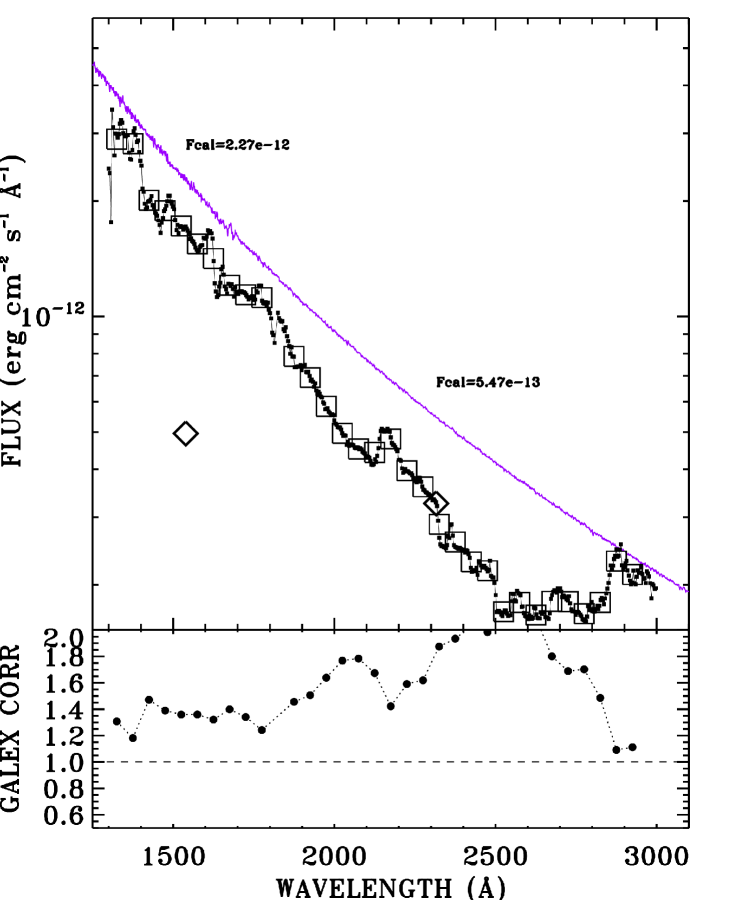
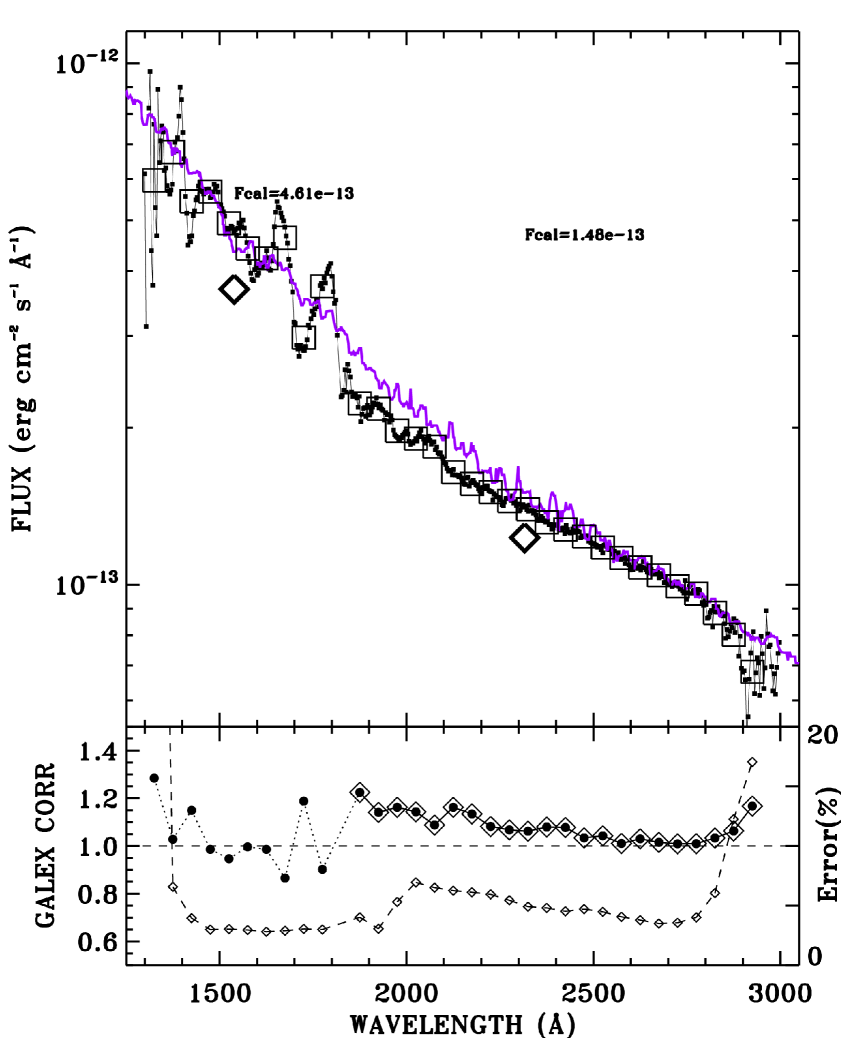
The exact count rates for saturation depend not only on the source flux but also on the brightness of other objects in the field-of-view (FOV), on how close the spectrum is to the detector edge, and possibly on the exact thermal conditions. While detailed predictions of the amount of saturation are not within the scope of this paper, our guideline of a 4.5e-13 erg cm-2 s-1 Å-1 non-linearity limit for both the FUV at 1539 Å and the NUV at 2316 Å is determined by comparing the GALEX spectral flux with the reference CALSPEC or IUE SED. For example, the IUE 1539 Å spectrophotometric flux of GD108 is 4.61e-13 erg cm-2 s-1 Å-1, and the GALEX SED agrees poorly with IUE at some wavelengths. Conversely, the corresponding IUE flux for HZ21 is 4.31e-13 erg cm-2 s-1 Å-1, and IUE agrees with the GALEX flux within 5% from 1325 to 1775 Å. The LDS747B flux of Figure 1 is below 4.5e-13 erg cm-2 s-1 Å-1 in both the FUV and NUV, while the HZ43 GALEX SED in Figure 2 is expected to be low due to some saturation. Occasionally for a reference flux slightly above 4.5e-13, a GALEX SED will have minimal saturation losses in the archival SED; but these cases are excluded for consistency.
The GALEX broadband photometry of HZ43 is even more saturated than the GALEX spectral data, as can be expected. For the above local 10% non-linearity count rate limits, the corresponding effective flux of the broadband photometry for the zeropoints of Morrissey et al. (2007) is about 1.6e-13 at 1539 Å and 5.7e-14 at 2316 Å in erg s-1 cm-2 Å-1 units. In Figure 1, the GALEX broadband photometry (diamonds) and the GALEX spectrophotometry (squares) are both below their respective saturation limits, and their good agreement confirms that both the photometry and spectrophotometry have minimal non-linearities.

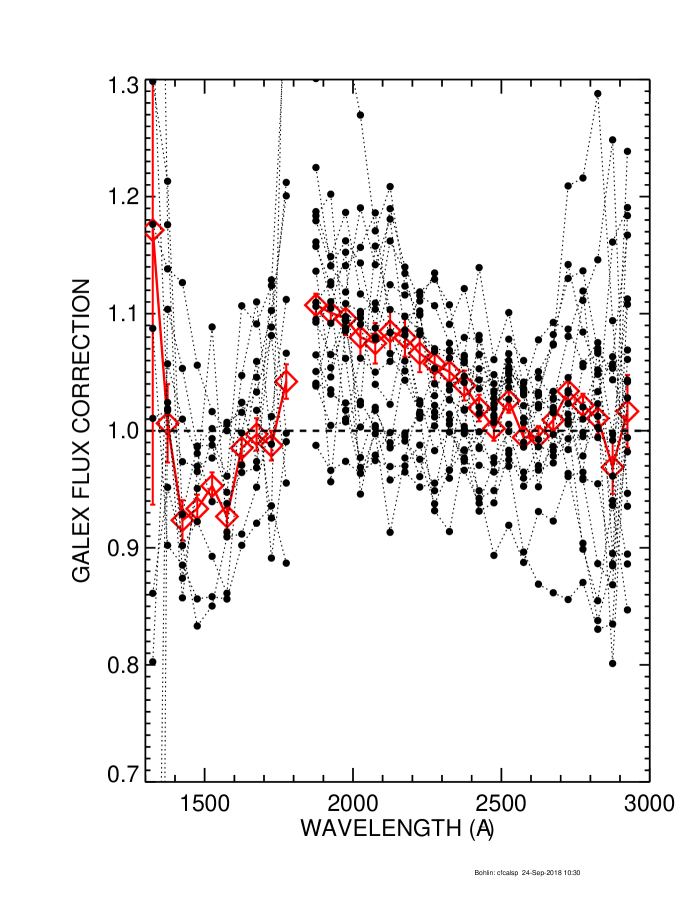
As detailed in Table 1, the GALEX spectra of four stars are saturated in both channels, and the two G stars P177D and P330E are too faint and noisy. Two more stars are saturated in the FUV channel, while there are no CALSPEC data below 1850 Å for HZ4. The GALEX flux for GRW+70∘5824 is almost a factor of two below our adopted saturation limit in the NUV but is still lower than CALSPEC by more than 10% and is excluded as an anomaly. Remaining to define the average CALSPEC/GALEX flux ratio are HZ21 and LDS749B in the FUV and GD153, HZ4, HZ21, and LDS749B in the NUV, as illustrated in Figure 3, where the red diamonds are the weighted average of the results for the individual stars. As discussed in Bohlin & Bianchi (2018), the 1625 Å bin for HZ21 is omitted because of the variable 1640.5 Å HeII line that contaminates the ratio for that 50 Å wide bin. The GALEX IDs for the useful CALSPEC comparisons appear in Table 2, along with the useful IUE data that are discussed in the next Section.
4 Comparison of GALEX with Corrected IUE Fluxes
Even though IUE data are less precise than the CALSPEC data from the Space Telescope Imaging Spectrograph (STIS) or Faint Object Spectrograph (FOS), there are many more IUE matches with GALEX spectra than there are CALSPEC matches, so the GALEX flux correction may improve by using IUE data on the CALSPEC flux scale (Bohlin & Bianchi, 2018). The IUE vs. GALEX matches are identified by a detailed cross-match of the two databases that can be found on the project website666http://dolomiti.pha.jhu.edu/uvsky/ and will be described further by Bianchi et al. (in prep). In order to find matches of GALEX spectra with IUE, both databases are downloaded from the MAST archive and are searched for matches with a relatively large 30″ radius, because the IUE coordinates are often imprecise. The IUE NEWSIPS *.MXLO files (Nichols & Linsky, 1996) for the matched GALEX sources are from the MAST archive and are co-added and merged as in Bohlin & Bianchi (2018). After eliminating spurious matches, variable stars, and cases where the IUE spectra are mostly noise, there are 62 potentially useful matches, of which 52 FUV and 44 NUV spectra are brighter than the GALEX saturation limits, have poor data quality, or have no IUE match in either the FUV or in the NUV. As collated in Table 2, there remain 10 FUV and 18 NUV matches to define the average GALEX flux correction, as illustrated in Figure 4. All matches have only one good GALEX observation, except for HZ4 and Q1302-102, which have two good GALEX SEDs. Table 2 contains the star names, coordinates, the IUE stellar flux in the 1539 and 2316 Å regions with the number of IUE observations in parentheses, and the GALEX spectral data IDs. For the eight cases lacking FUV measures of the IUE/GALEX flux ratio, the reason for the lack is indicated as GALEX saturation or poor IUE data quality, preceding the GALEX ID.
| Star | RA | DEC | SWPaa10-13erg s-1 cm-2 Å-1 and in parentheses are the number of co-added IUE spectra. | LWaa10-13erg s-1 cm-2 Å-1 and in parentheses are the number of co-added IUE spectra. | GALEX ID |
|---|---|---|---|---|---|
| BPM16274 | 00 50 03.7 | -52 08 16 | 1.93 (7) | 0.64 (6) | 3363524954127600797 |
| SK194 | 01 45 03.8 | -74 31 33 | 1.68 (2) | 1.36 (2) | Poor Data,3069735447185853590 |
| SK196 | 01 49 12.6 | -74 00 37 | 2.00 (2) | 1.49 (2) | Poor Data,3069735447185857034 |
| GD50 | 03 48 50.2 | -00 58 32 | 7.34 (8) | 1.82 (3) | Sat.,3363595322871777529 |
| HZ4 | 03 55 22.0 | +09 47 18 | 0.74 (3) | 0.30 (4) | 3363665691615955843,3365847122685462904 |
| LB227 | 04 09 28.9 | +17 07 54 | 0.44 (5) | 0.17 (7) | 3363771244732219841 |
| HZ2 | 04 12 43.6 | +11 51 49 | 3.29 (5) | 0.98 (5) | 3363806429104310591 |
| WD0416-550 | 04 17 11.4 | -54 57 47 | 1.64 (1) | 0.42 (1) | 3065126294442221024 |
| HG7-233 | 04 28 39.4 | +16 58 12 | 3.56 (1) | 1.08 (1) | 3125608230062916337 |
| GD108 | 10 00 47.3 | -07 33 31 | 4.61 (3) | 1.48 (3) | Sat.,3364158272825200648 |
| HZ21 | 12 13 56.2 | +32 56 31 | 4.31 (17) | 1.13 (13) | 3364299010313555707 |
| FEIGE59 | 12 17 21.7 | +15 34 58 | 2.09 (2) | 1.26 (2) | 3061924516582135538 |
| GD153 | 12 57 02.3 | +22 01 53 | 13.4 (11) | 3.30 (10) | Sat.,3364510116546092547 |
| Q1302-102 | 13 05 33.0 | -10 33 19 | 0.33 (7) | 0.12 (4) | 3167899845313694736,3186864221869575184 |
| LDS749B | 21 32 16.2 | +00 15 14 | 0.27 (4) | 0.27 (4) | 3364861960266984897 |
| StHA190 | 21 41 44.9 | +02 43 54 | 9.90 (3) | 2.75 (1) | Sat.,3192951118238843864 |
| G93-48 | 21 52 25.4 | +02 23 20 | 6.12 (3) | 2.20 (3) | Sat.,3365002697755334688 |
| L791-40 | 23 19 35.4 | -17 05 28 | 0.17 (2) | 0.33 (2) | Poor Data,3365213803987864904 |
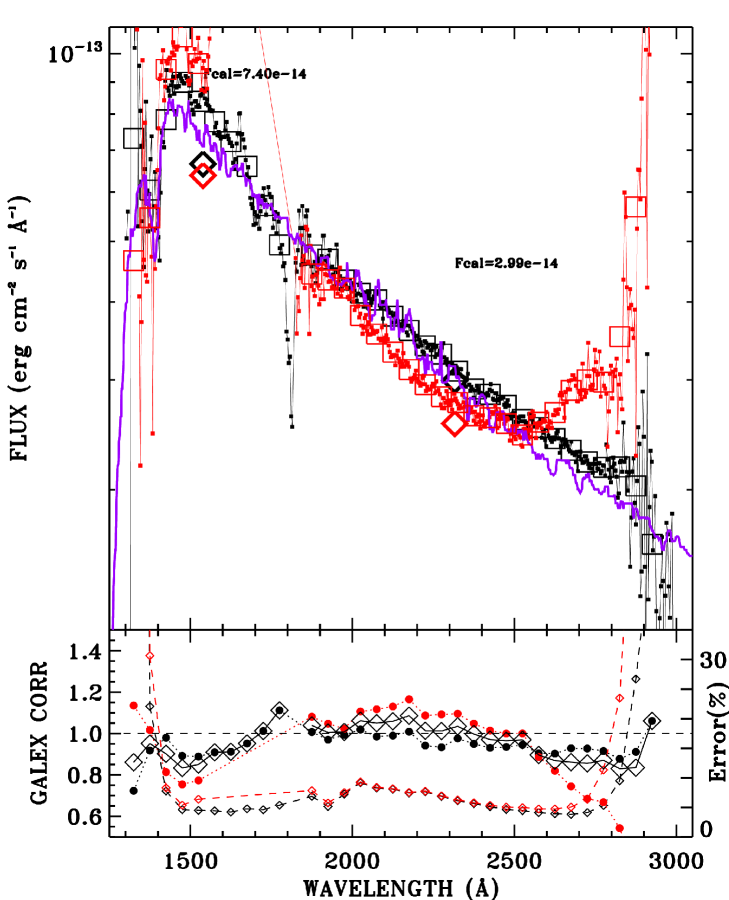
An example for HZ4 of a star with two good GALEX data sets appears in Figure 5. In the NUV, the second GALEX observation (red) lies below the first (black) shortward of 2600 Å but shoots up abruptly longward of 2600 Å because of a slightly erroneous wavelength assignment before the application of the steep GALEX sensitivity function. In other words, an astrometric error makes the wavelengths a bit high in this case, which causes smaller sensitivities to be assigned with the largest impact in the region of the sharp effective area decrease longward of 2600 Å. HZ4 illustrates our worst case for this occasional GALEX processing error, which affects our final grand average correction by . The uncertainty of the abrupt upturn (red diamonds in the lower panel) increases in correspondence with the erroneous flux upturn and becomes larger than the uncertainty of the better observation (black diamonds), so the weighted average GALEX correction (large black diamonds) is very near the more reliable first observation (black dots). The final IUE/GALEX flux ratio for HZ4 is an average which uses the combined uncertainties of GALEX and IUE as weights. Because there are no valid GALEX bins in the second observation (red circles) in the FUV longward of 1525 Å, the average correction for HZ4 is defined only by the first (black) dataset from 1575–1775 Å.
Shortward of 2600 Å in the regions of the best sensitivities, the repeatability is 10% between the separate GALEX observations (red and black squares in Figure 5). This Figure 5, a similar plot for Q1302-102, and the scatter among the Figure 4 stars suggest that GALEX spectrophotometry has a typical repeatability of 10–20%.
An example of a star with flux just above our FUV limit of 4.5e-13 erg s-1 cm-2 Å-1 appears in Figure 6. The choppy nature of the GALEX flux distribution in regions of low sensitivity with a jump of 30% from the 1675 to the 1725 Å bin could be caused by unflagged overlapping spectra, astrometric errors, or a cosmetic detector artifact. Consistent with a variable saturation limit is GD50 with a 1539 Å flux of 7.34e-13 from Table 2. The largest deviation from unity in the GD50 IUE/GALEX FUV flux-ratio is 10%, but the FUV GALEX data for GD50 is still excluded for consistency.
5 Conclusions
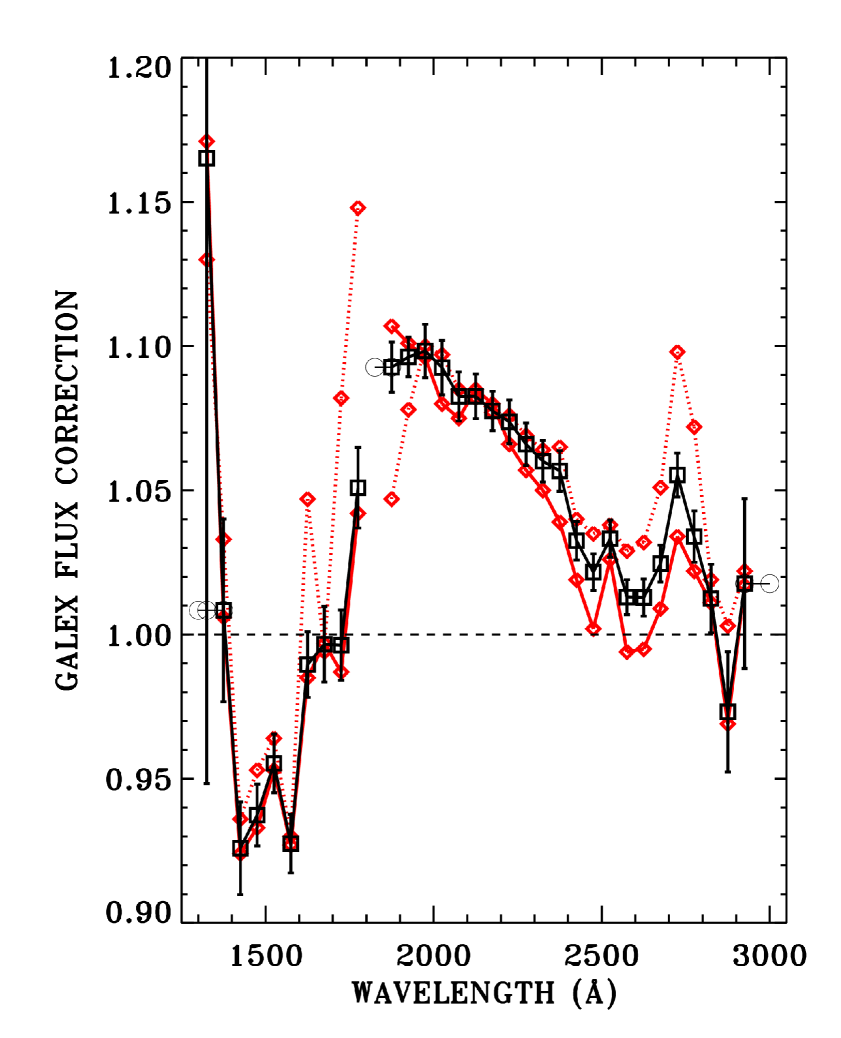
For stars below our adopted saturation limits of 4.5e-13 erg s-1 cm-2 Å-1, Figure 7 shows the correction factors derived from the separate comparisons of GALEX with CALSPEC (red diamonds connected by a dotted line) and IUE (red diamonds connected by a solid line) and the final weighted average GALEX spectroscopic correction in black. In the FUV, the CALSPEC/GALEX uncertainties are all larger than the IUE/GALEX uncertainties, so the final results (black squares) are dominated by the IUE correction. However in the NUV, the CALSPEC results tend to have the lower uncertainty shortward of 2625 Å. At the 1325 Å bin, the error bar is so large and the value (black square) is so extreme that the weighted correction is replaced with the more conservative guess of assigning the 1375 Å value of 1.008 at 1325 Å. The endpoint bins of 1325 and 2925 Å are extended to 1300 and 3000 Å, respectively, to achieve full coverage of the GALEX spectral range. Finally, the NUV average at 1875 is extended shortward to 1825 Å. These four extension points appear as open circles in Figure 7.
Table 3 contains the values of the multiplicative GALEX spectroscopic flux correction, which can be interpolated to find intermediate correction values. In the 1775–1825 Å gap between the FUV and NUV, interpolation is still adequate for the rare valid GALEX data point that might fall in that gap. The formal statistical uncertainties in Table 3 may be too optimistic, especially in the regions where the independent CALSPEC and IUE corrections, i.e. red points in Figure 7, disagree by more than the size of the black 1 error bars. For example, in the NUV longward of 2350 Å, 3% is a more conservative estimate of the uncertainty of the correction. For any single GALEX spectrum, the precision of the corrected fluxes is limited by the 10-20% repeatability floor for a single observational visit. Statistically, an average of at least 10 GALEX visits is required before a 3% uncertainty in the average flux correction becomes important.
6 Electronically Available Results
The co-added and merged IUE spectra for the 18 stars of Table 2 and Table 4 along with the Table 3 GALEX correction factors are available in the on-line version of this paper, in MAST as High-Level Science Products (HLSP)777https://archive.stsci.edu/prepds/galex-fluxcal/, and in the project web site888http::/dolomiti.jhu.edu/uvsky/. The IUE merged ascii files of Table 4 combine the datasets described in Section 4 and cross from SWP to the long wavelength (LW) cameras at 1975 Å. These merged files contain eight columns: (1) wavelength in Å, (2) the average net signal in linearized IUE Flux Number (FN) units per second, (3) the average flux in erg cm-2 s-1 Å-1, (4) the background signal in the same units as the net, (5) the formal propagated uncertainty as the error-in-the-mean in flux units, (6) the number of observations averaged, (7) the total exposure time in seconds, and (8) the rms scatter among the observations in percent. Our next paper will make electronically available the useful portion of the GALEX spectral collection of over 100,000 SEDs corrected to the CALSPEC scale. More details of our work along with the machine readable files also appear on the project website999http://dolomiti.pha.jhu.edu/uvsky/.
7 Summary
Our comparison of GALEX UV-grism fluxes to the HST-based absolute flux standards in CALSPEC and to corrected IUE SEDs (Bohlin & Bianchi, 2018) produces a correction to the GALEX spectroscopic flux scale. The correction is wavelength-dependent and covers the GALEX range of sensitivity from 1300 to 3000 Å. To be on the HST/CALSPEC flux scale, GALEX archival fluxes should be multiplied by these Table 3 correction factors that range from 0.926 to 1.098. With this flux correction, the fainter sources that will be available in our upcoming catalog of GALEX spectra will support cross-calibration and planning of observations with future UV space missions.
Acknowledgements
Karen Levy, Bernie Shiao, and Randy Thomson provided many helpful suggestions and clarifications with regard to the GALEX MAST database. Scott Fleming entered our HLSP into MAST. Support for this work was provided by NASA through the Space Telescope Science Institute, which is operated by AURA, Inc., under NASA contract NAS5-26555. LB acknowledges support from NASA grant NNX16AF40G. This research made use of the SIMBAD database, operated at CDS, Strasbourg, France.
ORCID iDs
Ralph C. Bohlin https://orcid.org/0000-0001-9806-0551 and Luciana Bianchi https://orcid.org/0000-0001-7746-5461
| Wavelength (Å) | Correction | Uncertainty |
|---|---|---|
| 1300 | 1.008 | … |
| 1325 | 1.008 | … |
| 1375 | 1.008 | 0.032 |
| 1425 | 0.926 | 0.016 |
| 1475 | 0.937 | 0.011 |
| 1525 | 0.955 | 0.010 |
| 1575 | 0.927 | 0.010 |
| 1625 | 0.990 | 0.011 |
| 1675 | 0.997 | 0.013 |
| 1725 | 0.996 | 0.012 |
| 1775 | 1.051 | 0.014 |
| 1825 | 1.093 | … |
| 1875 | 1.093 | 0.009 |
| 1925 | 1.096 | 0.007 |
| 1975 | 1.098 | 0.009 |
| 2025 | 1.093 | 0.009 |
| 2075 | 1.083 | 0.008 |
| 2125 | 1.083 | 0.008 |
| 2175 | 1.078 | 0.007 |
| 2225 | 1.074 | 0.008 |
| 2275 | 1.066 | 0.007 |
| 2325 | 1.060 | 0.007 |
| 2375 | 1.057 | 0.007 |
| 2425 | 1.033 | 0.007 |
| 2475 | 1.022 | 0.006 |
| 2525 | 1.033 | 0.006 |
| 2575 | 1.013 | 0.006 |
| 2625 | 1.013 | 0.006 |
| 2675 | 1.025 | 0.006 |
| 2725 | 1.055 | 0.008 |
| 2775 | 1.034 | 0.009 |
| 2825 | 1.012 | 0.012 |
| 2875 | 0.973 | 0.021 |
| 2925 | 1.018 | 0.029 |
| 3000 | 1.018 | … |
Note. — Table 3 is published in its entirety in machine-readable format.
| Wavelength (Å) | Net (s-1) | Fluxaaerg s-1 cm-2 Å-1 | Bkg (s-1) | Sigmaaaerg s-1 cm-2 Å-1 | No. Obs | Exp (s) | RMS (%) |
|---|---|---|---|---|---|---|---|
| BPM16274 | |||||||
| 1152.26 | 2.649e-02 | 2.564e-13 | 5.917e-02 | 1.928e-14 | 5.0 | 25197.9 | 13.45 |
| 1153.93 | 2.589e-02 | 2.353e-13 | 5.150e-02 | 1.562e-14 | 7.0 | 33596.9 | 14.44 |
| 1155.61 | 3.330e-02 | 2.827e-13 | 5.153e-02 | 1.568e-14 | 7.0 | 33596.9 | 11.31 |
| 1157.29 | 2.781e-02 | 2.198e-13 | 5.156e-02 | 1.373e-14 | 7.0 | 33596.9 | 15.01 |
| 1158.96 | 3.432e-02 | 2.507e-13 | 5.159e-02 | 1.334e-14 | 7.0 | 33596.9 | 12.41 |
| 1160.64 | 3.837e-02 | 2.584e-13 | 5.162e-02 | 1.270e-14 | 7.0 | 33596.9 | 9.57 |
References
- Barger et al. (2012) Barger, A. J., Cowie, L. L., & Wold, I. G. B. 2012, ApJ, 749, 106
- Bertone & Chavez (2011) Bertone, E., & Chavez, M. 2011, Ap&SS, 335, 69
- Bianchi (2012) Bianchi, L. 2012, in IAU Symposium, Vol. 283, IAU Symposium, 45–52
- Bianchi et al. (2018a) Bianchi, L., de la Vega, A., Shiao, B., & Bohlin, R. 2018a, Ap&SS, 363, 56
- Bianchi & Garcia (2002) Bianchi, L., & Garcia, M. 2002, ApJ, 581, 610
- Bianchi & Garcia (2014) —. 2014, Advances in Space Research, 53, 973
- Bianchi et al. (2018b) Bianchi, L., Keller, G. R., Bohlin, R., Barstow, M., & Casewell, S. 2018b, Ap&SS, 363, 166
- Bianchi et al. (2012) Bianchi, L., Manchado, A., & Forster, K. 2012, in IAU Symposium, Vol. 283, IAU Symposium, 308–309
- Bohlin & Bianchi (2018) Bohlin, R. C., & Bianchi, L. 2018, AJ, 155, 162
- Bohlin et al. (2014) Bohlin, R. C., Gordon, K. D., & Tremblay, P.-E. 2014, PASP, 126, 711 (B14)
- Bohlin & Koester (2008) Bohlin, R. C., & Koester, D. 2008, AJ, 135, 1092
- Burgarella et al. (2005) Burgarella, D., Buat, V., Small, T., et al. 2005, ApJ, 619, L63
- Cowie et al. (2010) Cowie, L. L., Barger, A. J., & Hu, E. M. 2010, ApJ, 711, 928
- Deharveng et al. (2008) Deharveng, J.-M., Small, T., Barlow, T. A., et al. 2008, ApJ, 680, 1072
- Gal-Yam et al. (2008) Gal-Yam, A., Bufano, F., Barlow, T. A., et al. 2008, ApJ, 685, L117
- Garcia & Bianchi (2004) Garcia, M., & Bianchi, L. 2004, ApJ, 606, 497
- Godon et al. (2014) Godon, P., Sion, E. M., Starrfield, S., et al. 2014, ApJ, 784, L33
- Herald & Bianchi (2007) Herald, J. E., & Bianchi, L. 2007, ApJ, 661, 845
- Herald & Bianchi (2011) —. 2011, MNRAS, 417, 2440
- Joyce et al. (2018) Joyce, S. R. G., Barstow, M. A., Casewell, S. L., et al. 2018, MNRAS, 479, 1612
- Montez et al. (2017) Montez, Jr., R., Ramstedt, S., Kastner, J. H., Vlemmings, W., & Sanchez, E. 2017, ApJ, 841, 33
- Morrissey et al. (2007) Morrissey, P., Conrow, T., Barlow, T. A., et al. 2007, ApJS, 173, 682
- Nichols & Linsky (1996) Nichols, J. S., & Linsky, J. L. 1996, AJ, 111, 517
- Pala et al. (2015) Pala, A. F., Gänsicke, B. T., Beuermann, K., et al. 2015, in Astronomical Society of the Pacific Conference Series, Vol. 493, 19th European Workshop on White Dwarfs, ed. P. Dufour, P. Bergeron, & G. Fontaine, 521
- Valencic et al. (2004) Valencic, L. A., Clayton, G. C., & Gordon, K. D. 2004, ApJ, 616, 912
- Wold et al. (2017) Wold, I. G. B., Finkelstein, S. L., Barger, A. J., Cowie, L. L., & Rosenwasser, B. 2017, ApJ, 848, 108