11email: ida@elsi.jp 22institutetext: Department of Earth and Planetary Sciences, Tokyo Institute of Technology, Meguro-ku, Tokyo 152-8551, Japan
Water delivery by pebble accretion to rocky planets in habitable zones in evolving disks
Abstract
Context. The Earth’s ocean mass is only of the whole planet mass. Even including water in the interior, the water fraction would be at most . Ancient Mars may have had a similar or slightly smaller water fraction. It has not been clear what controlled the amount of water in these planets, although several models have been proposed. It is important to clarify the control mechanism to discuss water delivery to rocky planets in habitable zones in exoplanetary systems, as well as that to the Earth and Mars in our Solar system.
Aims. Here, we consider water delivery to planets by icy pebbles after the snowline inwardly passes the planetary orbits. We derive the water mass fraction () of the final planet as a function of disk parameters and discuss the parameters that reproduce a small value of comparable to that inferred for the Earth and ancient Mars.
Methods. We calculate the growth of icy dust grains to pebbles and the pebble radial drift with a 1D model, by simultaneously solving the snowline migration and dissipation of a gas disk. With the obtained pebble mass flux, we calculate accretion of icy pebbles onto planets after the snowline passage to evaluate of the planets.
Results. We find that is regulated by the total mass () of icy dust materials preserved in the outer disk regions at the timing () of the snowline passage of the planetary orbit. Because decays rapidly after the pebble formation front reaches the disk outer edge (at ), is sensitive to the ratio , which is determined by the disk parameters. We find or is important. Analytically evaluating , we derive an analytical formula of that reproduces the numerical results.
Conclusions. Using the analytical formula, we find that of a rocky planet near 1 au is similar to the Earth, , in the disks with initial disk size of 30-50 au and the initial disk mass accretion rate of for disk depletion timescale of a few M years. Because these disks may be median or slightly compact/massive disks, our results suggest that the water fraction of rocky planets in habitable zones may be often similar to that of the Earth, if the icy pebble accretion is responsible for the water delivery.
Key Words.:
Planets and satellites: formation, Accretion, Accretion disks1 Introduction
Earth-size planets are being discovered in habitable zones in exoplanetary systems. Habitable zones (HZs) are defined as a range of orbital radius, in which liquid water can exist on the planetary surface, if H2O exist there. However, as long as equilibrium temperature is concerned, H2O ice grains condense only well beyond the habitable zones, because the gas pressure of protoplanetary disks is many orders of magnitude lower than that of planetary atmosphere and the condensation temperature is considerably lower than that at 1 atm. Hereafter, we simply call H2O in solid/liquid phase as “water.” For the Earth, volatile supply by the gas capture from the disk is ruled out, because observed values of rare-Earth elements are too low in the Earth to be consistent with the disk gas capture (e.g., Brown 1949). Therefore, the water in the Earth would have been delivered from the outer regions of the disk during planet formation.
One possible water delivery mechanism to the Earth is inward scattering of water-bearing asteroids by Jupiter (e.g., Raymond et al. 2004). If this is a dominant mechanism of water delivery, the amount of delivered water is rather stochastic and depends on configurations of giant planets in the planetary systems. If water is not delivered, a rocky planet in a HZ may not be able to be an actual habitat. On the other hand, too much water makes a planet without continents, where nutrients supply may not be as effective as in the Earth. The ocean of the Earth comprises only 0.023 wt.% and such a right amount enables ocean and continents to coexist. The mantle may preserve water in the transition zone with a comparable amount of the ocean (e.g., Bercovici & Karato 2003; Hirschmann 2006; Fei et al. 2017), while the core could have H equivalent to 2 wt.% of H2O of the Earth (Nomura et al. 2014). However, the original water fraction of the Earth would still be very small (), even with the possible water reservoir in the interior, because neither stellar irradiation at au (Machida & Abe 2010) nor giant impacts (Genda & Abe 2005) can vaporize the majority of the water from the Earth’s gravitational potential. Note that it is inferred that Mars may have subsurface water of of Mars mass (e.g., di Achille & Hynek 2010; Clifford et al. 2010; Kurokawa et al. 2014). From the high D/H ratio observed in the Venus atmosphere, the early Venus may also have had ocean of the fraction of and lost the H2O vapor through runaway greenhouse effect (e.g., Donahue et al. 1982; Greenwood et al. 2018). The order of water fraction looks similar at least between the Earth and the ancient Mars. Although the estimated total mass fraction of water in the Earth and Mars has relatively large uncertainty ranging from to , the range is still much smaller than the dispersion predicted by the water-bearing asteroid collision model, which ranges from to , depending on the formation timing, the history of orbital migration/eccentricity evolution of gas giant planets and the original surface density of planetesimals (e.g., Morbidelli et al. 2000; Lunine et al. 2003; Raymond et al. 2004; O’Brien et al. 2014; Matsumura et al. 2016). It is not clear if the similar orders of water fraction between the Earth and Mars is just a coincidence.
Sato et al. (2016) investigated water delivery by icy pebble accretion. The pebble accretion has been proposed as a new mode of planet accretion (e.g., Ormel & Klahr 2010; Lambrechts & Johansen 2012). Radiative transfer calculations for viscous accretion disk models show that the water snowline at K may migrate to inside of 1 au with the grain opacity of size, when the disk accretion rate is (e.g., Garaud & Lin 2007; Min et al. 2011; Oka et al. 2011), which is a typical value of of classical T-Tauri stars (Hartmann et al. 1998). After the snowline inwardly passes a planetary orbit, icy pebbles can be accreted by the planet. In situ ice condensation near the planet orbit is unlikely, because the disk gas there was once in outer region before it migrates to the inner region and icy components have been already condensed to icy grains and subtracted in the outer region (Morbidelli et al. 2016; Sato et al. 2016). Sato et al. (2016) calculated the time evolution of icy pebble mass flux, the solid surface density in the disk, and the growth of a hypothetical planet at 1 au by icy pebble accretion with a 1D model. They found that the pebble accretion is so efficient that the water fraction of the planet rapidly increases after the snowline passage. They assumed a static disk and artificially set the timings of snowline passage and removal of the disk that truncates pebble accretion. They found that the water mass fraction of the final planet is very sensitive to these timings and it is zero or more than 0.1 in many cases. The modest water mass fraction of is possible only if the disk is compact () and the snowline passage at 1 au later than 2–4 My after icy dust growth starts, which could be a narrow window of the parameters.
The sensitive dependence of the final water fraction requires that the snowline migration and the decay of the icy dust surface density must be consistently calculated in an evolving disk. Here we use the disk evolution model based on the self-similar solution for accretion disks with constant viscosity parameter (Lynden-Bell & Pringle 1974)111The wind-driven disk accretion that is recently proposed (e.g., Suzuki et al. 2016; Bai et al. 2016) is commented on in section 2.1. The snowline migration, the disk gas decay, and growth/drift of pebbles and the associated evolution of the icy dust surface density are simultaneously calculated by a 1D disk evolution model. The growth and drift of pebbles are tracked using the single-size approximation formulated by Ormel (2014) and Sato et al. (2016), which enables us to perform fast calculations and survey broad ranges of parameters. Using the numerical results, we will also derive an analytical formula for the final water mass fraction of the planets determined by the disk model parameters.
In section 2, we describe the calculation model that we used. In section 3, the results of numerical simulation are shown. We derive the semi-analytical formula that successfully reproduces the numerical results in section 4. In section 5, using the analytical formula, we study the dependence of the planetary water fraction on the disk and pebble accretion parameters, and discuss the disk parameters to realize the water fraction of , which corresponds to the present Earth and ancient Mars. We will show that the disk parameters are not in a narrow window and are rather realized in modest disks. Sections 6 and 7 are discussion and summary.
2 Method
2.1 Gas disk model
In general, an accretion disk consists of an inner region where the viscous heating is dominated and an outer region where irradiation from the host star is dominated. According to Ida et al. (2016), we set the disk mid-plane temperature for the viscous-heating dominated region () and the irradiation dominated region () to be
| (1) | ||||
| (2) |
where is the distance from the host star, is the disk gas accretion rate, which is almost independent of except in outermost region, and are respectively the luminosity and mass of the host star, and and are their values of the Sun. We adopt the alpha prescription for the disk gas turbulent viscosity (Shakura & Sunyaev 1973), , where is the disk gas scale height, defined by , and are respectively the sound velocity and Kepler frequency, and is a parameter to represent the strength of the turbulence. We here use slightly lower than that in Ida et al. (2016), assuming lower opacity with mm-sized dust grains (Oka et al. 2011), because we consider relatively inner disk regions near the snowline and pebbles there are those which have grown in outer regions and drifted inward. If micron-sized grains are assumed, the same temperature is realized with about ten times smaller .
One fundamental assumption behind Equation (1) is that the rate of viscous heating per unit volume scales linearly with the gas density, and is therefore highest at the midplane. This assumption is questioned by magnetohydrodynamic (MHD) models of protoplanetary disks, which show that accretion heating dominantly takes place on the disk surface (Hirose & Turner 2011). Recently, Mori et al. (2019, submitted) investigated this issue using a series of MHD simulations including all non-ideal MHD effects, finding that the midplane temperature derived from the simulations is generally lower than that from Equation (1) because the heat generated near the disk surface can easily be lost through radiation. Mori et al. (2019) also find that MHD disk winds, which are not included in our disk model, take away of the magnetic energy that would be available for disk heating if the winds were absent. Although there are disk evolution models accounting for the mass and angular momentum loss due to MHD disk winds (e.g., Armitage et al. 2013; Suzuki et al. 2016; Bai et al. 2016; Hasegawa et al. 2017), none of them take into account the two effects mentioned above. For this reason, we opt to adopt the more classical viscous disk model in this study. We note that the viscous accretion model will serve as a good approximation of real protoplanetary disks if some hydrodynamical instabilities drive turbulence near the midplane (see Lyra & Umurhan 2018; Klahr et al. 2018, for recent reviews on hydrodynamic instabilities of protoplanetary disks).
The gas disk aspect ratios corresponding to Eqs. (1) and (2) are
| (3) | ||||
| (4) |
where and are the gas scale hight in the viscous-heating dominated and irradiation dominated regions, respectively. Hereafter, we perform simulations with and , while we retain their dependences in the formulas. The disk region is viscous-heating dominated if . Otherwise, the irradiation dominates. The transition radius between the viscous-heating and irradiation dominated regions is given by
| (5) |
Defining the snowline by the location at K, , where
| (6) |
| (7) |
As decreases with time, the snowline migrates inward in the viscous-heating dominated region until becomes equal to ( for ). For calculating the evolution of the pebble flux, it may be enough to set up a static disk distribution as Sato et al. (2016) did. However, in order to describe the snowline migration and disk gas depletion (which determines timings of start and termination of the icy pebble supply), we need an evolving gas disk model.
Specific orbital angular momentum is proportional to a square root of orbital radius and most of disk mass exists in the outer irradiation dominated region. Angular momentum transfer in the entire disk that determines the snowline migration and the entire disk gas depletion is regulated by the evolution of the outer disk region. The region near the snowline is not a hot region where the viscous heating is significantly higher than the irradiation heating (Eqs. 5 and 6). So, for our purpose, the entire disk evolution model can be approximated by a irradiation dominated disk. In the irradiation dominated disk, the viscosity (Eq. 2). Because it is similar to the disk with the viscosity with a constant , we adopt the self-similar solution with by Lynden-Bell & Pringle (1974) for the dynamical evolution of the entire disk, while we take into account the snowline evolution regulated by time evolution of the viscous heating (Eq. 6).
In the self-similar solution, well inside the initial characteristic disk size (), beyond which the surface density decays exponentially, the disk accretion rate is given as a function of time by
| (8) |
where is the disk gas surface density, is the effective viscosity at , , (where is the viscosity at ), and is the initial disk accretion rate, respectively. Inversely, the time evolution of the surface gas density is given by
| (9) |
where we included the time-dependent exponential taper in the full form of the self-similar solution, because we will need to evaluate the total disk mass. Because , for .
We add the effect of the photoevaporation with the rate , although the standard self-similar solution does not have such a term (also see section 3.1). We are concerned with the region near the snowline. We assume that and the photoevaporation occurs mainly in the outer region with the constant rate of . Accordingly, we set
| (10) | ||||
| (11) |
While we use Eqs. (10) and (11) for the numerical simulation, we use approximate forms, which are easier to be analytically treated, for derivation of analytical formulas, as follows:
| (12) | ||||
| (13) |
Because and are overestimated with Eqs. (12) and (13) only in the exponential tail regions, the approximation does not introduce significant errors in the analytical formulas. 222In the published version in A&A, we started from Eqs. (12) and (13) without explaining the approximation from Eqs. (10) and (11). Integrating Eq. (13), the disk mass at is given by
| (14) |
where we used . The above equations show that the disk accretion rate and the disk gas surface density quickly decay when decreases to the level of . This photoevaporation effect avoids long-tail existence of disk gas significantly longer than a few My.
Here, we describe the disks with the parameters, , , and . The disk depletion timescale () and the disk gas accretion rate onto the host star () are better constrained by observations than the other parameters: y and for solar-type stars (e.g., Haisch et al. 2001; Hartmann et al. 1998; Williams & Cieza 2011; Hartmann et al. 2016). We focus ourselves on the systems around solar-type stars. We assume that angular momentum transfer by turbulent viscous diffusion is a major mechanism for the disk depletion, rather than photoevaporation. We identify as . We use may be slightly higher than the observed averaged values of , because we want to set the snowline beyond the orbits of planetary embryos. We perform simulations with y and y, and and . Although is not observationally well constrained, Sato et al. (2016) showed that this parameter is the most important for the time evolution of the pebble mass flux. For , we use and 300 au, which correspond to the range of the observationally inferred disk size (Williams & Cieza 2011). We adopt the photoevaporation rate and .
The disk diffusion timescale is
| (15) |
where subscript ”1” expresses values at 1au, is viscous coefficient at the outer edge of the disk, and we used . From this equation, is calculated as
| (16) |
Note that the value of that we use in our simulations depends on the choice of the parameters and , but it is within a reasonable range, . In our formulation for disks, we prefer the setting of the observable valuables, and , within the observationally inferred ranges to a simple assumption of a constant .
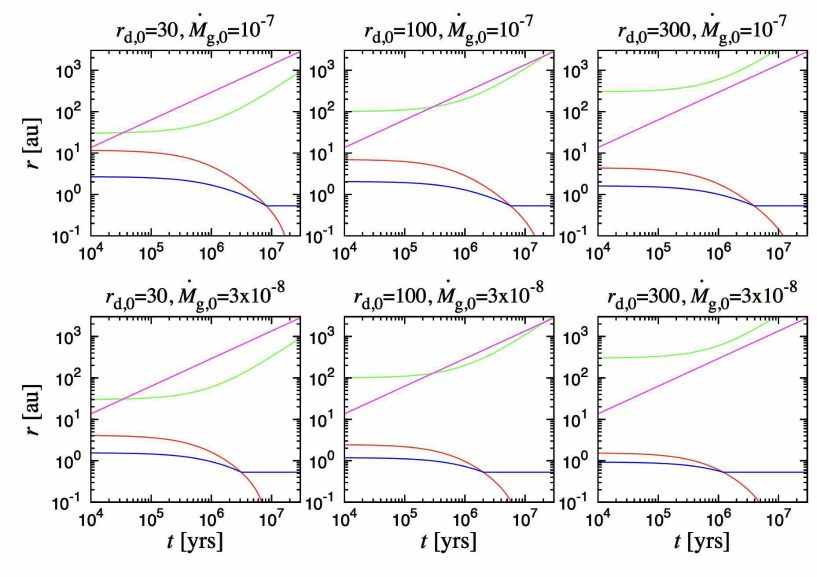
In Figure 1, we show time evolution of the transition radius , the snowline , the disk characteristic radius , and the pebble formation front , which will be derived in section 3.1 as Eq. (38) , for six typical parameters of disk evolution. In general, in magenta lines evolves faster than in green lines and the pebble flux quickly decays after exceeds , as we will discuss in section 3.1. The snowline in blue lines shrinks with time as long as it is in the viscous-heating region (inside of in red lines).
2.2 Dust/pebble evolution model
For calculating the pebble mass flux, we adopt the method with the single size approximation formulated by Ormel (2014) and Sato et al. (2016). The size distribution of icy particles obtained by a full-size simulation is generally peaky at some size and the peak size depends on . In the single size approximation, icy dust particles have a single size that depends on , corresponding to the peak size.
Here we briefly summarize the dust evolution model (for more details, see Sato et al. 2016). We set the initial particle surface density as . We adopt . The evolution of the dust/pebble surface density () and the peaked mass of the particles () are calculated by the equation,
| (17) | ||||
| (18) |
where is the particle radius, is the internal density of icy particles, and are the radial and relative velocities of the particles at the midplane, respectively, and is the scale height of the particles given by (e.g. Youdin & Lithwick 2007)
| (19) |
The Stokes number define by is an important dimensionless number in pebble growth and radial drift, where is the stopping time which represents the timescale of particles’s momentum relaxation due to gas drag, given by
| (20) |
where is the thermal velocity, is the mean free path of gas particles, and is gas molecule mass. The mean free path is expressed by where is the molecular collision cross section.
Relative velocity of dust particles is given by
| (21) |
where , and are the relative velocities induced by Brownian motion, radial drift, azimuthal drift, vertical settling, and turbulence, respectively (for detailed expressions, see Sato et al. (2016)). We assume perfect sticking for (otherwise, we set the right hand side of Eq. (18) to be zero).
The radial drift velocity of dust particles is
| (22) |
where is the Kepler velocity and is a deviation of gas rotation velocity from Kepler velocity, which we set
| (23) |
Because the numerical simulation shows for migrating pebbles (section 3.1), we neglected the effect of the disk gas accretion in Eq. (22). The radial drift timescale is
| (24) |
The pebble mass flux through the disk is given by
| (25) |
where is the pebble surface density in the pebble migrating region and we assumed .
2.3 Pebble accretion onto planets
We use the same formulas as Sato et al. (2016) for the pebble accretion rate onto planets, assuming that the planets are already large enough for pebble accretion in the ”settling regime” (e.g., Ormel & Klahr 2010; Guillot et al. 2014). Ormel & Klahr (2010) derived the cross section of pebble accretion as
| (26) |
where is the planetary embryo mass and is the relative velocity between the embryo and pebbles. The 3D pebble accretion rate onto the planetary embryo is given by
| (27) |
where is the spatial mass density of the pebbles and we used Eqs. (25) and (26). The parameter expresses the mass fraction of the accretion flow onto the planet in the pebble flux through the disk before the accretion, which is called a ”filtering factor.” Note that does not directly depend on , , and .
When , the accretion is 2D and in Eq. (27) is replaced by . Accordingly, a complete filtering factor is
| (28) |
While depends on in 2D mode, it still does not depend directly on and . In our simulations, we set the planetary embryos with the masses and semimajor axises identical to Venus, Earth and Mars (eccentricities are set to be zero). In these cases, the relative velocity is given by (”Hill regime”). Substituting this into Eq. (26),
| (29) |
In the numerical simulations, we used a more general formula including ”Bondi regime” and the cut-off parameter () for large St cases (Ormel & Kobayashi 2012). Note that the dependence on cancels in the accretion rate both in 2D and 3D cases and does not directly depend on and in the 3D case. For a small planet, the accretion is in 3D mode. The accretion becomes 2D mode when
| (30) |
The filtering factor is given by
| (31) |
where we used Eq. (23).
We take into account the decrease in dust surface density and pebble flux due to the pebble accretion onto the planets. After the snowline passage, Eq. (17) is rewritten in the grid where the planets exist, as
| (32) |
where is the radial grid size. After the icy pebble accretion onto the planet starts, the pebble mass flux decreases discontinuously at the planet orbits, according to the accretion onto the planets.
2.4 Simulation parameters
The parameters for our simulations are the initial disk characteristic size , the diffusion timescale of the disk , the initial disk gas accretion rate , and the photo-evaporation rate . As we explained in section 2.1, the other disk parameters are calculated by these parameters. We perform simulations with
1) ,
2) ,
3) au,
4) y.
The initial total gas disk mass is given by Eq. (9) as
| (33) |
which ranges from to with the above parameters. Because we start with relatively large , the initial disk mass is relatively large. As we will show in section 4, initially massive disks tend to produce dry planets, while small mass disks tend to produce water-rich planets.
The initial dust surface density distribution is simply given by . With the gas disk evolution, we simultaneously calculate the pebble growth from the dust disk and its migration. The dust disk is depleted by the formation and radial drift of pebbles.
We set Venus, Earth and Mars analogues in circular orbits with the same masses and the semimajor axises as the current Venus, Earth and Mars in Solar system. For the results presented here, we assume and , while we retain the dependence on and in the equations. For other-mass stars, the dependence of and on the stellar mass also have to be considered.
3 Numerical Results
3.1 Icy grain/pebble evolution
We calculate the growth and radial drift of icy grains and pebbles following the method by Sato et al. (2016), which is described in section 2.2. The evolution of icy particles (grains and pebbles) found by simulations of Sato et al. (2016) is summarized as follows:
-
1.
The growth timescale of a particle with mass is well approximated by the simple formula with in Epstein regime (also see Takeuchi & Lin 2005; Brauer et al. 2008) as
(34) where is the initial particle-to-gas ratio in the disk. The timescale of growth from m-size grains to pebbles by several orders of magnitude in radius is
(35) -
2.
The drift timescale becomes shorter as (equivalently, Stokes number St) increases (Eq. 24), while the growth timescale is independent of (Eq. 34). When becomes smaller than , the particle drift effectively starts and starts being sculpted. From Eqs. (24) and (34) with replaced by the particle-to-gas ratio of drifting pebbles (), the equilibrium Stokes number of drifting pebbles is
(36) where we used a typical value of the solid-to-gas ratio of migrating pebble, (Ida et al. 2016), where we adopt is the initial particle-to-gas ratio and adopt for a nominal value.
-
3.
The sensitive -dependence of results in ”an inside-out formation” of pebbles; formation is earlier in inner region and the formation front migrates outward (also see Brauer et al. 2008; Okuzumi et al. 2012; Birnstiel et al. 2012; Lambrechts & Johansen 2014). After the pebble formation front reaches the disk outer edge, rapidly decays uniformly in the disk, because the supply from further outer regions to the outermost region is limited.
As we will show below, the time () at which the pebble formation front reaches the disk outer edge is a very important parameter. The timescale for the pebble formation front to reach the radius of is given with Eq. (35) by
| (37) |
In other words, the pebble formation front radius is given as a function of time () by
| (38) |
The timescale is determined only by in the disk parameters. It is independent of the other disk parameters such as and .
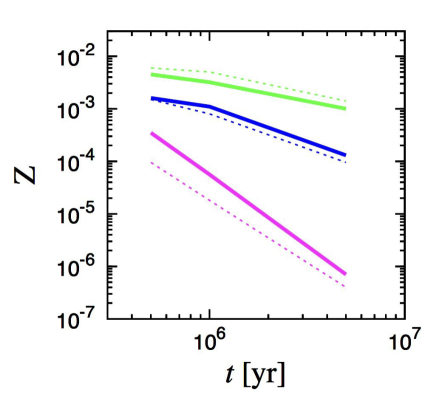
Once the formation front reaches , the supply of solid materials from further outer regions is limited. Accordingly, the pebble formation and drift from there results in the decay of near . The solid surface density at also decays, because it is contributed from drifting pebbles formed near the formation front. Thus, the decay rate of for is regulated by the pebble growth near , and is approximated as . From this relation, at , which is approximated as . However, the numerical results show a faster decrease due to the effect of finite (Sato et al. 2016). The numerically obtained time evolution of at with and 300 au is shown in Fig. 2. For and 300 au, and y, respectively (Eq. 38). We fit the numerical results as
| (39) |
where
| (40) |
Because and the finite does not affect at (Eq. 38), the -dependence as a factor of is reasonable. Although the value of may include an uncertainty due to the disk model and the single-size approximation, we will show in section 5 that the predicted function of the water fraction depends only weakly on .
Note that we assume that collisions between icy pebbles always result in sticking and the pebble size is determined by the drift limit. If the pebble growth is limited by bouncing collisions or collisional fragmentation, St is determined by the threshold velocity for bouncing or fragmentation, which is lower than the value in Eq. (36), and Equation (38) depends on the threshold St. It is a widely accepted idea that pebbles made of H2O ice grains have a high sticking threshold velocity (Wada et al. 2009; Gundlach & Blum 2015), but this will not be the case if the grains are mantled by poorly sticky CO2 (Musiolik et al. 2016). Recent studies have found that this CO2-induced fragmentation can have important implications for the growth of pebble-accreting protoplanets (Johansen et al. 2018) and for the observational appearance of protoplanetary disks (Okuzumi and Tazaki 2019, submitted). How the bouncing and fragmentation barriers affect the water delivery to rocky planets will be studied in future work.
3.2 Water fraction
With the simulated pebble mass flux , we calculated the growth rate of a planet due to icy pebble accretion (). The filtering factor is defined by . When the snowline passes each planetary orbit, we switch on the icy pebble accretion onto the planet. We assume that the 1:1 ratio of rocky to icy fraction of icy pebbles. We set the rocky planets with the Venus, Earth, and Mars masses when the snowline passes 0.72 au, 1.0 au and 1.52 au, respectively. As we will show, the water fraction of final planets is insensitive to .
After the snowline passes a planetary orbit, icy pebble accretion starts. When the cumulative accreted mass by icy pebbles is , the total ice mass in the planet is . The water fraction of the planet at the mass is given by
| (41) |
where is the planetary mass at the snowline passage, . If becomes much larger than , the water fraction saturates to .
We repeat the simulations with different disk parameters, , , , and , to investigate how the water fraction of the final planets depends on these parameters and which values of the parameters produce the water fraction consistent with the terrestrial planets in the Solar system.
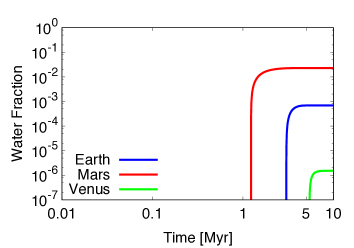
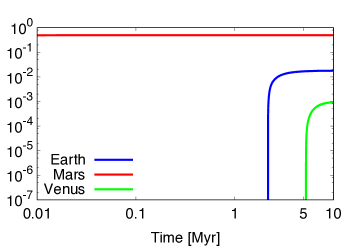
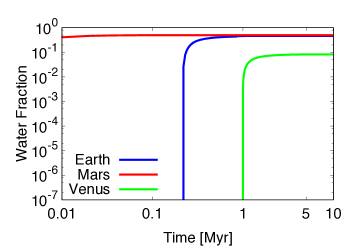
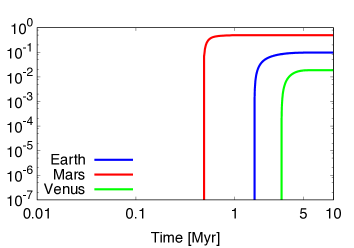
Figure 3 shows the time evolution of water fraction for the models with y, , and . The left, middle and right panels show the results of , 100, and , respectively. We first explain general evolution pattern of the water fraction. In all cases, the water fraction rapidly increases once the snowline passes the planetary orbit and the icy pebble accretion starts. It is saturated to its asymptotic value, even sufficiently before completion of disk gas depletion. From Eqs. (6) and (16),
| (42) |
At with , the snowline is located outside Mars’ orbit. As shown in Fig. 1, the snowline migrates inward and passes through the planetary orbits one after another as the disk accretion rate decreases with time as Eq. (12). The snowline passage always occurs in the order of Mars at 1.52 au, Earth at 1.0 au, and Venus at 0.72 au. Because the initial is closer to the planetary orbits for larger , the snowline passage is earlier for larger , as Figure 3 shows. The water fraction is saturated when and significantly decay. The rapid decay starts at and Eq. (35) shows that is as short as y for au. Even for au, the decay starts at y before disk depletion. Therefore, the evolution of the water fraction evolution is mainly reduced by the consumption of icy dust grain reservoir rather than by the disk gas depletion.
Figure 3 shows a clear trend that the final water fraction is lower for smaller . This trend is explained by a comparison between the snowline passage time and , as follows. The water fraction due to the pebble accretion rapidly increases until decays by more than an order of magnitude, which corresponds to, say, (Eq. 39). If , can be . While is smaller for a smaller (Eq. 35), is larger (Eq. 42). The latter implies that the disk is warmer for a smaller . The viscous heating increases as the blanketing effect by optical depth () increases. In Fig. 3, and are fixed. Smaller means smaller (Eq. 15) and larger (Eq. 9), resulting in a warmer disk. Thereby, the final water fraction is lower for smaller .
We examine the condition of or in more details. In the case of au, y (Eq. 35) and is identified by the timing at which starts rapid increase, which is y, y and y for the Mars, Earth and Venus analogues, respectively (the left panel of Figure 3). Because in this case, even for the outermost Mars analogue. For the Earth and Venus analogues, is further smaller. In the case of au, y (Eq. 35) and y, y and y for Mars, Earth, and Venus analogues, respectively (the right panel of Figure 3). Because , for all of Mars, Earth and Venus. In the middle panel of Figure 3, au and y (Eq. 35). In this case, and for the Venus analogue, while and for the Mars analogue.

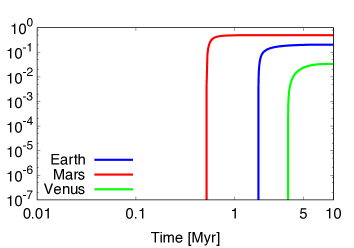
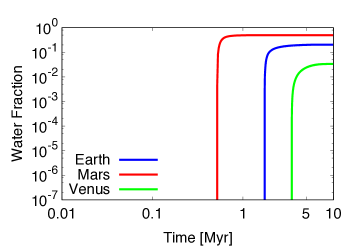
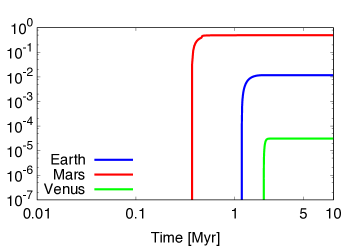
The condition of or also explains other results of the final water fraction of planets, because this condition represents how much icy materials remain at the snowline passage. (In section 5, we will revisit this condition.) Figure 4 is the time evolution of water fraction of (the left panel) and (the right panel), respectively. The other disk parameters are the same. For both cases, y (Eq. 35). The snowline is already inside Mars’ orbit from the beginning () of the calculations, that is, , which results in for the Mars analogue. The snowline passage time is smaller than only for the Venus analogue in the case of (the left panel), and for both the Earth and Venus analogues in the case of (the right panel). This explains the results in Fig. 4.
Figure 5 shows the results of (left) and (right) with au, y, and . Again, y for both cases. Smaller with the fixed means earlier passage of the snowline, resulting in a lower water fraction. Figure 6 shows the results of (left) and (middle) and . With larger , the outer disk region is truncated at shorter radius. The disk truncation reduces the reservoir of icy materials, resulting in a lower water fraction, for the planets (the Earth and Venus analogues) with y.
In section 4, we will derive a semi-analytical formula to predict the water fraction of planets after disk depletion. We will show that the total mass () of the icy dust materials preserved in the disk determines the final water fraction, because they eventually drift to the inner regions and pass the planetary orbits333 The grains at would not undergo radial drift sufficiently, because their growth timesacle is longer than . We here consider disks with .. Since our gas disk model is analytical, we can analytically evaluate . We already know the analytical expression of given by Eq. (38) is a good approximation. We also semi-analytically derived how the icy grain surface density evolves as Eq. (39). Synthesis of these results enables us to derive the semi-analytical formula for .

Finally we point out that is higher in the order of Mars, Earth, and Venus analogues according to the snowline passage timing, except for the fully saturated cases where for all the planets. We will show that the final water fraction is insensitive to the embryo mass. The timing is the most important factor for .
In the next section, we show that the derived semi-analytical expression of reproduces the numerical results. Using the analytical expression, we will clarify the dependence of the final water fraction on the disk parameters and pebble accretion parameters such as the initial planetary mass and Stokes number of accreting pebbles in section 5. We will also survey the disk parameter range that may reproduce comparable to that of the terrestrial planets in our Solar system.
4 Analytical formula for planetary water fraction
The planetary water fraction is calculated by estimating the cumulative mass of accreted icy pebbles (Eq. 41). We can simply estimate it as , where is the total icy dust mass preserved in outer disk regions at the snowline passage, because the pebble flux integrated from the snowline passage time to infinity (effectively, to ) must be similar to .
Equation (41) is approximated to be
| (45) |
where we used for in the upper line. For the range of the disk parameters we used in numerical simulations, the accretion is mostly in the 3D regime (Eq. 30) and . In that case, Eq. (45) shows that is independent of both in the cases of and , while it depends on the disk parameters. Even if the transition to 2D accretion occurs at a smaller planet mass (which happens for smaller values of ), the mass dependence of is still weak: it is proportional to for and independent of otherwise. We can combine the two limits in Eq. (45) by a simple formula as
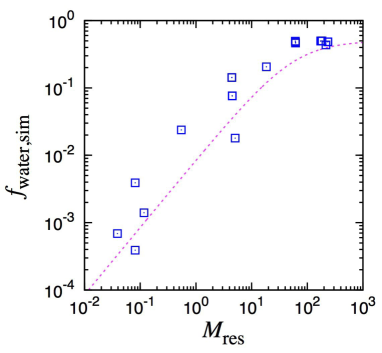
| (46) |
In Figure 7, obtained by our simulations is compared with Eq. (46) with the simulated . This figure shows that Eq. (46) reproduces the numerical results very well. Both the numerical results and Eq. (46) show for . The icy dust mass depends sensitively on the disk parameters, , and . On the other hand, in 2D is independent of these disk parameters, while that in 3D depends only weakly (). In the case of , . As we discussed, is almost constant, so that should be almost proportional to for .
Because the analytical solution given by Eq. (46) reproduces the numerical results, we next derive an analytical formula for the icy dust mass at the snowline passage as follows. From Eq. (6), the snowline passes the planet orbit at when
| (47) |
Using Eq. (16),
| (48) |
From Eq. (12), the snowline passage time is
| (49) |
From Eq. (14), the remaining gas disk mass at the snowline passage is given by
| (50) |
Because , we obtain
| (51) |
where we approximated as from Eq. (39), (Eq. 38), and (Eq. 40). Substituting the filtering factor given by Eq. (31) with St = 0.1 and estimated above into Eq. (46), we can analytically estimate the water fraction from the disk parameters, and as (Eqs. 31 and 41)
| (52) |
where is given by Eq. (51), , and
| (53) | ||||
| (54) |
Except for the value of , which was fitted by the numerical results, the other derivations are analytical. Note that . Around metal-rich stars, would be larger.
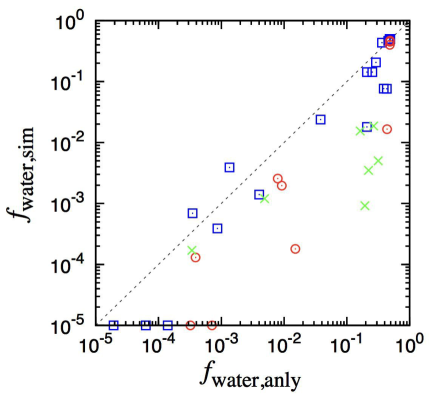
In Figure 8, we compare the analytically estimated water fraction with the numerically simulated . In addition to the Earth analogues () at 1 au, we also plot the results for the Mars analogues () at 1.52 au and the Venus analogues () at 0.72 au. For the Earth and Mars analogues, reproduces within a factor of several, while the water fraction varies by several orders of magnitude, except for some runs where the water fraction is overestimated by the analytical formula. The agreement both for the Earth and Mars analogues strongly suggests that the mass and semimajor axis dependences are also reproduced. In the case of Venus analogues, is larger by a factor of a few to a few tens than . When the Earth analogue increases its mass by capture of pebbles, it captures significant fraction of the pebble flux and the accretion of the Venus analogues that resides in inner region of the Earth analogues can be significantly decreased. This effect is included in the numerical simulation, while it is not taken into account in the analytical formula.
5 Dependence of water fraction on disk parameters
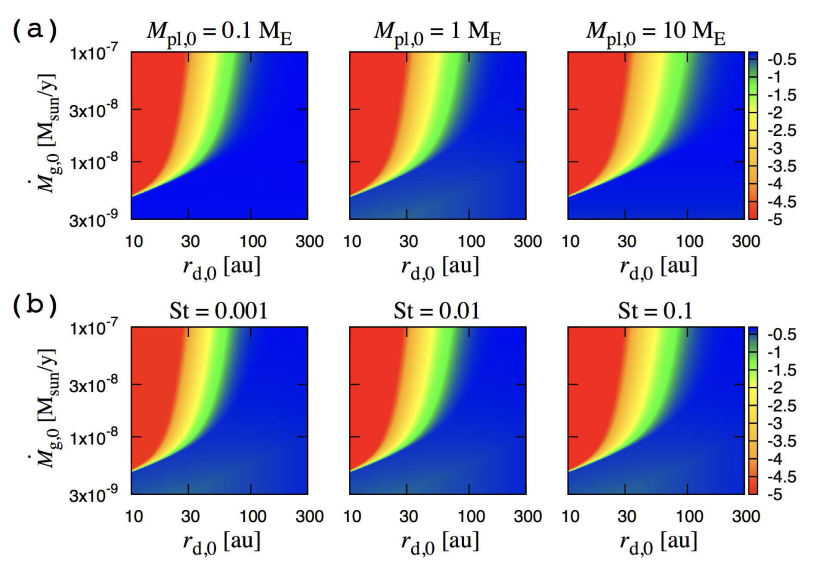
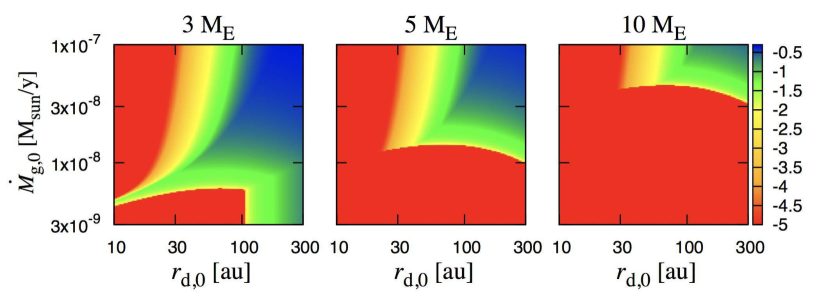
Using the analytical formula, we investigate how the water fraction () is determined by the disk parameters. Figure 9 shows for a planet at au as a function of the disk parameters, and . The other parameters are and . The panels (a) show the dependence on for St = 0.1. The panels (b) show the dependence on St for . The planets formed with the parameters in the red region are very dry, . Those in the green region have modest amount of water, , and those in the blue region are icy planets, . The yellow and orange regions represent , which corresponds to the water fraction of the current Earth and that estimated for the ancient Mars.
We find that is the most sensitive to and . The common features in the contours in Fig. 9 are that i) is lower for smaller and larger , and ii) is realized at and . This is consistent with the conclusion by Sato et al. (2016) that such can be realized for compact disks with sizes and late snowline passage ( My). We here show that the disk parameters for is not in a very narrow window.
As we showed in section 4, is regulated by and is sensitive to and , especially through the parameter (Eq. 51). Because pebble accretion is fast, in order to realize , has to have significantly decayed until . For small , is small (Eq. 38), while is large (Eq. 49) due to small (Eq. 48). For large , is small (Eq. 48) while is the same (Eq. 38). As a result, decays more quickly (Eq. 39) for small and large .
Figure 9 shows the dependences of on the pebble accretion parameters: the initial planetary mass () and the Stokes number (St) of pebbles that accrete onto the planet. In the numerical simulations, the Stokes number of pebbles that accrete onto the planet is calculated by growth and radial drift of pebbles in an evolving disk. According to the simulations, the Stokes number of radially drifting particles is at early times (Eq. 36), but decreases with time as the dust and gas disks evolve. As Eq. (39) shows, decays more rapidly than for . Accordingly, decreases and the equilibrium Stokes number of migrating pebbles become smaller (Eq. 36; also see Sato et al. (2016)). As we have pointed out in section 3.1, if a fragmentation/rebound barrier limits the icy pebble growth, St also becomes small. By these reasons, we also showed plots with St = 0.01 and 0.001 in Fig. 9.
Figure 9 shows that is almost independent of and St. The weak dependence on is explained by the following arguments. The water fraction is in the case of . The dust mass is independent of . The factor is independent of in 3D accretion and weakly depends on in 2D accretion (),
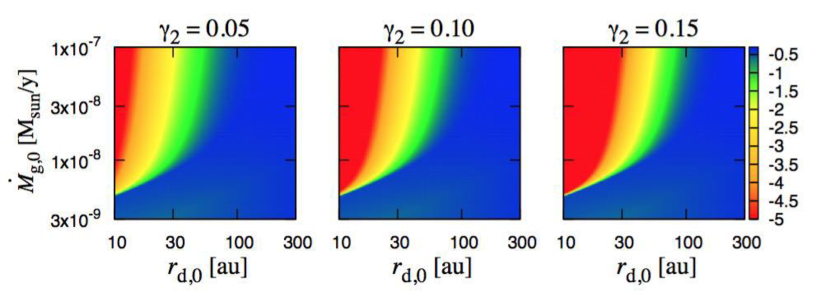
The weak dependence of on Stokes number shown in Figure 9 is resulted by the assumption that is independent of St; it depends on St only weakly (Eq. 31) through . The parameter could be dependent on St, because the sculpture rate of at may depends on St. Figure 10 shows the dependence on , assuming that the functional form of still holds. Because the sculpture rate may be lower for smaller values of St, we tested the cases of and 0.1, in addition to the nominal case of . The result is insensitive to for , while the sculpture rate is lower and accordingly the is relatively higher for . The detailed functional form of is left for future work.
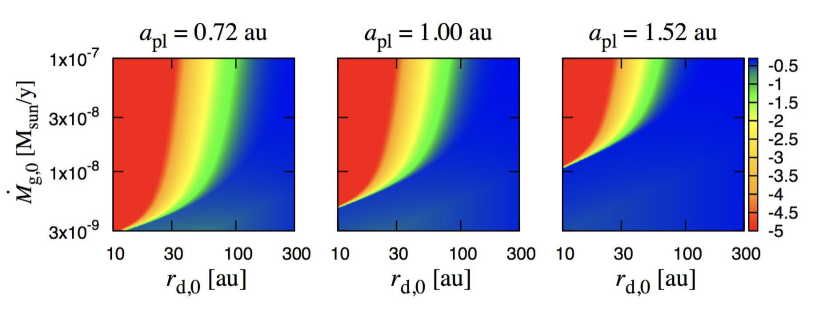
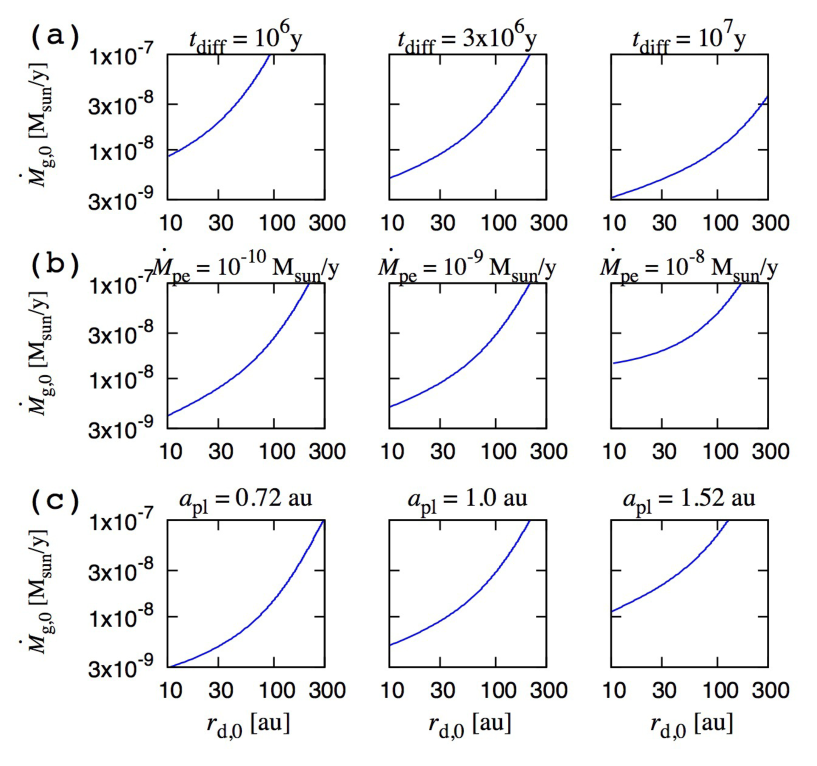
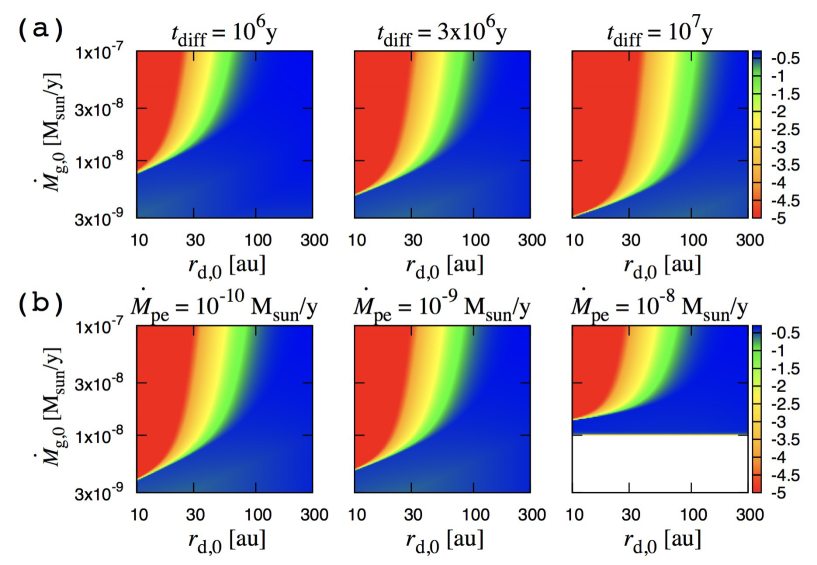
Figure 11 shows the dependence on the other disk parameters, and . For larger , the evolution of the snowline is slower and the snowline passage is later (Eq. 49). Before the passage, the icy dust disk has been more sculpted. As a result, is smaller (Eq. 51), because and . For smaller , the disk is hotter and the snowline passage is later ( is larger), resulting in smaller . If is smaller, is smaller. The water fraction corresponding to the current Earth is (the yellow and orange colored regions) are only slightly shifted to larger and lower for smaller and larger , because is smaller for these parameters (Eq. 51). Note that the parameter region with is empty in the right panel of Figure 11b, because the disks do not exist under that condition.
In Figure 12, the analytically estimated is plotted for and 1.52 au (the Venus, Earth, and Mars analogues, respectively). In the outer region, is generally larger due to early snowline passage (smaller ). In other words, is larger for larger . As mentioned in section 4, the Venus may have further lower , if we take into account the decrease in the pebble flux due to accretion by the Earth analogue. As shown in Eq. (7), the snowline cannot reach the region inside 0.53 au in our disk model, the planets there are completely dry. Although the dependence on the orbital radius exists, in the case of and , both for the Earth and Mars analogues.
In section 3, we pointed out that the simple condition of or discriminates between the water-rich case () and the water-poor case. The pebble formation timescale is given by Eq. (38) and the snowline passage time is given by Eq. (49). Both and are independent of and St, which is consistent with Figs. 9. The condition of is shown on the - plane in Fig. 13. We show the dependences on , , and . Comparison of this figure with Figures 11 and 12 show that the simple condition approximately reproduces the more detailed evaluation except for au. As shown in Fig. 1, for au, the disk radius expands with the pebble formation front radius , so that the sculpture of icy dust reservoir is delayed, compared to the estimation of at . The calculation of does not have this problem.
As we have shown, is the most sensitive to and and almost independent of the other parameters of disks and pebble accretion. It would be a robust result that the water fraction inferred for the present Earth and the ancient Mars, , is realized at and , which may correspond to median disk of classical T Tauri stars or slightly compact and massive disks.
6 Discussion
Here we comment on the effect of pebble isolation mass, which we did not include in our simulations. A planet with relatively large mass () can make a dip in the gas disk along the planetary orbit to prevent the pebbles from passing the orbit. The threshold mass is called ”pebble isolation mass” () (Lambrechts et al. 2014; Bitsch et al. 2018; Ataiee et al. 2018). When the planetary mass reaches the isolation mass, the pebble accretion onto the planet with and other planets inside the planetary orbit is truncated and the increases in their water fraction are stalled.
Bitsch et al. (2018) derived a detailed expression of the pebble isolation mass,
| (55) |
For example, for and au, and at 1 au. If , the effect of pebble isolation mass is not negligible. Figure 14 shows the water fraction for , and . We stop the pebble accretion when reaches . Because is smaller for smaller (Eq. 16) and is lower for smaller and higher (Eq. 3), is smaller for smaller and . The dry regime (the red-colored regime) in the left bottom part of the plots represent the cases of . Because is small in the low regions, rapidly increases due to a high pebble flux until increases to . Thereby, the edge in at is sharp. ion is avoided by the effect of pebble isolation even after the snowline passage.
For the same , , and as the above, . The filtering rate for is in 2D case (Eq. 31). If ice giants or cores of gas giants are formed, even before their mass exceeds , the pebble flux is reduced by by individual ice giants.
If Jupiter’s core is formed in the outer region, it shuts down the pebble mass flux into the terrestrial planet region. Morbidelli et al. (2016) proposed that the pebble flux truncation by the formation of Jupiter accounts for the dichotomy of our Solar system – the total solid mass contained in Jupiter, Saturn, Uranus and Neptune is about 50 times larger than the total mass of terrestrial planets. Jupiter’s core must be formed at . From Eq. (51) with and y, , which is for au. Hence, the Jupiter’s core formation time must be . While too fast type I migration of the core is a problem in that case (Matsumura et al. 2017), the dichotomy of our Solar system could be created. Our results show that rapidly increases jafter and becomes saturated before . If , for terrestrial planets. Otherwise, it is likely that is already close to the saturated value, because the increase of is very rapid. It is difficult for giant planet formation to directly produce modestly low values of water mass fraction () corresponding to the Earth and ancient Mars. The modestly low values are attained by disk parameters with as we showed.
We also point out that D/H ratio is expected to be radially uniform among the Earth, asteroids, and comets, if water is delivered by icy pebbles that formed in disk outer regions and drift all the way to the host star. However, observations show that in our Solar system, D/H ratios of Oort cloud comets are clearly higher than the Earth (e.g., Marty 2012). One possibility to reconcile the discrepancy is the shut-down of the pebble flux by Jupiter formation (Kruijer et al. 2017). Because pebble formation front migrates outward, the isotope ratios of drifting pebbles before and after Jupiter formation, which are respectively the building materials for terrestrial planets and those for comets, should be different. More careful comparison should be necessary between planet formation model and cosmo-chemical data.
7 Summary
If water is not delivered to rocky planets in habitable zones, the planets cannot be actual habitats, because H2O ice condenses in the disk regions well beyond the habitable zones. In the pebble accretion model, accretion of icy pebbles after the snowline passage may be a primary mechanism to deliver water to the rocky planets.
In this paper, we have investigated the water delivery to rocky planets by pebble accretion around solar-type stars, through 1D simulation of the growth of icy dust grains to pebbles and the pebble radial drift in an evolving disk. We assume that the planetary embryos did not migrate significantly and consist of pure rock, which means that accretion of ice starts when the snowline migrates inward and passes the planetary orbit due to disk evolution. Our previous paper, Sato et al. (2016), pointed out that the water fraction of the final planets are determined by the timings of the snowline passage through the planetary orbit () and disk gas depletion, because pebble accretion is fast and efficient. While Sato et al. (2016) used a simple static disk model, we here used the evolving disk model due to viscous diffusion based on the self-similar solution with constant viscous (Lynden-Bell & Pringle 1974) and simultaneously calculated pebble formation/drift/accretion and snowline migration with the disk model. Because the snowline migration is correlated with global disk diffusion in the evolving disk model, we found that for water fraction of the final planets (), the snowline passage time () relative to the time () at which pebble formation front reaches the disk outer edge is more important than that relative to the disk gas depletion timescale. Our simulation shows that the ice dust mass preserved in the disk outer region at () determines the water fraction of the final planets. The accreted ice mass to the planet is estimated by , where the filtering factor is the fraction of the pebble mass flux that is accreted onto the planet. Because rapidly decreases after , or is crucial for final value of . If , should have significantly decayed when icy pebble accretion starts at .
Using these numerical results, we derived an analytical formula for by icy pebble accretion. In the formula, is explicitly given as a function of the ratio and the disk parameters. The parameter is also determined by the disk parameters. As a result, is predicted by the disk parameters, especially the initial disk mass accretion rate and initial disk size . It is insensitive to the pebble accretion parameters such as the planet mass and Stokes number of drifting pebbles.
We found that the expected water fraction of an Earth analogue near 1 au has , which may correspond to the value of the current Earth, in the disks with initial disk size of 30-50 au and the initial disk mass accretion rate . For , both the Earth and a Mars analogues have , while is generally larger for Mars than for Earth. Because these disks may be median or slightly compact/massive disks among classical T Tauri stars, our results suggest that rocky planets in habitable zones in exoplanatery systems around solar-type stars often have the water fraction similar to the Earth, if the pebble accretion is responsible for the water delivery.
Acknowledgements.
We thank Michiel Lambrechts for detailed and helpful comments. This work was supported by JSPS KAKENHI 15H02065 and 16K17661 and by MEXT KAKENHI 18H05438.References
- Armitage et al. (2013) Armitage, P. J., Simon, J. B., & Martin, R. G. 2013, ApJ, 778, L14
- Ataiee et al. (2018) Ataiee, S., Baruteau, C., Alibert, Y., & Benz, W. 2018, A&A, 615, A110
- Bai et al. (2016) Bai, X.-N., Ye, J., Goodman, J., & Yuan, F. 2016, ApJ, 818, 152
- Bercovici & Karato (2003) Bercovici, D. & Karato, S.-i. 2003, Nature, 425, 39
- Birnstiel et al. (2012) Birnstiel, T., Klahr, H., & Ercolano, B. 2012, A&A, 539, A148
- Bitsch et al. (2018) Bitsch, B., Morbidelli, A., Johansen, A., et al. 2018, A&A, 612, A30
- Brauer et al. (2008) Brauer, F., Dullemond, C. P., & Henning, T. 2008, A&A, 480, 859
- Brown (1949) Brown, H. 1949, in The Atmospheres of the Earth and Planets, ed. G. P. Kuiper, 258
- Clifford et al. (2010) Clifford, S. M., Lasue, J., Heggy, E., et al. 2010, Journal of Geophysical Research (Planets), 115, E07001
- di Achille & Hynek (2010) di Achille, G. & Hynek, B. M. 2010, in Lunar and Planetary Science Conference, Vol. 41, Lunar and Planetary Science Conference, 2366
- Donahue et al. (1982) Donahue, T. M., Hoffman, J. H., Hodges, R. R., & Watson, A. J. 1982, Science, 216, 630
- Fei et al. (2017) Fei, H., Yamazaki, D., Sakurai, M., et al. 2017, Science Advances, 3, e1603024
- Garaud & Lin (2007) Garaud, P. & Lin, D. N. C. 2007, ApJ, 654, 606
- Genda & Abe (2005) Genda, H. & Abe, Y. 2005, Nature, 433, 842
- Greenwood et al. (2018) Greenwood, J. P., Karato, S.-i., Vander Kaaden, K. E., Pahlevan, K., & Usui, T. 2018, Space Sci. Rev., 214, 92
- Guillot et al. (2014) Guillot, T., Ida, S., & Ormel, C. W. 2014, A&A, 572, A72
- Gundlach & Blum (2015) Gundlach, B. & Blum, J. 2015, ApJ, 798, 34
- Haisch et al. (2001) Haisch, Jr., K. E., Lada, E. A., & Lada, C. J. 2001, ApJ, 553, L153
- Hartmann et al. (1998) Hartmann, L., Calvet, N., Gullbring, E., & D’Alessio, P. 1998, ApJ, 495, 385
- Hartmann et al. (2016) Hartmann, L., Herczeg, G., & Calvet, N. 2016, ARA&A, 54, 135
- Hasegawa et al. (2017) Hasegawa, Y., Okuzumi, S., Flock, M., & Turner, N. J. 2017, ApJ, 845, 31
- Hirose & Turner (2011) Hirose, S. & Turner, N. J. 2011, ApJ, 732, L30
- Hirschmann (2006) Hirschmann, M. M. 2006, Annual Review of Earth and Planetary Sciences, 34, 629
- Ida et al. (2016) Ida, S., Guillot, T., & Morbidelli, A. 2016, A&A, 591, A72
- Johansen et al. (2018) Johansen, A., Ida, S., & Brasser, R. 2018, arXiv e-prints [arXiv:1811.00523]
- Klahr et al. (2018) Klahr, H., Pfeil, T., & Schreiber, A. 2018, Instabilities and Flow Structures in Protoplanetary Disks: Setting the Stage for Planetesimal Formation, 138
- Kruijer et al. (2017) Kruijer, T. S., Burkhardt, C., Budde, G., & Kleine, T. 2017, Proceedings of the National Academy of Science, 114, 6712
- Kurokawa et al. (2014) Kurokawa, H., Sato, M., Ushioda, M., et al. 2014, Earth and Planetary Science Letters, 394, 179
- Lambrechts & Johansen (2012) Lambrechts, M. & Johansen, A. 2012, A&A, 544, A32
- Lambrechts & Johansen (2014) Lambrechts, M. & Johansen, A. 2014, A&A, 572, A107
- Lambrechts et al. (2014) Lambrechts, M., Johansen, A., & Morbidelli, A. 2014, A&A, 572, A35
- Lunine et al. (2003) Lunine, J. I., Chambers, J., Morbidelli, A., & Leshin, L. A. 2003, Icarus, 165, 1
- Lynden-Bell & Pringle (1974) Lynden-Bell, D. & Pringle, J. E. 1974, MNRAS, 168, 603
- Lyra & Umurhan (2018) Lyra, W. & Umurhan, O. 2018, arXiv e-prints [arXiv:1808.08681]
- Machida & Abe (2010) Machida, R. & Abe, Y. 2010, ApJ, 716, 1252
- Marty (2012) Marty, B. 2012, Earth and Planetary Science Letters, 313, 56
- Matsumura et al. (2016) Matsumura, S., Brasser, R., & Ida, S. 2016, ApJ, 818, 15
- Matsumura et al. (2017) Matsumura, S., Brasser, R., & Ida, S. 2017, A&A, 607, A67
- Min et al. (2011) Min, M., Dullemond, C. P., Kama, M., & Dominik, C. 2011, Icarus, 212, 416
- Morbidelli et al. (2016) Morbidelli, A., Bitsch, B., Crida, A., et al. 2016, Icarus, 267, 368
- Morbidelli et al. (2000) Morbidelli, A., Chambers, J., Lunine, J. I., et al. 2000, Meteoritics and Planetary Science, 35, 1309
- Musiolik et al. (2016) Musiolik, G., Teiser, J., Jankowski, T., & Wurm, G. 2016, ApJ, 818, 16
- Nomura et al. (2014) Nomura, R., Hirose, K., Uesugi, K., et al. 2014, Science, 343, 522
- O’Brien et al. (2014) O’Brien, D. P., Walsh, K. J., Morbidelli, A., Raymond, S. N., & Mandell, A. M. 2014, Icarus, 239, 74
- Oka et al. (2011) Oka, A., Nakamoto, T., & Ida, S. 2011, ApJ, 738, 141
- Okuzumi et al. (2012) Okuzumi, S., Tanaka, H., Kobayashi, H., & Wada, K. 2012, ApJ, 752, 106
- Ormel (2014) Ormel, C. W. 2014, ApJ, 789, L18
- Ormel & Klahr (2010) Ormel, C. W. & Klahr, H. H. 2010, A&A, 520, A43
- Ormel & Kobayashi (2012) Ormel, C. W. & Kobayashi, H. 2012, ApJ, 747, 115
- Raymond et al. (2004) Raymond, S. N., Quinn, T., & Lunine, J. I. 2004, Icarus, 168, 1
- Sato et al. (2016) Sato, T., Okuzumi, S., & Ida, S. 2016, A&A, 589, A15
- Shakura & Sunyaev (1973) Shakura, N. I. & Sunyaev, R. A. 1973, A&A, 24, 337
- Suzuki et al. (2016) Suzuki, T. K., Ogihara, M., Morbidelli, A., Crida, A., & Guillot, T. 2016, A&A, 596, A74
- Takeuchi & Lin (2005) Takeuchi, T. & Lin, D. N. C. 2005, ApJ, 623, 482
- Wada et al. (2009) Wada, K., Tanaka, H., Suyama, T., Kimura, H., & Yamamoto, T. 2009, ApJ, 702, 1490
- Williams & Cieza (2011) Williams, J. P. & Cieza, L. A. 2011, ARA&A, 49, 67
- Youdin & Lithwick (2007) Youdin, A. N. & Lithwick, Y. 2007, Icarus, 192, 588