First measurement of tW production cross-section at = 13 TeV with CMS
Priyanka∗111Work supported by the Department of Atomic Energy and the Department of Science and Technology, India, under collaboration with CMS-CERN., Kirti Ranjan1, Ashutosh Bhardwaj1
on behalf of CMS collaboration
1Centre for Detector and Related Software Technology,
Department of Physics and Astrophysics, University of Delhi, INDIA
The inclusive cross-section for tW production in proton-proton collisions at TeV is measured for an integrated luminosity of 35.9 fb-1 collected by the CMS experiment. The measurement is performed using events with one electron and one muon in the final state and at least one b-quark jet, and utilises kinematic differences between the signal and the dominating background using multivariant discriminants which is designed to disentangle the two processes. The measured cross-section of pb is observed to be in agreement with the Standard Model.
PRESENTED AT
International Workshop on Top Quark Physics
Bad Neuenahr, Germany, September 16–21, 2018
1 Introduction
The top quark was first discovered by the CDF the D0 collaborations in pair production mode, through strong interaction at the Tevatron in 1995 [1, 2], which is the dominant production mode. Top quark has been the heaviest elementary particle found till date in the standard model (SM) of particle physics. Its short lifetime makes it unique as it decays into a W boson and a b quark before hadronizing. Apart from the strong production it is also produced via electroweak production, also known as single-top quark production. This was obeserved in 2009 by the CDF and D0 collaborations at the Tevatron [3, 4]. Single-top quark allows probing of BSM and it also becomes a background to the precision physics and to many other SM processes. The production of single-top quark happens via three subprocesses: t-channel, the dominant one at the LHC; the s-channel, the least dominant at the LHC; and the associated production of top quark and W boson, also known as the tW-channel, which is the second most dominant process at the LHC.
However, there exists a major difficulty in the observation of tW subprocess as it interferes with the strong production of top quark pair production () at next-to-leading order (NLO). To deal with this difficulty at NLO, two methods are generally considered: diagram Removal (DR) and the diagram subtraction (DS), which removes the effect at the amplitude level and at the cross-section level respectively [5]. Evidence for the tW production was found at centre-of-mass energy () 7 TeV with of data at ATLAS experiment and its observation was found at 8 TeV with of data at CMS experiment.
2 Event Selection and Results
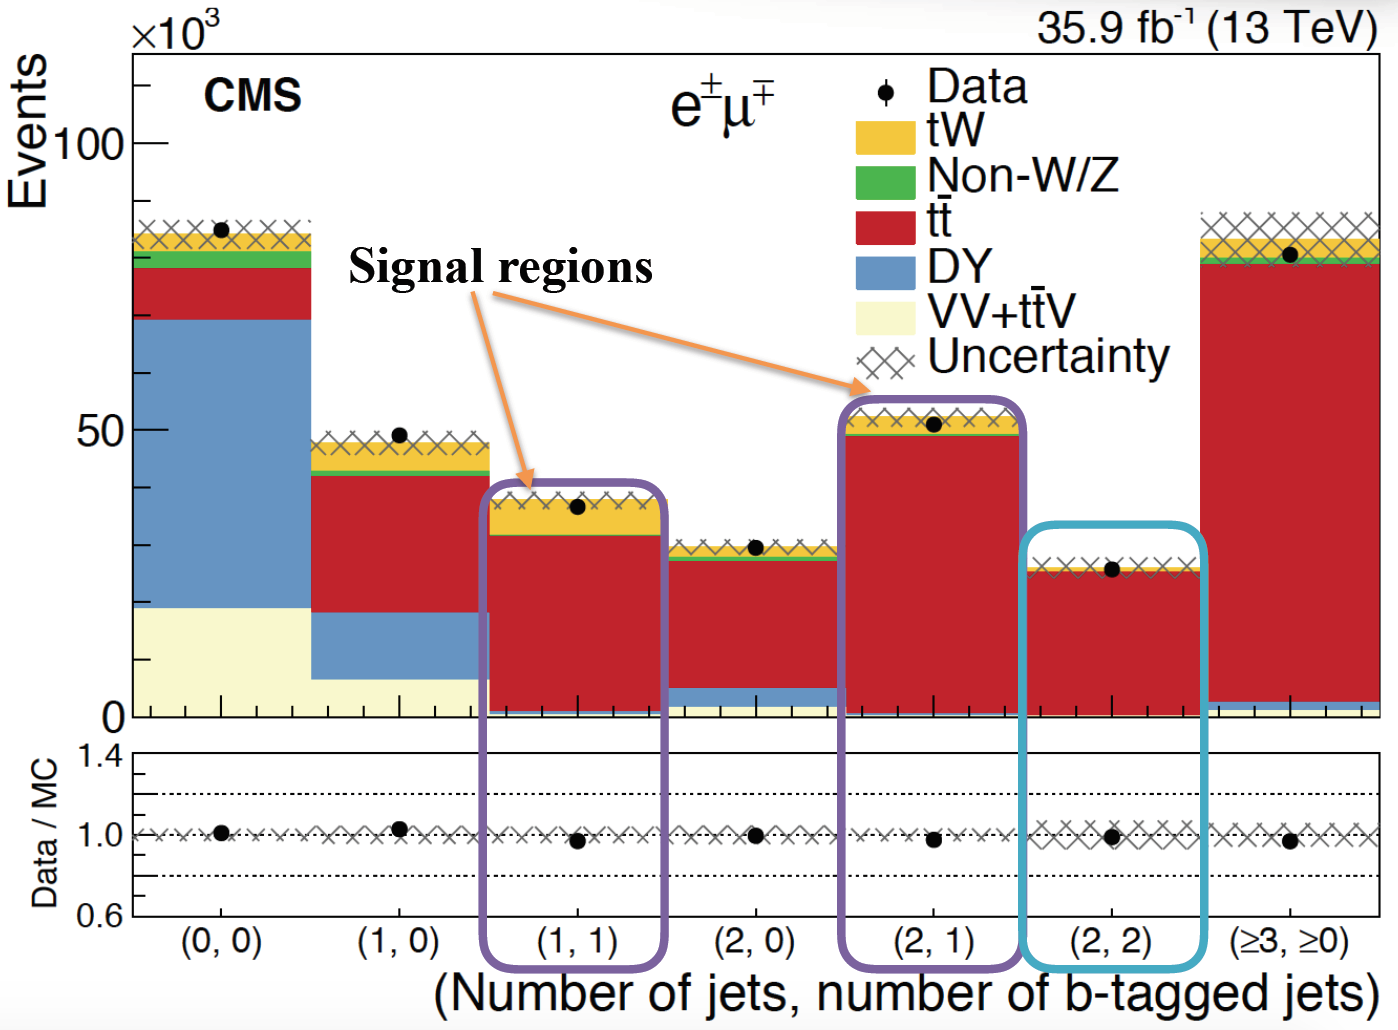
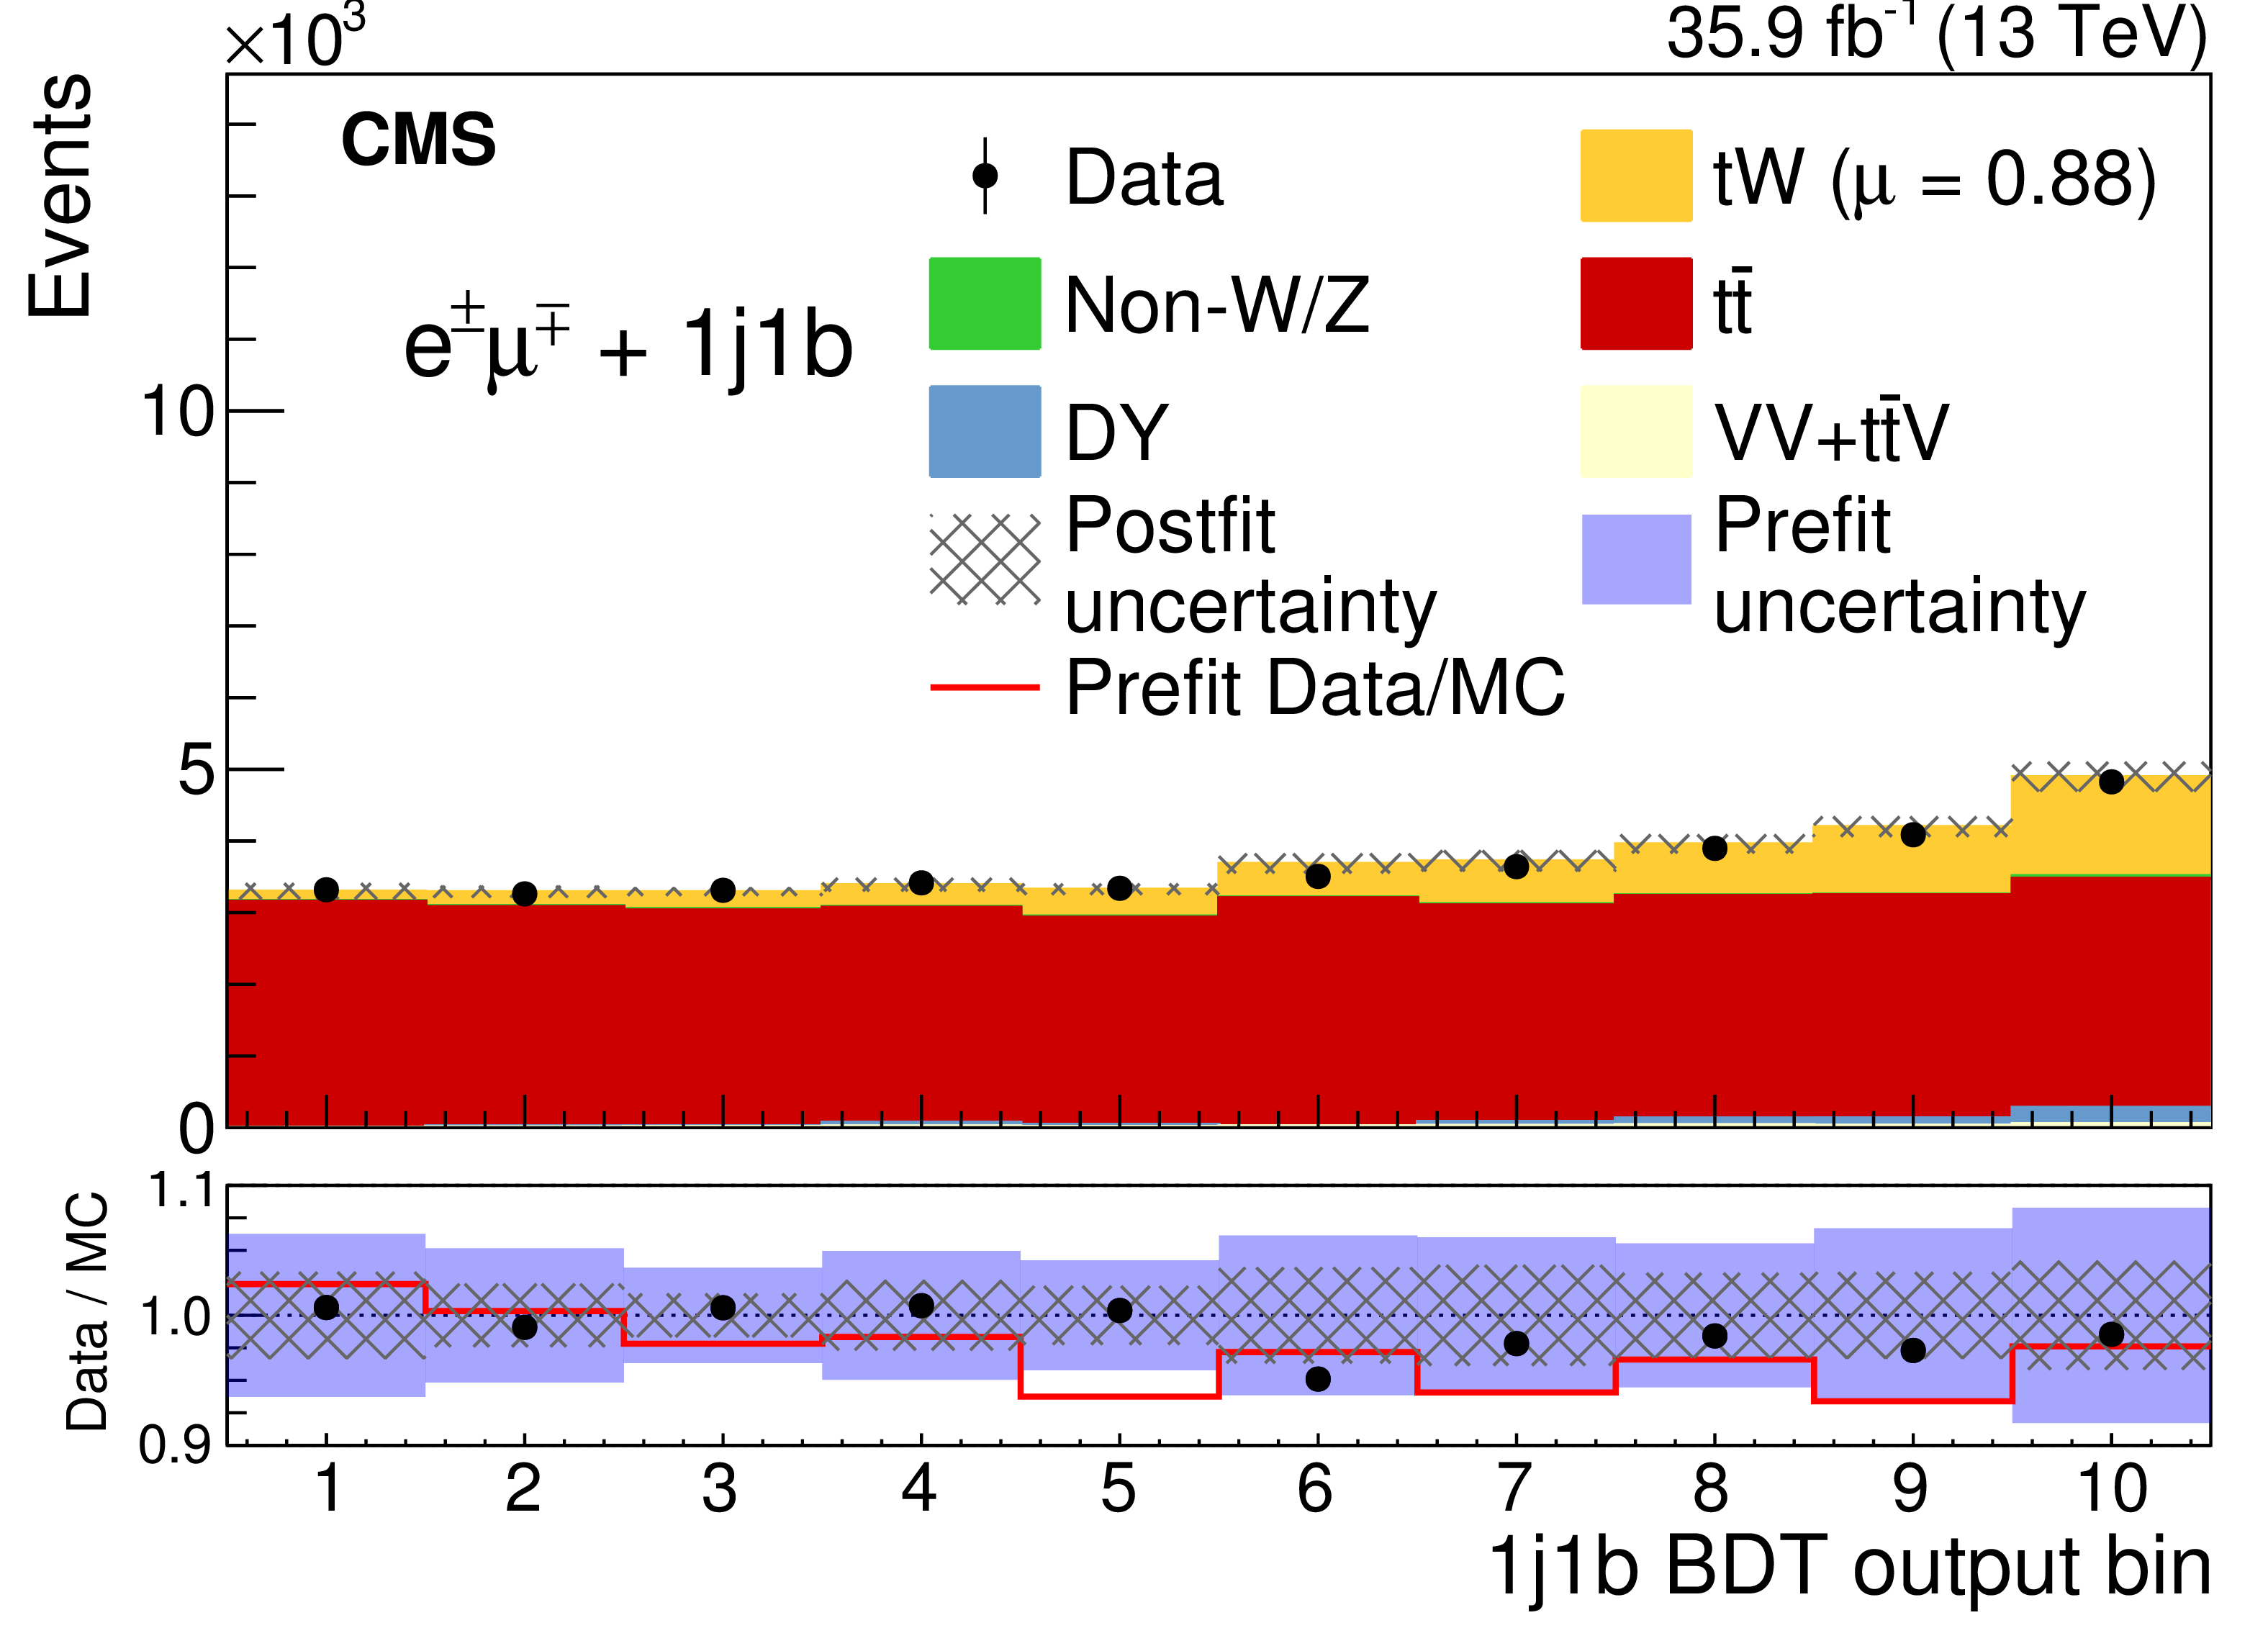
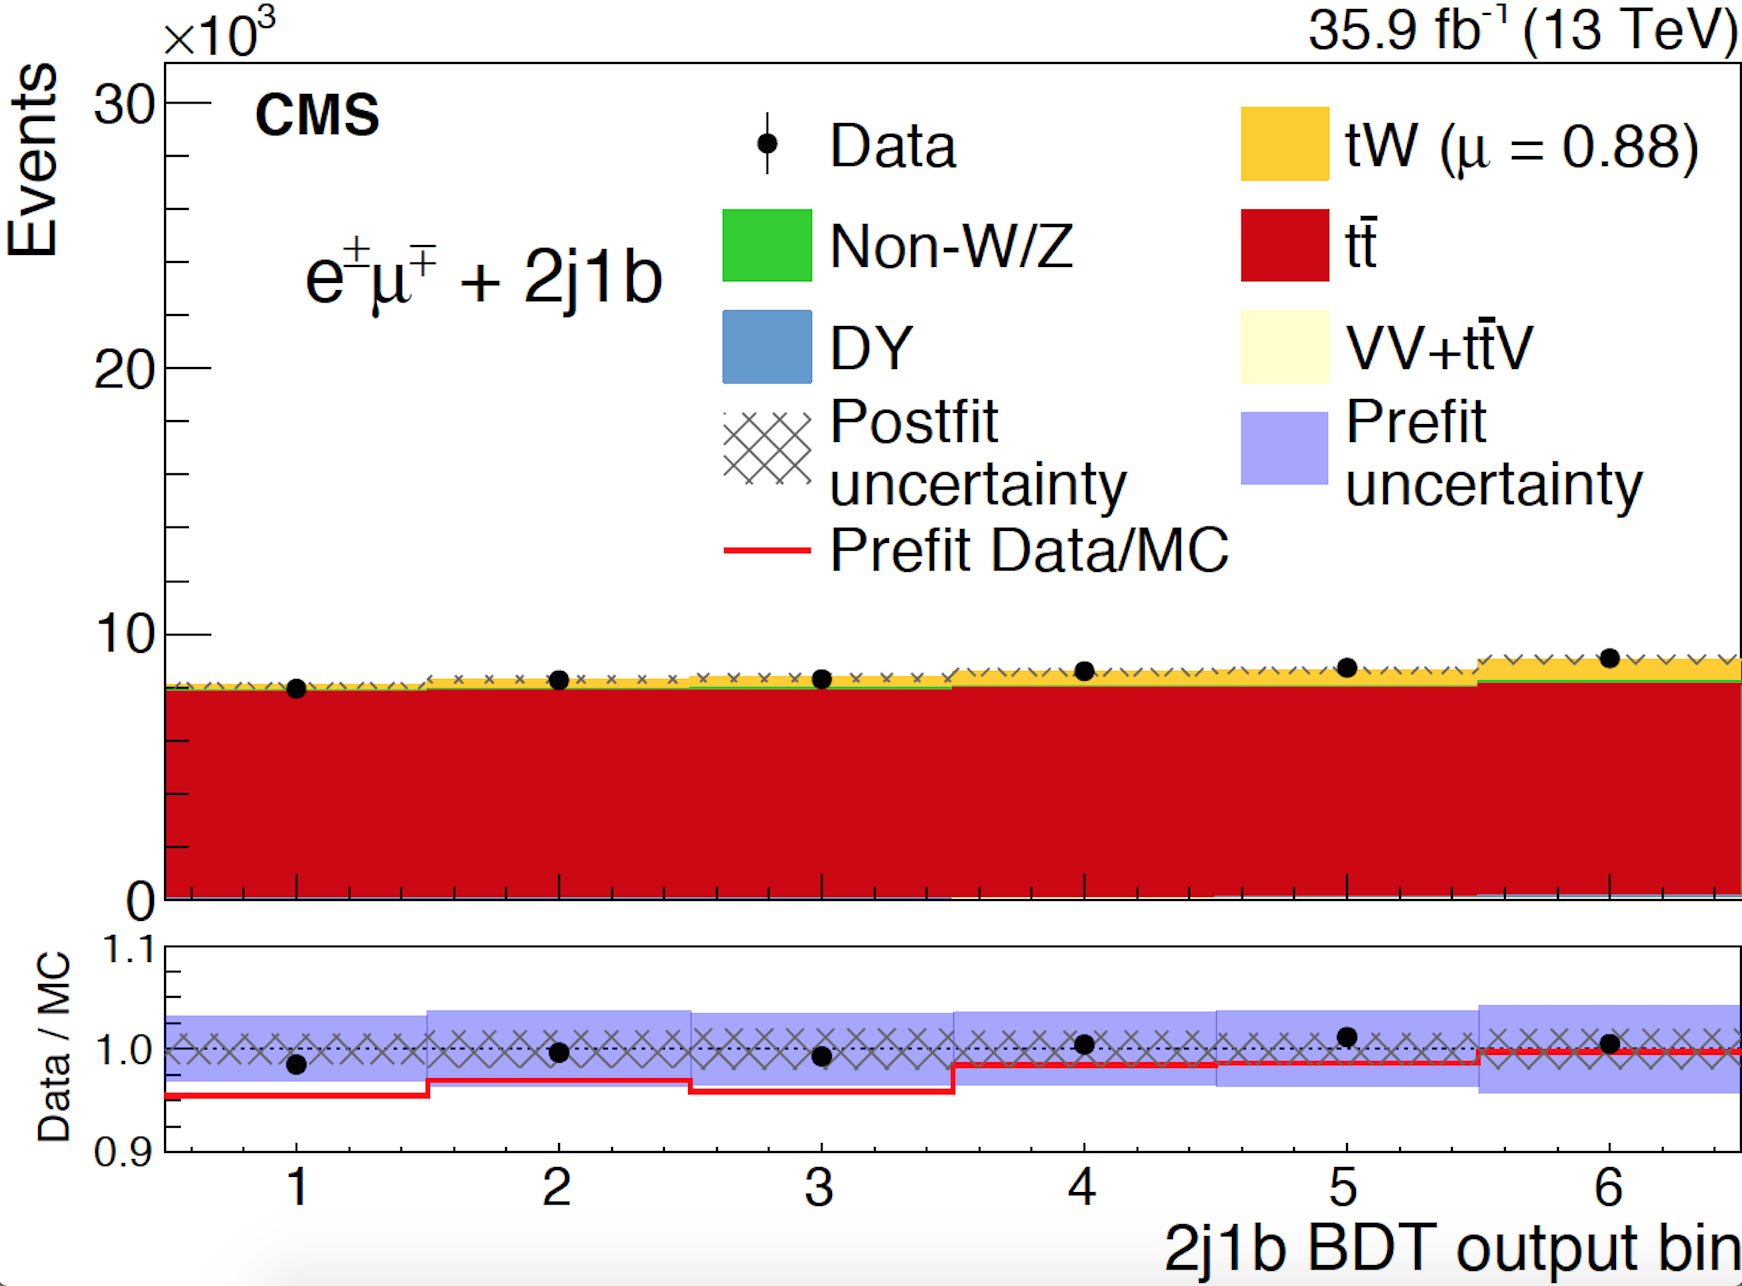
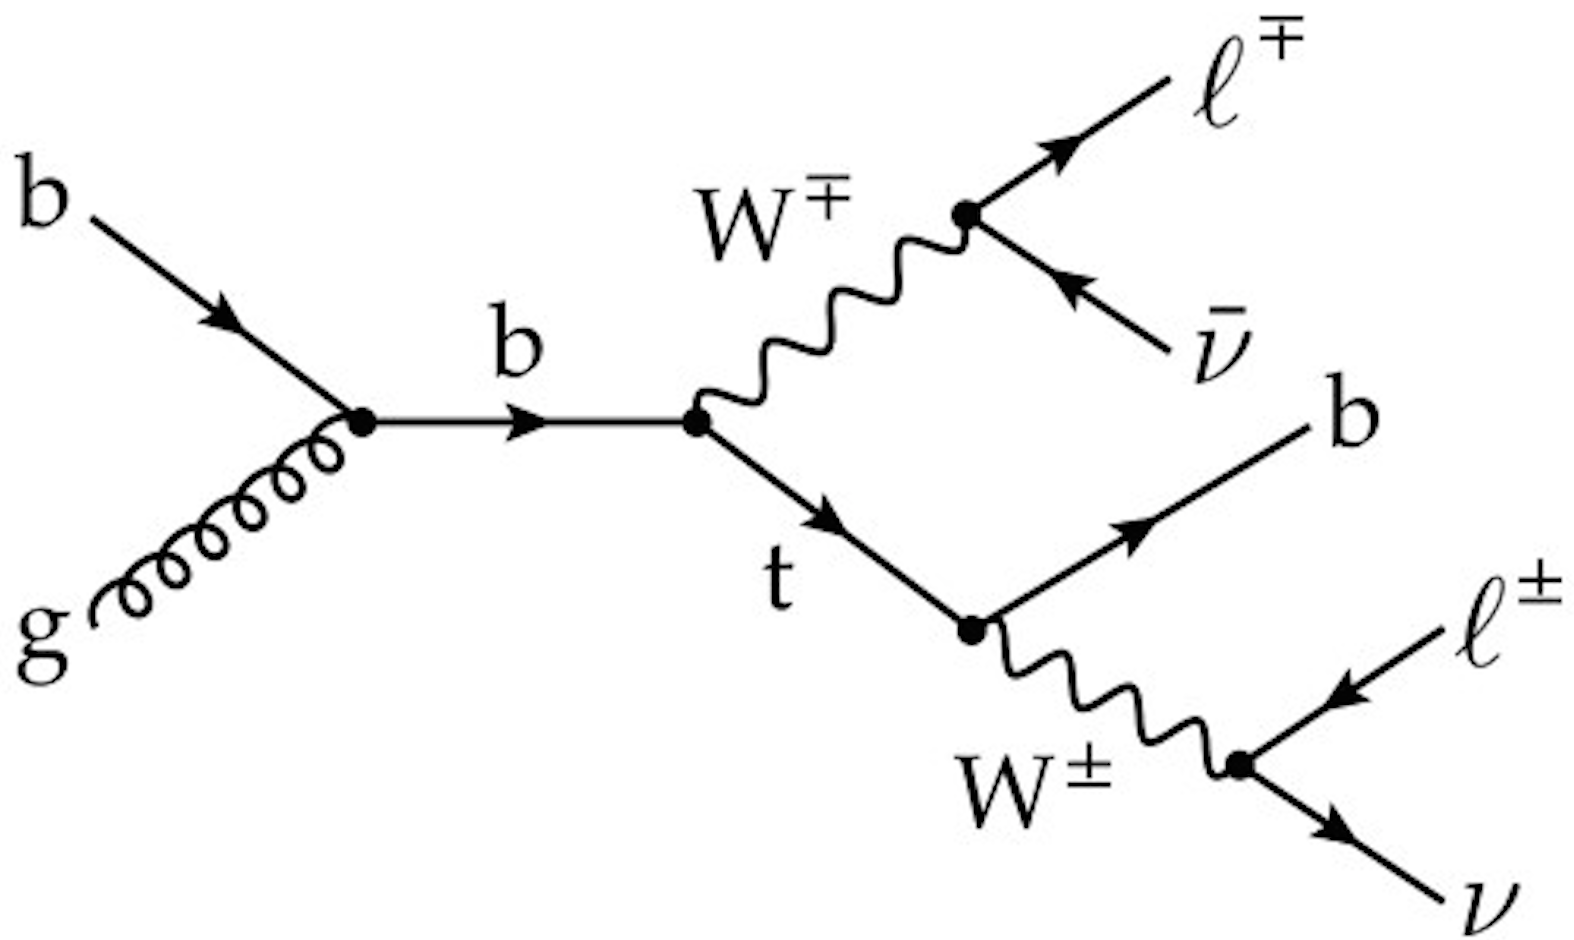
At CMS, the first measurement of the tW production cross-section was performed at of 13 TeV using the full 2016 data corresponding to an integrated luminosity of 35.9 [6]. The signature events of this analysis contains the events with 2 opposite sign leptons which can be electrons or muons, and 1 jet which originates from a bottom quark (Figure 1). However, we defined 3 regions for the signal extraction to increase the signal content which are 1 jet also tagged as b-jet (1j1t) and 2 jets with either 1 or both being tagged as b-jets (2j1t or 2j2t) as shown in the enclosed boxes in Figure 2. The main backgrounds to this channel come from which is the dominant one, , , , , and . Evaluation of the backgrounds that may contaminate the signal was performed on Drell-Yan and non-W backgrounds using data-driven technique. Simultaneous maximum likelihood fit to the Boosted Decision Tree (BDT) distributions in 1j1t and 2j1t regions and sub-leading jet distribution in 2j2t region was performed for the signal extraction. Figure 3 shows the 1j1t and 2j1t BDT distributions respectively. Systematic uncertainties are parametrized as nuisance parameters of the fit. Jet energy scaling, lepton identification and modeling contribute to the main systematic uncertainties. The cross section of the associated production of top quark with W boson is measured by the CMS as , achieving a relative uncertainty of 11, which is in agreement with the SM prediction of . At 13 TeV this is the first measurement of the process by the CMS Collaboration performed using BDT analysis. Measured cross-section is also in agreement with a similar measurement by ATLAS Collaboration.
3 Summary
CMS has performed the precision measurement of tW-channel using the p-p collision data at 13 TeV. Increased luminosity has befitted the measurement and the results are in agreement with SM.
References
- [1] T.M. Liss; P.L. Tipton (1997). “The Discovery of the Top Quark”. Scientific American: 54-59.
- [2] F. Abe et al. (CDF Collaboration) (1995). “Observation of Top Quark Production in pp Collisions with the Collider Detector at Fermilab”. Physical Review Letters. 74 (14): 2626-2631
- [3] T. Aaltonen et al. (CDF Collaboration) (2009). “First Observation of Electroweak Single Top Quark Production”. Physical Review Letters. 103 (9): 092002. arXiv:0903.0885
- [4] V.M. Abazov et al. (D0 Collaboration) (2009). “Observation of Single Top Quark Production”. Physical Review Letters. 103 (9): 092001. arXiv:0903.0850
- [5] Frixione, Stefano; Laenen, Eric; Motylinski, Patrick; White, Chris; Webber, Bryan R., “Single-top hadroproduction in association with a W boson”, Journal of High Energy Physics, Issue 07, article id. 029 (2008)
- [6] The CMS Collaboration, “Measurement of the production cross section for single top quarks in association with W bosons in proton-proton collisions at ”, JHEP10(2018)117