Analysis of the Frequency and Detectability of Objects Resembling Nuclear/Radiological Threats in Commercial Cargo
Abstract
The threat of smuggled nuclear/radiological weapons and material in commercial containerized cargo remains a significant threat to global security more than a decade after the enactment of laws in the United States and elsewhere mandating interdiction efforts. While significant progress has been made towards deploying passive radiation detection systems in maritime ports, such systems are incapable of detecting shielded threats or even certain scenarios in which material is unshielded. Research efforts towards developing systems for detecting such threats have typically focused on the development of systems that are highly-specific to nuclear/radiological threats and no such systems have been widely deployed. While most existing commercially-available cargo radiography systems are not specifically designed for this interdiction task, if items resembling nuclear/radiological threats are sufficiently rare in cargo radiographs to limit false alarms to an acceptably low frequency, then a smuggling interdiction scheme based on existing technology may be feasible. This analysis characterizes the relevant nuclear and radiological threats that may evade detection by passive monitors, and utilizes a dataset of 122,500 stream-of-commerce cargo container images from a 6 MeV endpoint gamma radiography system to determine the frequency at which objects of similar size and density to such threats occur in containers. It is found that for a broad class of threats, including assembled fission devices, gamma radiography is sufficient to flag threats in this cargo stream at false positive rates of 2%.
The detection of smuggled nuclear and radiological materials and weapons in maritime cargo containers remains an unsolved problem, despite focused research and political discussion on the issue that intensified significantly after the September 11, 2001 terrorist attacks and continues today. While cargo containers are not the only method that a terrorist could use to deliver the weapons or materials necessary for an attack, smuggling via maritime cargo is considered particularly threatening due to the fact that most containers are loaded overseas and the combination of the large size of cargo containers with the high volume of cargo traffic (5 containers/day in the US alone) provide an ideal environment for concealing contraband Aloise and Caldwell (2010); Kouzes et al. (2011).
Estimates of the immediate economic costs alone of a nuclear explosion in a major United States port exceed $1 trillion Meade and Molander (2006); Abt (2003), while even a much smaller-scale attack involving a radiological dispersal device (RDD, or “dirty bomb”) could incur costs of up to tens of billions of dollars if trade is significantly disrupted Rosoff and Von Winterfeldt (2007). For these reasons, the United States government continues to pursue programs with the stated goal of inspecting 100% of US-bound cargo containers for the presence of nuclear weapons, or the special nuclear materials (SNM) required to make a nuclear weapon, prior to embarkation of the containers at foreign ports as mandated by the 9/11 Commission Act in 2007 911 (2007). Progress towards achieving this goal, however, has been hampered by the challenges of implementing systems in foreign ports with limited cooperation and financial support from local governments United States Government Accountability Office (2012, 2013); Caldwell (2014), a lack of clear and effective goals for development of technological solutions Aloise (2009, 2007a); Caldwell (2014, 2012); Aloise and Caldwell (2010); Aloise (2007b), and reluctance from shippers and port operators to implement inspection regimes that delay shipments or incur additional shipping costs American Association of Port Authorities (2011, 2016); World Shipping Council (2002).
A number of techniques have been proposed for the detection of smuggled nuclear materials and weapons, although only two main classes of systems have been widely deployed: passive radiation detectors and gamma/x-radiography scanners. Passive detectors, while capable of detecting a variety of threatening radioactive materials, may be defeated by surrounding the smuggled object with enough material (“shielding”) to absorb the radiation before it leaves the container. Radiography of containers, which is capable of producing high resolution images of containers for both manual and automated inspection, has been widely deployed for a variety of security applications Chen (2005). Generally, however, radiography alone has been considered insufficient for the detection of nuclear and radiological threats due to a lack of specific signatures for such threats, even in dual-energy systems that provide limited material-type identification Bendahan (2017). This has led to considerable research efforts to develop systems that can produce specific signatures for SNM. Concepts for such systems have included the detection of prompt neutrons from photofission Danagoulian et al. (2010), nuclear resonance fluorescence Bertozzi and Ledoux (2005), and a variety of others Runkle et al. (2012). Due to the novelty, complexity, and cost of these systems none have been deployed widely.
Given the difficulty and costs of developing and deploying highly-specific nuclear/radiological threat detection systems, it is worthwhile to examine the capabilities of the existing commercial systems (i.e., passive radiation detectors and gamma radiography systems) to determine the extent of their capabilities so as to prioritize future effort and spending in this area. Specifically, given that passive radiation scanning is capable of detecting many classes of unshielded nuclear/radiological threats Kouzes et al. (2011, 2008) and that the materials required to shield an object from detection will be apparent in a radiograph Katz et al. (2007); Gaukler et al. (2012, 2011); Pincus et al. (2011), the question arises as to whether objects in cargo resembling threats (according to their signatures in these systems) are sufficiently rare so as to permit an interdiction system relying primarily on these existing technologies. To address this question, this analysis characterizes the relevant nuclear and radiological smuggling threats and examines data from radiographic images of 122,500 stream-of-commerce cargo containers to determine the frequency of objects in the cargo which appear consistent with nuclear/radiological threats. To this end, the radiography system was modeled so as to allow prediction of the radiographic appearance of typical nuclear/radiological threats in terms of their effective size and density and the entire image set was analyzed to determine the frequency of such objects. Assuming that the cargo stream contained none of the objects under consideration, this frequency amounts to the false alarm rate of an interdiction system using the methods of this analysis. It was found that, in this container stream, radiography is capable of distinguishing a large class of relevant threats with a false positive rate of 2%.
Classifying Relevant Nuclear and Radiological Threats
This analysis utilizes the fact that nuclear materials are typically characterized by two key characteristics: high density (18 g/cm3) and high atomic numbers (, ). Similarly, due to the necessarily high level of radioactivity of an effective RDD, any RDD that successfully evades passive detection will likely require significant amounts of dense, high- shielding or a combination of low- and high- shielding to capture neutron radiation Kouzes et al. (2011, 2008). While an ideal system would detect even trace amounts of material present in a container, the large size of containers and high-volume of cargo traffic would likely make such a system prohibitively costly and disruptive to trade. Thus, it is necessary to set reasonable detection goals and to properly assess the capabilities of existing and proposed systems of reaching these goals by comparison to data from actual stream-of-commerce containers. The two main classes of threats and their passive detectability are discussed here to establish criteria for the analysis of the image set.
Nuclear Devices and Special Nuclear Materials
The detection of an assembled, detonable nuclear warhead in a cargo container is clearly a minimum requirement of any interdiction system, but detection of smuggling of highly enriched uranium (HEU), weapons-grade plutonium (WGPu), or other SNM intended for incorporation into weapons is also highly desirable. While it is generally considered that significant samples of WGPu are detectable by passive radiation monitors due to their strong fission neutron signature (or otherwise would be surrounded by very significant shielding), HEU produces very little passive radiation that would be likely to reach detectors Fetter et al. (1990); Kouzes et al. (2011, 2008); Dalal and Han (2010); American National Standards Institute (2016). Thus, it is important to consider how the assembled “physics packages” of weapons would appear in a radiograph (since these represent the minimum assembly required for nuclear detonation) as well as smaller samples of SNM alone (especially in the case of HEU). Due to the nature of SNM, these samples are still most likely to appear as anomalous dense regions in radiographs. Previous efforts have used 100 cm3 (2 kg) as a detection goal Pincus et al. (2011), which will used as a lower-bound test case in this analysis. Ultimately, the lower thresholds for SNM detection should be informed by knowledge of the processes used to construct weapons, information regarding smuggling incidents Cotton et al. (2018), and information from datasets such as the one considered in this work.
Radiological Dispersion Devices and Radioactive Sources
Regarding the detection of a radiological dispersion device (or a radioactive sample that could be used in such a weapon), it is assumed in this work that currently deployed radiation portal monitors are at least as functional as the specified standards American National Standards Institute (2016). Under this assumption, any attempt to smuggle a quantity of radioactive material that poses and significant threat and is unlikely to be detected by passive monitors would require shielding. Since a strong radioactive source may be quite small111For instance, the possible RDD isotope cobalt-60 has a specific activity of 44 TBq/gram (1100 Ci/g)., shielding scenarios on the scale of centimeters must be considered, although a dispersal weapon such as a dirty bomb would likely be considerably larger and thus require commensurately more shielding. Thus, in this analysis of radiography data, searches for RDDs are considered as searches for the shielding that would be required to hide them from passive detection.
Occurrence of Threat-Resembling Objects in Radiographic Images of a Commercial Cargo Stream
Given the capabilities of passive radiation detection systems already in widespread use at ports, the problem of detecting nuclear and radiological threats reduces to detecting objects with sufficiently low radioactivity to be evade detection in feasible passive scanning scenarios. Such a sample may have naturally low passive radioactivity (such as HEU) or be encased in shielding to mask the signal. As noted in the previous section, a smuggler seeking to conceal a highly radioactive () object using shielding must use significant amounts of material that will appear as large, dense regions in radiographic images. For threats in involving SNM, while the materials typically emit less radiation than RDD isotopes and thus may require less shielding to avoid passive detection, a substantial quantity of SNM will also appear as a dense region in a radiograph. Since radiographic systems fundamentally measure the attenuation of a beam due to the material in a container as a 2D function of position, they are naturally suited for identifying objects by these parameters.
While utilizing radiography to search for dense objects has been proposed previously as a mechanism for searching for nuclear and radiological threats in cargo Katz et al. (2007); Gaukler et al. (2012, 2011); Pincus et al. (2011), such a technique is feasible only if objects of the relevant densities and sizes are sufficiently rare in radiographs so as to not produce a large number of false alarms. To avoid disruption of the flow of containers in ports, cargo security schemes have typically sought to flag 3% of containers as containing items consistent with threats Pincus et al. (2011); World Shipping Council (2002). Additional inspection and/or intelligence information may provide more leeway, but likely at most a few percent of containers can feasibly be flagged for further inspection. Previous data have provided information regarding the mean density of entire cargo containers Descalle et al. (2006); Birrer et al. (2016), but such studies underestimate the occurrence of dense cargoes (due to the averaging of dense regions with empty regions) and provide no information regarding the frequency of contiguous dense regions that resemble threats. This analysis characterizes the expected appearance of threatening nuclear/radiological objects in radiographs and examines a large set of high-resolution radiographic images from a 6 MeV endpoint bremsstrahlung imaging system to identify the frequency of such objects. If such objects are sufficiently rare, then, in conjunction with passive scanning to detect unshielded threats, radiography is likely sufficient for identifying important classes of nuclear/radiological threats.
Image Dataset
The analysis was conducted on a set of 122,500 radiographs of intermodal cargo containers, approximately evenly split between 20 foot and 40 foot containers, produced by a Rapiscan Eagle R60® scanner Rapiscan Systems (2010); Stevenson et al. (2011) examining rail car-borne containers entering a European port. The container stream represented a diverse array of cargo, and approximately 20% of the containers were empty Rogers (2017). Each image consisted of a two-dimensional array of 16-bit pixels representing the integrated energy transmission (measured by CdWO4 detectors) of a 6 MeV endpoint bremsstrahlung beam through the cargo relative to the open beam222The dataset also included 4 MeV endpoint images for each container, which were also analyzed but are not discussed in this work due to the lesser penetration of the lower energy beam.. Each pixel represented an approximately mm region on the mid-plane of the container transverse to the beam333Due to the “fan” shape of the beam created by the vertical collimation of the gamma rays, objects on the near side of the container to the source will appear larger in the vertical direction than objects closer to the detectors. For this analysis, it is assumed that any threatening objects are near the center of the container since a smuggler would not have knowledge of the orientation in which a container is inspected and since this placement is most advantageous for shielding the object from passive detection..
This image set was previously analyzed in the context of using machine learning techniques to identify complex objects such as vehicles in cargo images Rogers (2017); Jaccard et al. (2014, 2015). The analysis was conducted on images preprocessed according to the methods discussed in Section 7.2.2 of Reference Rogers (2017), which trimmed the images to remove blank space around the containers and corrected for known system artifacts in the images. Additionally, for this analysis the images were further trimmed to remove any portion of the rail car present in the image. Any images with resulting sizes inconsistent with the expected container sizes or otherwise anomalous data were excluded from the analysis. These images constituted 3.1% of the available images, and are not counted in the 122,500 total.
Analysis
The analysis sought to test the hypothesis that radiological and nuclear threats may be detected in radiographic images of cargo containers by identifying them by their anomalous size and density relative to common cargo. To accomplish this, the radiographic system was modeled so as to allow the simulation of images of threatening objects and to characterize their appearance in images. The cargo images were analyzed for the presence of contiguous dense regions and the frequency of regions matching the parameters of the simulated threats was examined. If the occurrence of threat-like objects in the cargo stream is sufficiently small (), then radiography provides a stronger tool for detecting nuclear/radiological threats than previously has been appreciated. Additionally, a number of other results regarding the distribution and density of materials in containers follow from the analysis, which provide useful data for various studies in cargo threat detection.
Radiographic System Model
Due to the high intensity of photons in a bremsstrahlung radiography system, the detectors are operated in charge summing mode (in which the signal is roughly proportional to the total energy deposited in a detector over an integration time window), rather than counting mode (in which individual photons and their deposited energies are detected). The fundamental quantity measured by the system for a given material in the beam is the transmission ratio (scaled to the 16-bit dynamic range of the detectors for the Eagle R60® system)
| (1) |
where is the charge sum for a fixed period with the material in the beam and is the sum for an equivalent period with no intervening material. In practice, radiographic systems like the one described in this study have dynamic calibration mechanisms to account for variations in the beam and detectors to ensure proper normalization between and Rapiscan Systems (2010); Stevenson et al. (2011); Chen (2005). The detected charge sum may be modeled as
| (2) |
where is a proportionality constant, is a vector representing a histogram of the bremsstrahlung beam spectrum as a function of photon energy (with bin energies ), is the matrix representing the effect of the material on the transmitted beam (such that is the transmitted spectrum histogram), is the detector response matrix (such that would be the detected spectrum histogram if the detector could be operated in photon counting mode), and is a noise term that in general depends on . Models for each of these quantities for the system and a full range of materials were developed using simulations based on the Geant4 framework Agostinelli et al. (2003) and photon cross section data Berger et al. (2010), the details of which are described in Section A1. Since this analysis examines only average behavior over many pixels, the noise term (which may arise from counting statistics, electronics noise, etc.) is treated as a net effect on the reconstructed value of as described in Section A1.6.
Rather than work with the transmission ratio , it is customary in radiography to compare cargoes of different materials to the equivalent thickness of steel that would result in the same value of . Using the previously mentioned models, a look-up table was created for each elemental material to map amounts of a given material to centimeters of steel at equivalent . This is described in more detail in Section A1.5. This conversion was used to compute the effective object sizes in Table 1 and is utilized for all further discussions of imaged cargo. For a more detailed discussion of cargo radiography, see Reference Chen (2005).
Dense Object Finding
To measure the occurrence of dense objects in cargo and their sizes, each image was analyzed for contiguous regions exceeding given thresholds of steel equivalent thickness ranging from 11 to 30 cm-steel equivalent. For each image and thickness threshold, the image was converted to a binary image of above/below threshold and the MATLAB® Image Processing Toolbox was used to identify all distinct 4-connected regions in the image above the threshold Sedgewick (1998); MathWorks (2018). The image toolbox was used to determine several parameters for each region including the total number of pixels in the region, the geometric centroid, and the bounding box (smallest rectangle aligned to the image axes that contains the region). Each distinct 4-connected region was characterized by two parameters for comparison to the expected sizes of threat-like objects: and . The effective radius was defined to be the radius of the largest circle centered at the centroid contained within the bounding box (scaled to the effective pixel size along the transverse mid-plane of the container). The effective area was defined to be the total number of pixels above threshold in the region times the approximate cross sectional area of a single pixel (0.25 cm2). The parameter works well for characterizing compact objects, like a small mass of SNM, while better represents the material composition of elongated objects. Note that under this definition, the image of an annular object will result in a value of comparable to the outer radius of the object but with a smaller than a filled-in circular image of the same radius.
The results of this analysis for a 20 foot container of palletized cargo at two different thresholds are shown in Figure 1 as an example representative of a cargo type that contains significant dense regions. Additionally, the figure includes an additional image in which a simulated fission device is inserted into the image and identified by the algorithm as a large dense region. In the figure, the magenta circles represent the circle defining and the red crosses mark the centroid and total extent of each region.
Characteristic Test Objects
For concreteness in the following discussion, it is useful to define several specific examples of potential smuggled objects. Since a spherical object minimizes the effective radiographed area from an arbitrary angle of a given amount of material, the example objects considered here are each spherically symmetric. While a smuggler could, in principle, machine material and pack a container so as to make an object thinner along the beam direction and thus appear less dense, this would be difficult or impossible in many scenarios. For an example, the geometry of an assembled weapon is fixed and changing the configuration of smuggled materials would increase the amount of shielding required to mask any passive radiation (making the object appear larger in the radiograph).
The considered objects, summarized in Table 1, were chosen so as to broadly represent three classes of objects: bare masses of SNM, assembled fission packages, and Pb shields that could be used to mask a small sample of an RDD isotope or HEU. In the first category, near-critical masses of WGPu and HEU as well as a 100 cm3 mass of material were considered as scenarios in which material is shipped for incorporation into a weapon after delivery. The critical masses represent the scenario in which enough material is shipped at once (in theory) to create a weapon, while the 100 cm3 represents a smaller sample that has been the detection goal of past development efforts Pincus et al. (2011). The second category models the fission packages of the nuclear weapon models described in Fetter, et al. Fetter et al. (1990) as prototypical representations of HEU and WGPu weapons. Note that these devices represent only the essential components of a fission device (i.e., SNM, tamper, neutron reflector, and chemical explosives) and thus a real assembled device would likely have additional components that would increase the apparent size of the object in a radiograph. The third category examines shielding scenarios that could mask small samples of either RDD isotopes or uranium up to a few inches of Pb encasing a sphere of radius 8.5 cm (so as to fit the HEU critical sphere). Note that any scenarios involving more shielding or shielding of larger objects would be necessarily easier to detect via these criteria.
Applying the radiographic system model, the transmission of the beam through each of the test objects was simulated so as to produce simulated radiographic images of each object. As described in Section A2, the simulated images were produced with the same pixel size as the data (assuming placement in the middle of the container). A conservative estimate of the pixel-to-pixel steel equivalent thickness reconstruction uncertainty as well as a model of the systematic reconstruction variation due to photon source fluctuations were applied to the simulated images so as to match the characteristics of the data images. The same dense object finding routine used for the container images, described in the previous section, was then applied to each test object image to determine the expected and of each object at practical thresholds chosen for each object. Each of these objects was simulated and analyzed under the assumption that no additional material was present in the simulated radiographs, and thus the quoted sizes Table 1 are minimum estimates since the walls of the container and any other cargo present would increase the apparent size of the dense region associated with the test object in a radiograph.
| Object | Outer Radius | Threshold | ||
| (cm) | (cm-steel) | (cm) | (cm2) | |
| 100 cm3 SNM | 2.9 | 15.6 | 1.5 | 4 |
| WGPu | 4.5 | 21.2 | 2.1 | 10 |
| HEU | 8.5 | 25.6 | 7.5 | 166 |
| WGPu Package | 21.0 | 25.6 | 9.6 | 272 |
| HEU Package | 23.0 | 25.6 | 11.7 | 413 |
| 3 cm Pb shell | 11.5 | 21.2 | 9.8 | 69 |
| 6 cm Pb shell | 14.5 | 25.6 | 12.6 | 321 |
| 9 cm Pb shell | 17.5 | 25.6 | 16.0 | 765 |
| HEU + 3 cm Pb | 11.5 | 25.6 | 8.9 | 235 |
Key Results
A number of interesting results regarding the detection of nuclear and radiological threats in commercial cargo arise from this analysis. Several key distributions from the image set are presented here for discussion in the next section, while Section A4 presents further results that may be of interest to readers seeking more information regarding the material distribution inside cargo containers. For the purpose of this discussion, it is assumed that no objects that would be classified as nuclear/radiological threats were present in the analyzed images, and thus any object resembling a threat constitutes a false positive.
Figure 2 shows the distribution of the effective areal density by pixel of all containers in the image set, separated by 20 and 40 foot containers, along with the corresponding cumulative distributions. These distributions provide significantly greater detail than previously presented cargo density distributions (such as Figure 6 of Reference Descalle et al. (2006)), which only provided average information over entire containers and thus significantly underestimated the occurrence of high areal density regions in containers that are relevant to identifying nuclear and radiological threats. Notably, a very small fraction of pixels () exceed the quoted penetration depth of the scanner (30 cm-steel equivalent), and thus there are very few contiguous regions of dense material that appear similar to the test objects. Additionally, 40 foot containers exhibit many fewer dense pixels than 20 foot containers, which follows naturally from the fact that 40 foot containers have twice the volume of 20 foot units but only 10% higher payload capacity by weight im (1996).
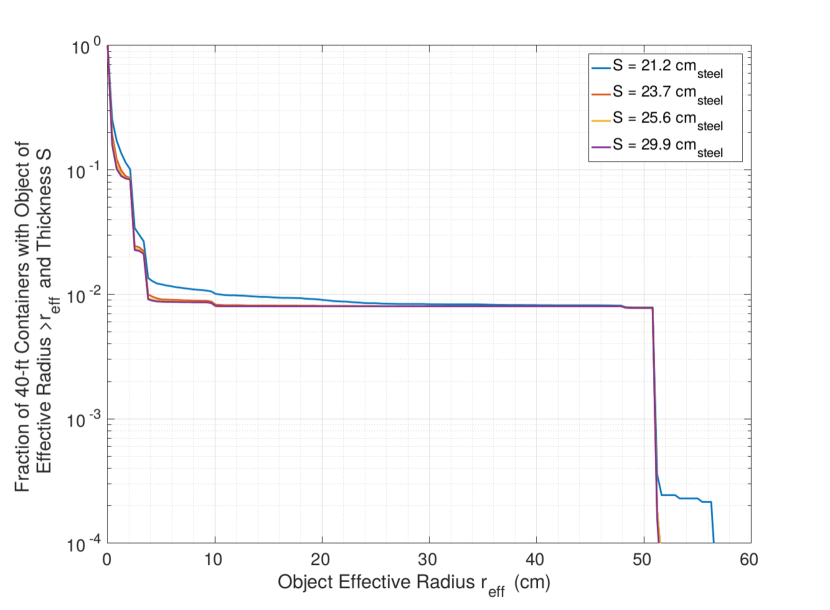
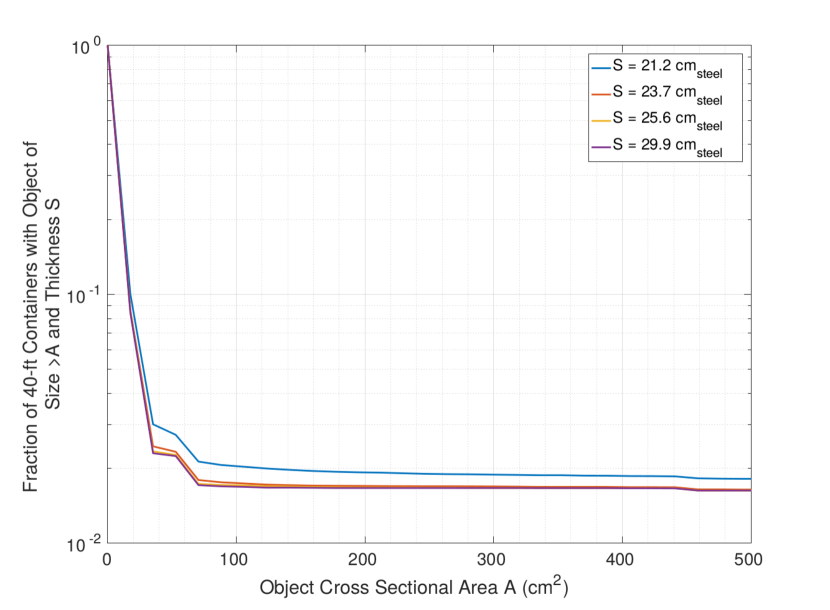
To quantify the fraction of containers that exhibit a region consistent with the test objects, the largest contiguous region by each of the parameters and at each tested density threshold was identified for each image (since a container containing at least one object consistent with a threat would be flagged for further inspection). The fraction of 20 foot containers whose images exhibit a contiguous region above given density thresholds larger than as a function of is presented in Figure 3, while Figure 4 presents the same for the parameter444The same results for 40 foot containers are presented in Figures A4 and A5. Across the entire analysis, 40 foot containers contain significantly fewer dense objects of all sizes compared to 20 foot containers.. The fractions of containers containing an object resembling the tests objects (at the selected density thresholds) may be immediately derived from these distributions, which amount to the false alarm rates for detection of those objects under an inspection scheme following this analysis. Table 2 presents these results.
Several results are immediately apparent in the Table 2 results. Each of the assembled fission package devices are detectable by their effective size in either or at false alarm rates of 2%, as is the spherical near-critical mass of HEU. These represent some of the most critical detection scenarios since detection of an assembled nuclear device would necessarily be a minimum requirement of any effective inspection scheme, while the critical mass of HEU roughly represents an amount of material needed for a weapon and generally is not detectable using passive radiation monitoring in even unshielded scenarios Kouzes et al. (2011). The critical mass of WGPu presents an unacceptably high false alarm rate when searched for using this method, but due to its strong passive neutron signature would be far more likely to be detected using existing passive monitoring if unshielded Kouzes et al. (2008). The addition of shielding or surrounding benign cargo to any of these scenarios further reduces the false alarm rate due to the additional material increasing the apparent density and object size, making it highly likely that a highly radioactive RDD could also be detected by either its passive radiation signature or the radiographic signatures of the large amount of shielding (multiple cm of Pb) that would be required to mask the passive signature. Notably, however, the data show that this method alone cannot identify smaller samples of SNM, primarily due to the fact that a spherical 100 cm3 sample of SNM has a peak steel equivalent thickness of 17 cm and thus cannot be identified as a region of unexpectedly high density (and in fact appears as a very typical object given the areal density distributions shown in Figure 2).
Note that the alarm rates presented in Table 2 are somewhat conservative in that they only examine the size of the objects in the containers, while any implemented inspection scheme could utilize a number of extra pieces of information such as location in the container of the identified object, shape of the object, etc. given sufficient data describing the cargo stream. A straightforward example of this is apparent in the data: each of the container fraction curves for the highest density thresholds tends to level off at a constant value (0.6–1.8%) before dropping to near zero at a relatively large value of or (for example 0.7% of both 20 and 40 foot containers have a largest object of high density with cm). Examination of the cargo images reveals that these objects are elements of the container frame that the image preprocessing failed to remove, and thus could be automatically disregarded in a search for threats. Such an addition to the inspection scheme could plausibly lower the false alarm rate to below 1% for the larger test objects, although the high frequency of smaller objects remains well above an acceptable alarm rate.
| Object | Threshold | 20 ft. by | 20 ft. by | 40 ft. by | 40 ft. by |
|---|---|---|---|---|---|
| (cm-steel) | (%) | (%) | (%) | (%) | |
| 100 cm3 SNM | 15.6 | 89.80 | 100.00 | 59.94 | 100.00 |
| WGPu | 21.2 | 40.78 | 39.99 | 10.09 | 10.03 |
| HEU | 25.6 | 1.49 | 2.51 | 0.87 | 1.68 |
| WGPu Package | 25.6 | 1.22 | 2.09 | 0.85 | 1.67 |
| HEU Package | 25.6 | 0.86 | 1.88 | 0.80 | 1.66 |
| 3 cm Pb shell | 21.2 | 14.94 | 24.80 | 1.06 | 2.13 |
| 6 cm Pb shell | 25.6 | 0.84 | 1.97 | 0.80 | 1.67 |
| 9 cm Pb shell | 25.6 | 0.76 | 1.73 | 0.80 | 1.63 |
| HEU + 3 cm Pb | 25.6 | 1.32 | 2.17 | 0.86 | 1.68 |
Implications for Cargo Security Policy and Recommended Future Work
This work demonstrates, via the analysis of a set of 122,500 stream-of-commerce cargo container images, that existing high-energy radiography technology, in conjunction with existing passive scanning methods, provides a functional means for detecting a broad class of nuclear and radiological threats in the analyzed container stream. The physical properties of assembled nuclear weapons, masses of SNM 1 critical mass, and shielded radiological threats sufficiently distinguish them in radiographic images from the typical contents of cargo to serve as a means of identifying possible threats with false positive rates 2%. For smaller samples of SNM, more intensive and/or specific screening methods are likely necessary. Since radiography systems are commercially available, overlap strongly with other customs inspection goals (e.g., detection of narcotics and stowaways), and can be deployed at lower financial and operational cost than specialized detection systems, these results suggest that the current development of highly-specific systems for deterring nuclear smuggling in cargo may merit reassessment. Nuclear threat detection research continues to primarily focus on novel systems with high specificity that may be unnecessary if it is sufficient to identify threats by their density and size as is suggested by the data for this cargo stream. Significant questions remain regarding the fraction of containers that must be radiographed to deter smugglers in this context Bier and Haphuriwat (2011); Wein et al. (2006), the threshold amounts of materials that must be detected, and the operational challenges associated with deploying more radiography systems in ports. This analysis suggests that radiography provides a stronger means of detecting nuclear threats than has been previously appreciated. In particular, this analysis suggests that radiography offers the capability to detect several relevant classes of threats in the near term without further technology development.
While the previous effort in the United States to widely deploy high energy radiography systems (CAARS555Cargo Advanced Automated Radiography System) and to upgrade passive detection systems at ports failed due to a number of logistical and technical reasons Aloise and Caldwell (2010); Shea et al. (2010), the conclusions of this work support reassessment of these programs as the most expedient and cost-effective means of reducing the nuclear/radiological smuggling threat in cargo streams. While approximately 5% of containers entering the United States are radiographed (having been selected based on intelligence information regarding the shipment) Congressional Budget Office (2016), many of these radiographs are conducted using lower energy radioactive isotope systems such as VACIS666Vehicle and Cargo Inspection System that lack sufficient penetration (17 cm-steel equivalent) to identify nuclear threats by their density Orphan et al. (2005). This suggests that systems with penetration similar to the of the 6 MeV scanner analyzed here are necessary, but given the extremely low frequency of cargo with density 30 cm-steel equivalent systems with higher energies, penetration, and radiation dose are likely not necessary in this context. While the CAARS program and other systems under development have focused on identifying nuclear materials by their high atomic number Henderson et al. (2018), which would further increase the sensitivity of a radiography system to nuclear threats, given the capabilities of existing radiography systems for threat detection suggested by this analysis expanded deployment of standard radiography systems may be advisable as more advanced systems are considered. A detection regime based on this technology would be inadequate for small samples of SNM, such as the 100 cm3 sample targeted by CAARS, and thus careful consideration is required regarding the amounts of material that inspection schemes are required to detect. Notably, however, given that the 100 cm3 represents a concentrated amount of material and that the simulated image included no surrounding materials (i.e., benign cargo among which the sample is placed), it is possible that in realistic scenarios additional information may be available to further increase the detectability of such small samples. For instance, further analysis of this data to examine the degree to which small dense regions occur in isolation or the use of radiographic systems with multiple imaging angles for 3D reconstruction could provide sufficient information to better identify objects resembling small SNM samples.
A lack of clear, well-motivated inspection goals has hampered research in this area, but this data provides critical information regarding the nature of materials in containers to inform future inspection requirements. Fundamentally, the conclusions from this analysis apply only to the commerce stream of the analyzed images and are subject to the assumptions of the model used to determine the system response to the test objects. Other cargo streams may contain a higher frequency of large dense objects (e.g., a port servicing a nearby mine producing many containers filled with dense ore), and thus may contain too many objects resembling threats to use radiography in this fashion. Given the encouraging results of this analysis, however, examination of images from other cargo streams, which have not been previously made available for public and/or academic investigation, should be pursued to determine the relevance of these results for other commerce streams. Additionally, actual radiographed images of possible threatening objects should be utilized to eliminate model uncertainty, although such work may require a classified setting. While this analysis focused on identifying threats by their size and density alone, further research on data of this type would likely lead to stronger identification algorithms. Access to data of this type provides highly useful prior information for the development of algorithms and methods for analysis of signals for threats, not only in the context of radiography but also in the context of passive scanning by providing detailed information about the distribution of cargo materials between sources and detectors Dalal and Han (2010). Additionally, using cargo stream data to characterize and catalog benign objects would further strengthen the capabilities of a radiography-based system to differentiate threats. As scientific and technical knowledge regarding nuclear and radiological weapons becomes more widespread, and thus available to potential smugglers, the availability of data to improve detection capabilities and assess existing and developing technologies becomes more valuable.
Acknowledgements.
The author gratefully acknowledges the Stanton Foundation’s Nuclear Security Fellowship program for providing the independent funding source that made this work possible. The assistance of Lewis Griffin and Matthew Caldwell of University College London and Edward Morton of Rapiscan Systems was also critical as they provided access to the image set, guidance on the analysis, and computational resources. Additionally, the author sincerely thanks Richard Lanza, Scott Kemp, and Areg Danagoulian of MIT for their guidance on this project and numerous helpful discussions.References
- Aloise and Caldwell (2010) G. Aloise and S. L. Caldwell, “Combating Nuclear Smuggling: Inadequate Communication and Oversight Hampered DHS Efforts to Develop an Advanced Radiography System to Detect Nuclear Materials,” Statement for the Record to the Committee on Homeland Security and Governmental Affairs, U.S. Senate (2010), https://www.gao.gov/products/GAO-10-1041T.
- Kouzes et al. (2011) R. T. Kouzes et al., eds., Radiation Detection and Interdiction and U.S. Borders (Oxford University Press, New York, 2011).
- Meade and Molander (2006) C. Meade and R. C. Molander, Considering the Effects of a Catastrophic Terrorist Attack (RAND Corporation, Santa Monica, CA, 2006).
- Abt (2003) C. C. Abt, “The economic impact of nuclear terrorist attacks on freight transport systems in an age of seaport vulnerability,” Abt Associates Inc. Exective Summary (2003).
- Rosoff and Von Winterfeldt (2007) H. Rosoff and D. Von Winterfeldt, Risk Analysis 27, 533 (2007).
- 911 (2007) “Implementing Recommendations of the 9/11 Commission Act of 2007, §1701,” 110th Congress Public Law 53 (2007).
- United States Government Accountability Office (2012) United States Government Accountability Office, “Combating Nuclear Smuggling: Megaports Initiative Faces Funding and Sustainability Challenges,” Report to Congressional Requesters (2012).
- United States Government Accountability Office (2013) United States Government Accountability Office, “Supply Chain Security: DHS Could Improve Cargo Security by Periodically Assessing Risks from Foreign Ports,” Report to Congressional Requesters (2013).
- Caldwell (2014) S. L. Caldwell, “Maritime Security: Progress and Challenges with Selected Port Security Programs,” Testimony Before the Committee on Homeland Security and Governmental Affairs, U.S. Senate (2014).
- Aloise (2009) G. Aloise, “Combating Nuclear Smuggling: Lessons Learned from DHS Testing of Advanced Radiation Detection Portal Monitors,” Testimony Before the Subcommittee on Investigations and Oversight, Committee on Science and Technology, House of Representatives (2009).
- Aloise (2007a) G. Aloise, “Combating Nuclear Smuggling: DHS’s Decision to Procure and Deploy the Next Generation of Radiation Detection Equipment Is Not Supported by Its Cost-Benefit Analysis,” Testimony Before the Subcommittee on Emerging Threats, Cybersecurity and Science and Technology; Committee on Homeland Security; House of Representatives (2007a).
- Caldwell (2012) S. L. Caldwell, “Supply Chain Security: Container Security Programs Have Matured, but Uncertainty Persists over the Future of 100 Percent Scanning,” Testimony Before the Subcommittee on Border and Maritime Security, Committee on Homeland Security, House of Representatives (2012).
- Aloise (2007b) G. Aloise, “Combating Nuclear Smuggling: Lessons Learned from DHS Testing of Advanced Radiation Detection Portal Monitors,” Testimony Before the Subcommittee on Emerging Threats, Cybersecurity, and Science and Technology; Committee on Homeland Security; House of Representatives (2007b).
- American Association of Port Authorities (2011) American Association of Port Authorities, “10 Years After 9/11, Security Still a Top Priority of U.S. Ports,” Press Release (2011), http://www.prnewswire.com/news-releases/10-years-after-911-security-still-a-top-priority-of-us-ports-128888213.html.
- American Association of Port Authorities (2016) American Association of Port Authorities, “Government Relations Priorities: Maritime Security,” Press Release (2016), http://aapa.files.cms-plus.com/PDFs/Maritime20Security.pdf.
- World Shipping Council (2002) World Shipping Council, “Comments of the World Shipping Council Submitted to the Department of Transportation Transportation Security Administration Regarding Operation Safe Commerce,” Docket Number TSA-2002-13827 (2002).
- Chen (2005) G. Chen, Nucl. Inst. Meth. B 241, 810 (2005).
- Bendahan (2017) J. Bendahan, Physics Procedia 90, 242 (2017).
- Danagoulian et al. (2010) A. Danagoulian et al., in Proceedings of 2010 IEEE International Conference on Technologies for Homeland Security (HST) (IEEE, 2010) pp. 379–384.
- Bertozzi and Ledoux (2005) W. Bertozzi and R. J. Ledoux, Nucl. Instrum. Meth. B 241, 820 (2005).
- Runkle et al. (2012) R. C. Runkle, D. L. Chichester, and S. J. Thompson, Nucl. Instrum. Meth. A 663, 75 (2012).
- Kouzes et al. (2008) R. T. Kouzes, E. R. Siciliano, J. H. Ely, P. E. Keller, and R. J. McConn, Nucl. Inst. Meth. A 584, 383 (2008).
- Katz et al. (2007) J. I. Katz, G. S. Blanpied, K. N. Borozdin, and C. Morris, Science & Global Security 15, 49 (2007).
- Gaukler et al. (2012) G. M. Gaukler, C. Li, Y. Ding, and S. S. Chirayath, Risk Analysis 32, 531 (2012).
- Gaukler et al. (2011) G. M. Gaukler et al., Annals of Operations Research 187, 65 (2011).
- Pincus et al. (2011) C. Pincus et al., “Technical Advice and Support for the Cargo Advanced Automated Radiography System (CAARS) Program,” LLNL-TR-473131-Final (2011), https://e-reports-ext.llnl.gov/pdf/471911.pdf.
- Fetter et al. (1990) S. Fetter et al., Science & Global Security 1, 225 (1990).
- Dalal and Han (2010) S. R. Dalal and B. Han, Ann. Appl. Stat. 4, 1256 (2010).
- American National Standards Institute (2016) American National Standards Institute, “American National Standard for Evaluation and Performance of Radiation Detection Portal Monitors for Use in Homeland Security,” ANSI N42.35-2016 (2016).
- Cotton et al. (2018) S. Cotton et al., “CNS Global Incidents and Trafficking Database: 2017 Annual Report,” (2018), https://www.nti.org/media/documents/global_trafficking_2017.pdf.
- Descalle et al. (2006) M.-A. Descalle, D. Manatt, and D. Slaughter, “Analysis of Recent Manifests for Goods Imported through US Ports,” UCRL-TR-225708 (2006), https://e-reports-ext.llnl.gov/pdf/339093.pdf.
- Birrer et al. (2016) N. Birrer et al., “Characterizing X-ray Attenuation of Containerized Cargo,” LLNL-TR-699242 (2016), https://e-reports-ext.llnl.gov/pdf/830626.pdf.
- Rapiscan Systems (2010) Rapiscan Systems, “Rapiscan Eagle® R60 Rail Car Cargo Inspection System ,” Product Overview (2010), https://www.rapiscansystems.com/en/products/rapiscan-eagle-r60.
- Stevenson et al. (2011) J. Stevenson, T. Gozani, M. Elsalim, C. Condron, and C. Brown, Nucl. Inst. Meth. A 652, 124 (2011), symposium on Radiation Measurements and Applications (SORMA) XII 2010.
- Rogers (2017) T. W. Rogers, Automated Analysis of X-Ray Images for Cargo Security, Ph.D. thesis, University College London, London, United Kingdom (2017).
- Jaccard et al. (2014) N. Jaccard, T. W. Rogers, and L. D. Griffin, in 2014 11th IEEE International Conference on Advanced Video and Signal Based Surveillance (AVSS) (2014) pp. 387–392.
- Jaccard et al. (2015) N. Jaccard, T. W. Rogers, E. J. Morton, and L. D. Griffin, in 2nd IET International Conference on Intelligent Signal Processing (2015).
- Agostinelli et al. (2003) S. Agostinelli et al. (GEANT4), Nucl. Instrum. Meth. A 506, 250 (2003).
- Berger et al. (2010) M. J. Berger et al., “XCOM: Photon Cross Section Database (version 1.5),” http://physics.nist.gov/xcom (2010).
- Sedgewick (1998) R. Sedgewick, Algorithms in C (Addison-Wesley, Boston, 1998) pp. 7–20.
- MathWorks (2018) MathWorks, “Image Processing Toolbox: User Guide,” (2018), https://www.mathworks.com/help/pdf_doc/images/images_tb.pdf.
- Paxton and Pruvost (1987) H. C. Paxton and N. L. Pruvost, “Critical Dimensions of Systems Containing 235U, 239Pu, and 233U,” LA-10860-MS (1987), https://inis.iaea.org/collection/NCLCollectionStore/_Public/19/013/19013587.pdf.
- im (1996) “Intermodal Safe Container Transportation Act Amendments of 1996,” 104th Congress Public Law 104–794 (1996).
- Bier and Haphuriwat (2011) V. M. Bier and N. Haphuriwat, Ann. Oper. Res. 187, 137 (2011).
- Wein et al. (2006) L. M. Wein, A. H. Wilkins, M. Baveja, and S. E. Flynn, Risk Analysis 26, 1377 (2006).
- Shea et al. (2010) D. A. Shea, J. D. Moteff, and D. Morgan, “The Advanced Spectroscopic Portal Program: Background and Issues for Congress,” Congressional Research Service Report (2010).
- Congressional Budget Office (2016) Congressional Budget Office, “Scanning and Imaging Shipping Containers Overseas: Costs and Alternatives,” Report to the Congress of the United States (2016), https://www.cbo.gov/sites/default/files/114th-congress-2015-2016/reports/51478-Shipping-Containers-OneCol.pdf.
- Orphan et al. (2005) V. J. Orphan et al., Applied Radiation and Isotopes 63, 723 (2005), 8th International Conference on Applications of Nuclear Techniques.
- Henderson et al. (2018) B. S. Henderson et al., Journal of Applied Physics 123, 164901 (2018), https://doi.org/10.1063/1.5025805 .
- Steinecker Containerhandle (2012) Steinecker Containerhandle, “Technical Specification for Steel Dry Cargo Container,” (2012), http://steinecker-container.de/.
- Zheng et al. (2018) S. Zheng, J. Pacheco, and J. Fisher, in Proceedings of the 35th International Conference on Machine Learning, Proceedings of Machine Learning Research, Vol. 80, edited by J. Dy and A. Krause (PMLR, Stockholmsmässan, Stockholm Sweden, 2018) pp. 5941–5949.
Appendix A1 Modeling of the Eagle R60® Scanner
In order to convert the 16-bit transmission images in the dataset to equivalent amounts of material, and similarly to compute the expected transmission value in the Rapiscan Eagle R60® scanner for objects of known materials, the essential components of the radiography system were modeled: namely the bremsstrahlung beam spectrum, the physics and geometry of the transmission of the beam through containers mounted on the rail cars passing through the scanner, and the detector response to the transmitted beam as delineated by Equation 2. While not all precise details of the system were available, as some elements of the system are proprietary, a combination of published information, known performance specifications of the system, and common functionality between gamma radiography systems allows a suitable approximation of the system response to different materials (to within 1 cm-steel equivalent over the full penetration range) for the purpose of the this analysis. In particular, because the transmission measurement is fundamentally a ratio between open-beam and material-in measurements under effectively the same conditions, errors in the model of the beam and detector response are second-order effects compared to the effect of the transmission physics in the materials. Each of the key elements of the model outlined by Equations 1 and 2 are described in the following sections.
A1.1 Setup/Geometry
The system geometry was modeled according the technical specifications from Rapiscan Rapiscan Systems (2010), the additional information in Figure 7.2 of Reference Rogers (2017), and confirmed against photographs of the deployed system. Given the fact that the vertical collimation width must be comparable to the resolution of the images, and is thus a few millimeters, it may be considered negligible in modeling the system. Additionally, no significant variation in the transmission value corresponding to empty container walls was observed as a function of height in the container, and thus any effects due to the vertical “fan” spread of the beam that remained after image preprocessing were also considered as negligible. While rudimentary models of the system were created for the Geant4 Agostinelli et al. (2003) simulations mentioned in the following sections, no element of the geometry was critical to the ultimate analysis.
A1.2 Bremsstrahlung Beam
Since the precise spectrum of the gamma rays generated by the bremsstrahlung of the Rapiscan Eagle R60® system was not available, simulation was conducted to produce a suitable approximation. A Geant4 Agostinelli et al. (2003) simulation was constructed in which 6 MeV electrons (which would be produced by the linear accelerator of the radiography system) were incident on a bremsstrahlung radiator consisting of 5 mm of tungsten backed by 5 cm of copper. The spectrum of resulting gamma rays in a 1 degree vertical collimation slice forward of the beam direction was recorded and is shown in Figure A1, which was used as the representation of the beam spectrum histogram in the model ( in Equation 2).
Note that since this analysis made use only of transmission ratios comparing material-in-beam to the open beam transmission and since the images in the dataset were preprocessed to correct for variations in the beam Rogers (2017), only the approximate shape of the spectrum was required for the analysis rather than its magnitude and only significant variations in the high energy portion of the spectrum would be likely to significantly affect results for the transmission ratio. While the absolute beam flux affects the precision of the transmission measurement (due to variation in the number of photons detected), the uncertainty on the reconstructed material thickness was estimated from data as described in Section A1.6.
A1.3 Transmission Modeling
The transmission component of the model ( in Equation 2), i.e., the attenuation of the beam due to materials, was modeled using a simple model of exponential attenuation and the NIST X-Ray Mass Attenuation Coefficients Database Berger et al. (2010), which provide photon attenuation data for all elemental materials up to and energies of 20 MeV (as well as data and prescriptions for the calculation of data for compounds of the elements). That is, for a material sample of atomic number , density , and thickness along the beam , the attenuation of the beam at energy may be computed as
| (A3) |
For compound materials, the attenuation coefficient was calculated as Berger et al. (2010)
| (A4) |
where the sum runs over all elements in the compound and the weight is the mass fraction of the th element. For the calculations involving plutonium, the values of for was approximated as those of due to the lack of available data in the NIST database. Using this model, for any material or mix of materials presented to the beam the matrix may be constructed such that is the spectrum after the initial beam of spectrum passes through the material. Note that under this exponential attenuation model, in which detection of scattered beam components is neglected, is a diagonal matrix.
This model is effective for the case of the radiography system studied here due to the tight collimation of the beam. That is, photons reaching the detectors are almost exclusively photons that have undergone direct transmission, and thus secondary scattering effects that are not captured by the exponential attenuation model are not significant. This was verified by conducting several Geant4 Agostinelli et al. (2003) simulations of the system for different materials. The exponential transmission model differed from the Geant4 calculations by at most 0.5 cm-steel equivalent, and thus the exponential model was used for computational efficiency across all materials.
A1.4 Detectors
The detectors were modeled as mm CdWO4 crystals, which are typical of those used in gamma radiography systems Chen (2005). In a Geant4 Agostinelli et al. (2003) simulation, photons of energies 0–6 MeV were impinged along the long axis of the crystal uniformly illuminating the central 5 mm of the second-longest axis to simulate the collimated beam striking the detector crystal. The matrix mapping the initial photon energy to the distribution of resulting energy deposition in the crystal was constructed using approximately simulated photons. Like the initial bremsstrahlung spectrum, the exact details of the detectors and their response were not available, but due to the fact that the measurement consists of a ratio and given the similarities in detectors used across bremsstrahlung radiography systems which informed the choices for the simulation the approximation used here suffices.
A1.5 Conversion to Steel Equivalent Thickness
With the entirety of the transmission model in place, it is straightforward to convert the transmission value calculated for any configuration of material to an equivalent thickness of steel by comparing to the calculated transmission as a function of steel thickness at standard density ( g/cm3). Note that as the effective atomic number of the material of a given areal density increases, the equivalent areal density of steel increases as well due to the increasing attenuation of photons in the beam due to increasing electron-positron pair production cross section as a function of . A lookup table as a function of material thickness was created for each relevant material, which permitted direct conversion of transmission values to equivalent steel thicknesses for each of the materials.
A1.6 Uncertainty on the Steel Equivalent Measurement
In any radiographic measurement, uncertainty on the transmission measurement (due to the statistics associated with the number of photons that reach the detectors and systematic effects) affects the reconstructed effective thickness for each pixel. Since the measured equivalent thickness may fluctuate downward for some of the pixels representing a given object, such fluctuations may decrease the size of the 4-connected region representing the object. Thus, in order to compare modeled objects to their representations in the radiographic images, it is necessary to estimate the effects of this reduction in the size of the 4-connected regions.
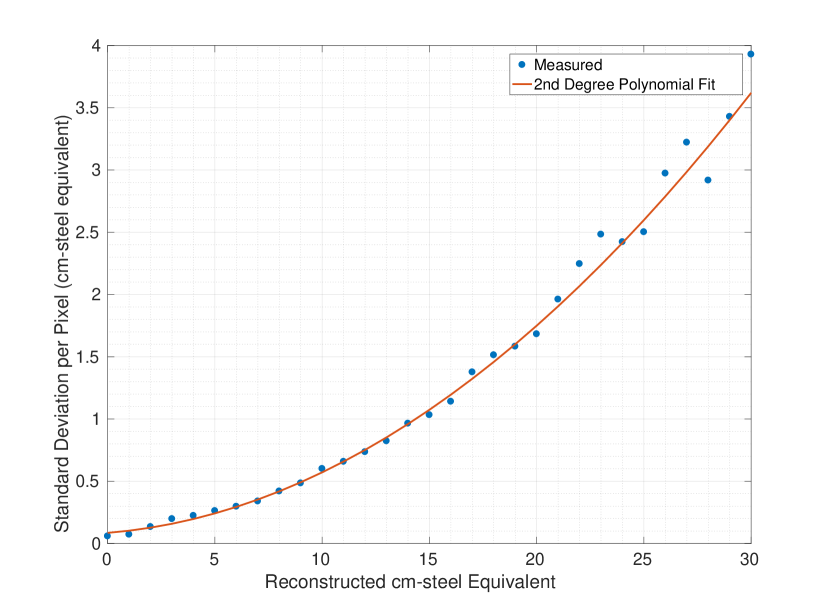
To estimate the uncertainty in the measurement of the equivalent steel thickness in the images for each pixel, a data-driven approach was used to establish an upper bound on the variance of the measurement as a function of thickness. To do this, each pixel in each image (for a subset of the entire image set in order to reduce computation time) was compared to its 4-connected neighbors, and the difference in the reconstructed equivalent thicknesses between each pixel and its neighbors was histogrammed. Under the assumption that adjacent 4-connected pixels represent very similar elements of the imaged cargo given the 0.5 cm resolution of the pixels, this provides an estimate of the measurement uncertainty but overestimates the uncertainty since adjacent pixels may in fact represent different cargo thicknesses. For each equivalent thickness in the range relevant to the image set (i.e., 0–30 cm-steel equivalent in bins of 1 cm), a Gaussian was fit to the spread of the measurements (excluding data from the bins) to determine an upper bound on the measurement uncertainty. The results of this analysis are shown in Figure A2. The combined statistical and systematic measurement uncertainty was found to be modeled well by a quadratic polynomial over the range of interest, as shown in the figure. These results were applied to simulate threatening objects in cargo as described in the following section.
A1.7 Assessing the Validity of the Model
While this model makes a number of assumptions regarding system parameters, the model can be compared against known features of the data and available specifications of the Eagle R60® system to assess its validity. In particular, if the exponential attenuation model of the radiography system is valid, as has been well established for narrowly-collimated bremsstrahlung radiography, then comparison to two known data points (i.e., the transmission values for known amounts of known materials) is sufficient to test the model Chen (2005). Two such points are readily available:
-
•
The largest peak in the pixel-by-pixel density distribution (which is shown without truncation in Figure A6) corresponds to an empty projection of a container in which the pixel represents the attenuation of the beam through just the two walls of the container and air. Due to the highly standardized nature of cargo containers, the total thickness of steel present in the two walls is a known quantity. The side walls of standard intermodal containers consist of corrugated steel plates that are 1.6–2.0 mm thick Steinecker Containerhandle (2012). While the corrugation of the steel causes the amount of steel presented the beam to vary slightly along the length of the container, the average “empty pixel” represents 4.3 mm of steel (due to the diagonal portions of the corrugation increasing the presented wall thickness slightly). The mean of the peak corresponding to the empty pixels in data occurs at a value of .
-
•
The manufacturer of the Eagle R60® quotes the steel penetration of the system, i.e., the greatest thickness of steel behind which additional material would be discernible, as 31.0 cm. Given that measurements at the low end of transmission are subject to uncertainty as discussed in the previous section, this value is slightly below the value that would correspond to a measurement of (i.e., one bit out of 216). From Figure A2, the pixel-to-pixel measurement uncertainty at 31.0 cm-steel equivalent is approximately 3.8 cm-steel equivalent (standard deviation). Thus, a measurement of should ideally (under a perfect measurement) corresponds to 34.8 cm-steel.
Using the model as described, it is straightforward to compute the expected transmission values for each of these test cases. For 4.3 mm of steel, the model predicts , which is in very good agreement with the data value. Note that due to the exponential nature of the attenuation, the value of changes rapidly as a function of steel thickness for such small amounts of material, but even 1 mm variations in the thickness of the walls lead to changes of 3% in . Thus, the model successfully reproduces the data for the case of the empty container walls. At the low-transmission end of the data, the problem is different in that small changes in the value of correspond to large changes in the amount of material. The model predicts that 36.4 cm-steel produces a value of , which corresponds to a slight overestimation but is within the uncertainty of the measurement of a single pixel. Thus, given the known data and the validity of the exponential attenuation model for the system, the model represents the data well to within across the full range. Due to the uncertainty at the low-transmission end of the range, the comparisons between test objects and data in the text were conducted at density thresholds somewhat below the penetration limit of the system (25.6 cm-steel) to reduce any possible effect from model error in this region.
Appendix A2 Calculation of Expected Radiographed Object Sizes
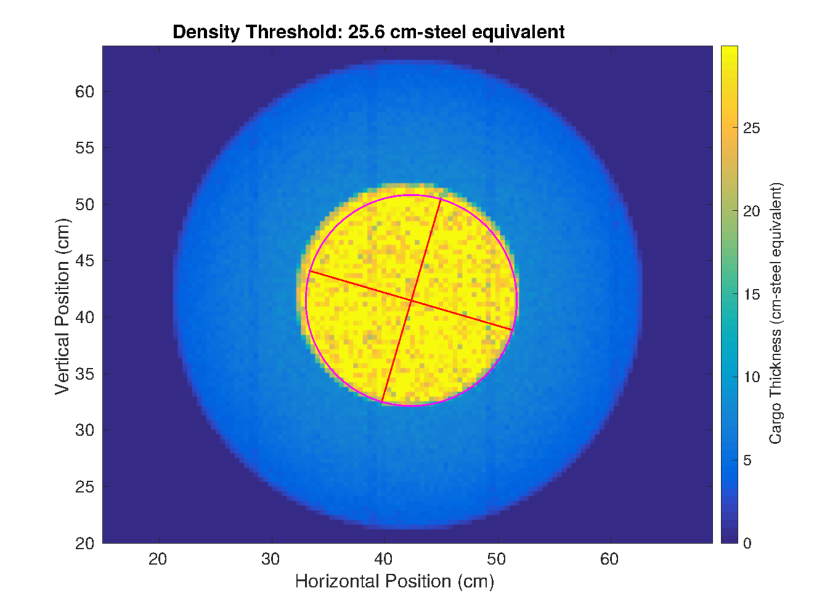
Using the model for the measurement uncertainties described above, each of the test objects listed in Table 1 was modeled to create simulated images of the objects with the same resolution, precision, etc. as would be expected if they were imaged using the Eagle R60® system. First, each object was mapped to the mm pixel resolution of the scanner and the material composition of the object along the projection of each pixel was determined. The system model (Equations 1 and 2) was then applied to determine the expected transmission for each pixel, which was then converted to the steel equivalent thickness . To determine the expected reconstructed size of each object ( and ) given the pixel-to-pixel uncertainty derived from the data each image was simulated times, applying normally distributed random fluctuations to each pixel according to the extracted standard deviation as a function of cargo thickness (Figure A2). Additionally, since some source variation was still present in the images after preprocessing Rogers (2017), this effect was also simulated for the test object images. By examining the image set, it was determined that the remaining vertical striping artifact from the source variation amounted to an approximately 4% reduction in the reconstructed steel equivalent thickness of a given pixel in such a stripe. Since this source variation could potentially cause dense regions to be split by the vertical striping, these were conservatively simulated in test object images by applying a 10% reduction in the reconstructed thickness in the stripes and modeling the stripes with the maximum width observed in data. Additionally, the thickness thresholds chosen for the analysis were deliberately chosen to be less than the expected thicknesses of each object to place the thresholds well below this effect. Each of these simulated images was then processed using the same object finding algorithm as was applied to the cargo container images to compute the expected and values for the objects. For the objects of interest, it was found that the pixel-to-pixel variations led to variations of at most a few percent (except for the smallest test objects, the 100 cm3 sample and WGPu critical mass, which varied by approximately 0.1 cm in radius and 1 cm2 in area due to statistical fluctuation), and thus the mean values of and are quoted in Table 1. Figure A3 shows the application of this procedure for the Fetter, et al. plutonium weapon model Fetter et al. (1990) at an object detection threshold of 25.6 cm-steel equivalent. The algorithm identifies the dense core of the weapon (the plutonium plus the depleted uranium tamper) with the expected effective radius and area.
Appendix A3 Results for 40 Foot Containers
The plots presented in this section (Figures A4 and A5) present the equivalent results for 40 foot containers as are presented for 20 foot containers in Figures A4 and A5 in the main text. As noted in Footnote 4, 40 foot containers contain significantly fewer large, dense objects than 20 foot containers and thus the techniques discussed for identifying threats in the main text will perform at least as well (and in many cases significantly better) when applied to streams of 40 foot containers compared to 20 foot containers. This result follows intuitively from the fact that the weight limit for 40 foot containers is only slightly larger than the 20 foot container limit in most jurisdictions im (1996), and thus 40-foot containers often contain spatially large/bulky, but not dense, shipments such as large pieces of equipment. As for the 20 foot container results shown in the main article, the data shown in this section focus on effective object thicknesses cm-steel equivalent due to the relevance of this density range to the search for objects resembling nuclear/radiological threats.
Appendix A4 Additional Results from the Radiographic Image Set
This section presents several other results from the image set that do not necessarily directly pertain to the analysis presented in the main article, but may be of interest to those working in the fields of cargo security and logistics. In particular, these results present information that may be useful for providing information for priors in Bayesian analyses of cargo inspection data Zheng et al. (2018) and in giving context to previous analyses of radiography for nuclear threat detection Gaukler et al. (2011). The results in this section include calculations of the average cargo areal density as a function of position in containers (Figures A11 and A12) and the distributions of the sizes of of the largest objects by container that correspond to the cumulative distributions presented in the main text. Each result is described in the caption accompanying its figure, along with any notes regarding interesting features of the data.