ALMA Detection of Extreme Blue-Shifted Ionized Gas Within
0.2 pc of Sgr A* from –480 km s-1 to –300 km s-1
Abstract
We have used the capabilities of ALMA to probe the ionized gas towards the Galactic center with the H30 mm hydrogen recombination line within 30 of the Galaxy’s dynamical center. The observations are made with spatial and spectral resolutions of 046 035 and 3 km s-1, respectively. Multiple compact and extended sources are detected in the mini-cavity region with extreme negative radial velocities ranging from –480 km s-1 to –300 km s-1 (pc) from Sgr A*. This is the highest radial velocity of ionized gas detected beyond the inner 1′′ of Sgr A*. This new component is kinematically isolated from the orbiting ionized gas. The detected gas has a velocity gradient ranging from –50 to –200 km s-1 arcsecond-1 located to the southwest of Sgr A* at a position angle of –160∘. Previous proper motion measurements in the immediate vicinity of these extreme high-velocity ionized components have been measured and show transverse velocities that range from 313 - 865 km s-1. If we assume that they are associated with each other, then the total velocity implies these components are gravitationally unbound. In addition, we report the kinematics of cometary radio and infrared sources. These sources are diagonally distributed with a position angle of within 14 of Sgr A*. We interpret the highly blue-shifted features to the SW where the mini-cavity is located and red-shifted cometary sources to the NE in terms of the interaction of a collimated outflow with an opening angle of 30∘. An expected mass outflow rate of 2 or 4 M⊙ yr-1 is estimated by a relativistic jet-driven outflow or collimated stellar winds, respectively.
1 Introduction
The central parsec of the Galactic center (GC) provides a unique opportunity to gain insight into the extreme physical conditions of galactic nuclei. At the dynamical center, a supermassive black hole of 4106 M⊙ (Ghez et al., 2005; Gillessen et al., 2009; Reid & Brunthaler, 2004) is coincident with the compact radio source Sgr A*. On a scale of a few parsecs (1 pc corresponds to 25′′ at the 8.5 kpc GC distance), Sgr A* is engulfed by ionized material tracing a mini-spiral structure as well as a ring of molecular gas with a radius of 2-5 pc orbiting Sgr A* at a velocity of 100 km s-1 (Guesten et al., 1987; Jackson et al., 1993; Marshall et al., 1995; Latvakoski et al., 1999; Bradford et al., 2005; Herrnstein et al., 2005; Christopher et al., 2005; Ekers et al., 1983; Lo & Claussen, 1983). It is well known that the bolometric luminosity of Sgr A* due to synchrotron thermal emission from hot electrons in the magnetized accretion flow is several orders of magnitude lower than that expected from the accretion of stellar winds and ionized gas. Over the years, there have been a number of studies to address this puzzling issue using radiatively inefficient accretion flow (RIAF) models in which a fraction of the initially infalling material accretes onto Sgr A* and the rest is driven off as an outflow from Sgr A* (e.g. Yuan et al., 2004; Quataert, 2004; Shcherbakov & Baganoff, 2010; Wang et al., 2013). Another class of models explaining the low luminosity from accretion onto Sgr A* (in comparison with its expected Bondi-Hoyle accretion rate from nearby gas) considers that most of the gas approaching Sgr A* is pushed away as part of a jet or outflow (e.g. Falcke & Markoff, 2000; Das et al., 2009; Becker et al., 2011; Yusef-Zadeh et al., 2016). Identification of high velocity, potentially unbound ionized gas clouds tracing the interaction sites of a jet with the surrounding material would provide support for this picture. Our approach is to search for such interaction sites with millimeter (mm) hydrogen recombination line (RL) emission from ionized clouds near Sgr A*. The high sensitivity, long time baseline and broad velocity coverage observations as well as the high line-to-continuum ratio of 2 for H30 RL (Wilson et al., 2012; Zhao et al., 2010), provides an unprecedented opportunity to identify and probe interaction sites with extreme kinematics within a pc of Sgr A*.
One of the earliest high resolution radio studies of ionized gas in the central parsec was carried out with the VLA at 3 cm (Roberts & Goss, 1993; Roberts et al., 1996). Radial velocities extending up to –280 km s-1 were detected in the mini-cavity, a circular-shaped structure with a diameter of 2” centered 3” SW of Sgr A* (Yusef-Zadeh et al., 1990). Similarly, infrared observations using Br and [Neii] lines detected a –240 km s-1 velocity component in the mini-cavity region (Lutz et al., 1993; Herbst et al., 1993; Lacy et al., 1991; Krabbe et al., 1995). More recently, two studies at 1.3 cm and 1.3 mm (Zhao et al., 2009, 2010) used the VLA and SMA to fully map the kinematics of the mini-spiral at radio and mm, respectively. Within a few arcseconds of Sgr A*, they reported enhanced electron temperatures approaching 1.5 K. However, their studies were limited by relatively low angular resolution (19 15) and focused on radial velocities within km s-1 which showed similar kinematics to those found in previous radio recombination line (RRL) studies. Measurements in the near-IR with the VLT detected HeI, Br, and [Feiii] lines, 2.2′′ south of Sgr A* (Steiner et al., 2013). This localized ionized filament at the eastern edge of the minicavity is highly blue-shifted with a peak radial velocity km s-1 and velocity gradient of 200 km s-1 arcsecond-1. There is no obvious stellar source with the same radial velocity to explain the origin of the filament. Steiner et al. (2013) argue that the high velocity gas is shock heated and may result from the collision of the northern and eastern arms.
Here we report new ALMA observations showing multiple highly blue-shifted velocity components in the mini-cavity, one of which has a peak velocity km s-1 extending to 480 km s-1. This is the highest blue-shifted velocity ionized cloud that has been detected, thus far, near Sgr A*. Combined with proper motion measurements, the new components are possibly gravitationally unbound. We also detect RL emission from cometary sources which appear elongated in the direction of Sgr A*. These cometary features are a subset of a number of partially resolved sources (X3, X7, F1, F2, F3, P1, P4 and the Sgr A East tower) that have been detected with radio and 3.8 m observations (Yusef-Zadeh et al., 2012, 2016; Mužić et al., 2007, 2010). These have a mixture of hot dust and ionized gas and are elongated with similar position angles, and (Mužić et al., 2007, 2010; Yusef-Zadeh et al., 2016). The radial velocity and position velocity diagrams are presented. The highly blue-shifted features in the mini-cavity and the cometary sources appear to trace sites of an interaction from a collimated jet- or wind-driven outflow from the direction of Sgr A*.
2 Observations and Data Reduction
The observations were carried out with the Atacama Large Millimeter/submillimeter Array (ALMA) originally as part of a multi-wavelength monitoring campaign of Sgr A*. The calibrated Band 6 archival data (project code 2015.A.00021.S) was observed in Cycle 3 on two epochs, 2016 July 12/13 and July 18/19. We utilized the calibrated dataset to extract the H30 RL in the inner parsec (26) of the Galactic center (GC) at 231.901 GHz with CASA. The dataset was first combined along all spectral windows prior to deriving and applying phase self-calibration solutions three times for subsequently shorter solution intervals. A final simultaneous phase and amplitude self-calibration solution was derived for each integration time interval before imaging the continuum.
The H30 data cube was constructed by first subtracting a linear continuum in the plane and then applying the same phase and amplitude solutions derived from the continuum. A broad velocity range of –1200 km s-1 to +600 km s-1 was imaged, allowing a search for anomalous high-velocity ( km s-1) emission along with a spectral resolution of 3 km s-1. A Briggs parameter of 0.5 was used to weigh the visibilities prior to gridding which allowed a compromise between natural and uniform weighting schemes that favor extended and compact features respectively. This achieved a synthesized beam of 046 035 (PA = –678) and full spectral resolution of 0.63 km s-1. A primary beam correction was applied with a cutoff at 20% (372 field of view (FOV)). The July 12/13 H30 image cube has mJy per channel, averaged to 3 km s-1.
The continuum was imaged in a similar fashion but was confusion and dynamic range limited with a sensitivity of mJy beam-1 and mJy beam-1 for the July 12/13 and July 18/19 datasets, respectively. Due to the relatively poor data quality of the second epoch, we chose to use the first (July 12/13) dataset only in the analysis presented here. However, the high-velocity features described here are also detected in the July 18/19 dataset.
The peak continuum position of Sgr A* was found at in the J2000 reference frame. In order to properly compare to other datasets, we applied a shift to the coordinate system by 61 and –123 mas in right ascension and declination respectively such that the position of Sgr A* could be found at . Unless otherwise noted, the positions of sources are reported as offsets with respect to this corrected position. All images are displayed in the J2000 coordinate reference system.
3 Results
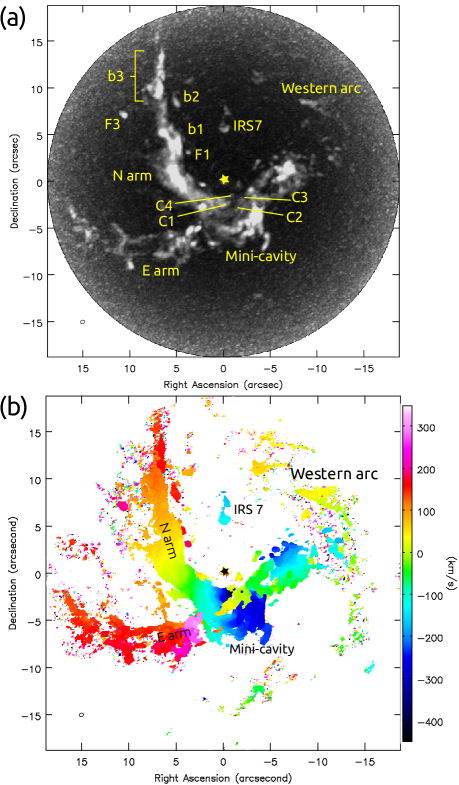
Figure 1a displays a peak intensity image of H30 at 231.9 GHz. Three prominent components of the mini-spiral are labeled as the northern arm, eastern arm and the western arc at the edge of the FOV. A number of compact sources are detected, the most prominent of which is IRS 7, an M2 supergiant star (Wollman et al., 1982; Lebofsky et al., 1982), with a head-tail structure (Yusef-Zadeh & Morris, 1991; Serabyn et al., 1991) at PA 0∘ from Sgr A*. Figure 1b shows the velocity of the peak emission of the H30 recombination line from the mini-spiral on the same scale and resolution as Figure 1a. The kinematics of the mini-spiral traced in Figure 1b are very similar to past radio and infrared measurements (e.g. Roberts & Goss, 1993; Roberts et al., 1996; Zhao et al., 2009, 2010; Irons et al., 2012). Broadly speaking the N arm shows red-shifted radial velocity components 100 km s-1 which gently decreases to km s-1 from north to south and then makes a large velocity jump to -300 km s-1, as the gas approaches Sgr A* from the east. The velocity gradient of the eastern arm has an opposite trend, becoming increasingly red-shifted before it changes direction and becomes blue-shifted ( km s-1) near Sgr A*.
The fourth prominent component of the mini-spiral is within the inner few arcseconds of Sgr A*, the so-called ionized bar. The ionized bar is in fact the high negative velocity component of km s-1 which lies closest to Sgr A*. There is a ridge of highly blue-shifted gas, with a U-shaped structure (i.e., the mini-cavity) depressing the continuum emission associated with the ionized bar, where the northern and eastern arms appear to converge. Although the dominant emission is blue-shifted, there is also zero km s-1 gas that is detected throughout this region. Our observations show for the first time highly blue-shifted ionized material near Sgr A*, as described below.
3.1 Mini-cavity
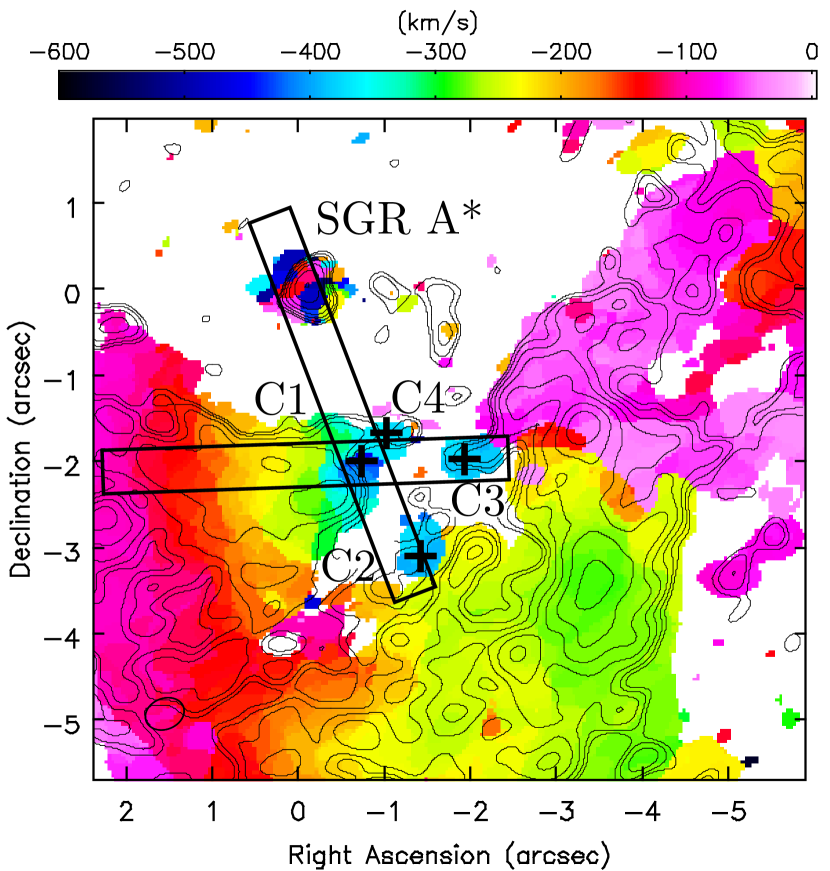
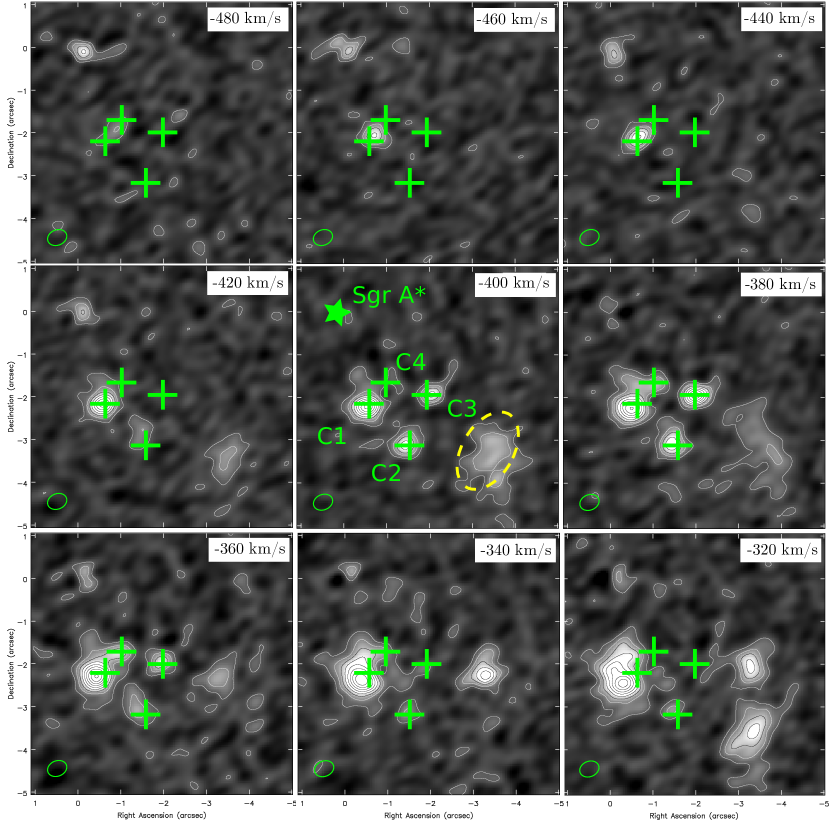
We have found four highly blue-shifted velocity components, C1 to C4, along the western and eastern walls of the mini-cavity. The kinematics of these sources exceed those of the orbiting gas of the ionized bar by 200 km s-1. Figure 2 shows the distribution of the peak velocity of the mini-cavity region in H30. The four aforementioned sources labeled and distinguishable by their highly blue-shifted –400 km s-1 emission (blue/teal in the image). The emission from the orbiting gas associated with the ionized bar is shown in red and pink.
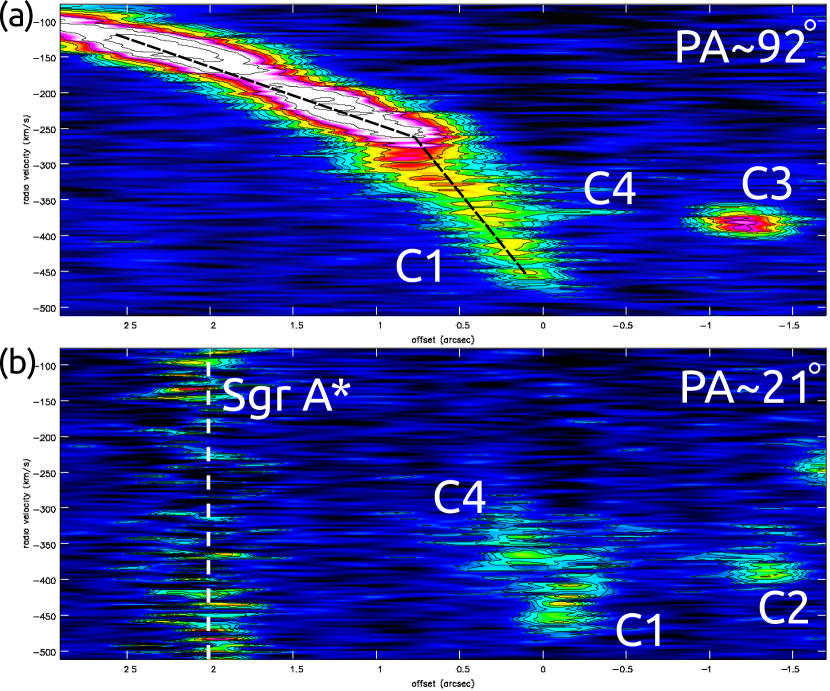
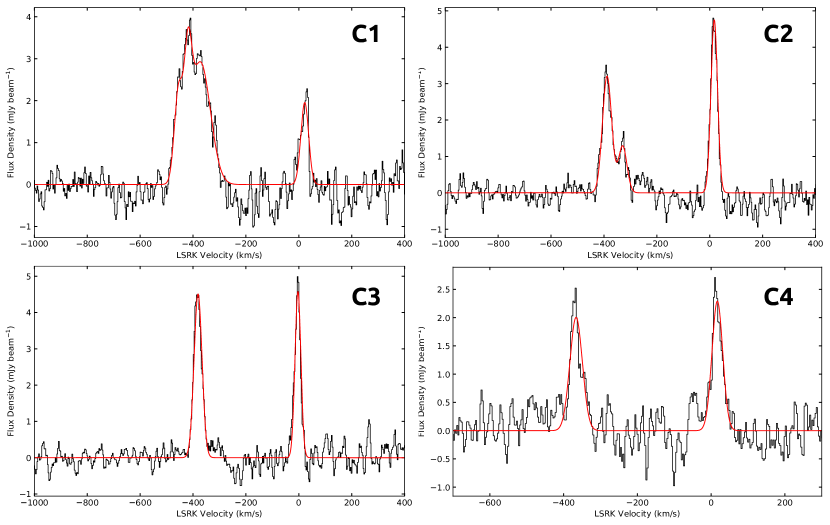
The position-velocity (PV) diagrams along two slices (arrows in Figure 2) that pass though C1 to C4 are shown in Figure 3. Figure 3a (corresponding to the nearly horizontal arrow in Figure 2) shows the kinematic separation of C1, C4 and C3 from the orbiting gas with lower negative velocities. Figure 3b shows the PV diagram of C1, C2 and C4 indicating that these sources are also kinematically isolated despite having similar km s-1. The individual velocity profiles of each of the four components are shown in four panels in Figure 4. C1 shows the highest negative velocity, consisting of (at least) three blue-shifted components.
Figure 5 shows nine channel maps of H30 emission between –380 and –480 km s-1. These maps show clearly the blue-shifted emission is extended but is confined to the mini-cavity region. In addition to the aforementioned C sources an additional ridge (yellow dashed ellipse) of –400 km s-1 emission is seen in the SW corner of the mini-cavity. Because it is coincident with the orbiting gas (seen at velocities 320 km s-1) it is not visible in Figure 1b. The ridge of emission is most likely He30 as it is separated by the expected value of 122 km s-1 to H30 emission at –272 km s-1. The He30 emission was also detected by Tsuboi et al. (2017a). We find in this region which is typical for HII regions (Wilson et al., 2012).
The positions and physical properties of the individual sources C1 - C4 are described below and are summarized in Table 1. The first column of Table 1 is the given source name as described throughout the text. Column 2 is the offsets from the position of Sgr A* (see Section 2) in right ascension and declination respectively. Columns 3 and 4 are the projected offset and position angle with respect to Sgr A*. Column 5 is an upper limit to the geometric mean of the source. Columns 6, 7 and 8 are the peak intensity, central velocity and the FWHM of the spectra integrated over one synthesized beam respectively. Note that only relevant (in this case ‘high-velocity’) components are listed for each source. Column 9 is the lower-limit of the electron density for assumed electron temperatures of K (see Section 3.1.4). For the head-tail sources (see Section 3.2), column 10 lists the angular length of the structure and column 11 is the difference in velocity between the head and tail.
3.1.1 C1 & C4
The closest sources to Sgr A* with the highest blue-shifted velocities are C1 and C4 which lie at the northeastern corner of the mini-cavity. C1 is the most prominent of the four high velocity components defined by the most extreme blue-shifted emission. An elliptical Gaussian was fit to the RL integrated intensity from –460 - –450 km s-1. The result was a peak found at , with a projected distance and PA from Sgr A* of 217 (0.09 pc) and –163∘ respectively. The top-left panel of Figure 4 shows the spectrum at this position. Three velocity components characterize the high velocity emission, one of which has the highest negative velocity (–455 km s-1) and a line width (FWHM) km s-1, as listed in Table 1. This is the highest velocity gas found towards the inner parsecs of the GC. In addition the source is notable for a breadth of emission that extends from approximately –460 km s-1 to –300 km s-1 in a 12 square region.
The position of C1 is still 05 NE of the highest velocity emission found by Steiner et al. (2013) in the IR. At their position, we find emission that ranges from roughly –415 to –240 km s-1 compared to their reported detection at –378 km s-1 with [Feiii] . In addition, Tsuboi et al. (2017b) detected H42 emission at –380 km s-1 SW of this position (28 from Sgr A*) and attribute it as the counterpart to the high velocity Br emission detected by Steiner et al. (2013).
C4 is defined by the integrated emission from –370 - –360 km s-1 and is found to be projected about 05 NE of C1 and is the closest high velocity gas to Sgr A* at a distance of 20 (0.08 pc) from Sgr A*. The emission peaks at –366 km s-1 which is less than all three of the fitted components of C1 but is most likely associated with the broad –372 km s-1 C1 gas. Both C1 and C4 have a low velocity component near 20 km s-1 with km s-1.
Figure 3b shows a PV diagram that connects the position of Sgr A* with C1. Because of the non-thermal contribution from Sgr A*, the continuum is poorly fitted at this position. As a result, there appears to be emission, in every channel (the vertical dashed white line). The emission due to C1 is apparent in the panel (located at 0 offset) as is that of C4, however there is not a significant contribution of ionized gas between the projected positions of C1/C4 and Sgr A*.
A summary of the velocity gradient is best seen in the PV diagram in Figure 3a. The velocity gradient in the panel extends from the aforementioned C1 contribution of –460 km s-1 to –100 km s-1 from the N arm over a projected distance of 3 . This yields an overall change of 120 km s-1 arcsec-1 or 5.0 km s-1 pc-1. However, a noticeable kink in the ionized emission appears in the PV diagram at an offset of roughly 09 (to the east). If only positions to the east of C1 (further along the Northern Arm) are considered, the observed gradient is reduced to 71 km s-1 arcsec-1 which is more consistent with the orbiting gas of the mini-spiral. However, within 09 of C1, the velocity gradient is measured as 233 km s-1 arcsec-1 or roughly 10 km s-1 pc-1. C4 is distinguishable as a small horizontal extension from this increase in velocity gradient
3.1.2 C2
The C2 source is found towards the projected interior of the mini-cavity just north of the southern ridge at , with a projected angular distance from Sgr A* of 34. The position was determined with RL integrated intensity from –400 - –390 km s-1. Notably, a PA from Sgr A* of roughly –155∘ intersects all of C1, C2 and C4. This is evident in the PV diagram found in the bottom panel of figure 3 where the ionized emission of C2 is seen at an offset of roughly 15. The 2 cm radio continuum source of Yusef-Zadeh et al. (1990) is coincident with C2.
The H30 spectra of C2 is found in Figure 4. Two blue-shifted components are measured with the most extreme found with a center velocity of km s-1, FWHM of km s-1 and peak intensity of 3.2 mJy beam-1. The kinematics are remarkably different than the neighboring ionized orbiting gas found just south of C2 where velocities are greater than –250 km s-1. Unlike the C1 source, there appears to be no kinematic connection between the emission and the orbiting gas seen in PV diagrams. However, similar to C1 (and C4), a low-velocity component is found at 20 km s-1.
3.1.3 C3
The third of the extreme blue-shifted sources is found at , just east of the northwestern corner of the mini-cavity 28 from Sgr A*. We have defined C3 by the RL integrated intensity from –390 to –380 km s-1. Similar to C2, C3 appears to be kinematically isolated from the orbiting ionized gas and more compact than C1 (see Figure 3). C3 has a peak component at km s-1, with km s-1, and intensity of 4.64 mJy beam-1 (spectra shown in Figure 4 and is in the vicinity of the radio continuum source detected in Yusef-Zadeh et al. (1990)). The position angle with respect to Sgr A* varies from that of C1 and C2, and instead is found at roughly –135∘. This is a difference of nearly 30∘ from the C1 PA. Consistent with the other mini-cavity sources, a low-velocity component is detected, but at –3.3 km s-1 instead of 20 km s-1.
3.1.4 The Gas Density
To approximate the electron density () of the extreme blue-shifted emission, nominal values of 7.5 K and 12.5 K were used for the electron temperature. The electron temperature is known to be elevated near the mini-cavity (see Roberts & Goss, 1993; Zhao et al., 2010), deviating from the typical values of 7.5 K for HII regions. The size of the sources were determined by fitting an elliptical Gaussian on the plane of the sky where the blue-shifted emission was detected. When the source was resolved we extracted the source size deconvolved from the beam otherwise it was convolved with the beam. This yields an upper-limit on the size of the source or a lower-limit on the as calculated below, assuming a path length equal to this upper value.
The line intensity at 231.9 GHz can be expressed as (Wilson et al., 2012):
| (1) |
Solving for the emission measure (EM) while converting to velocity space and flux density,
| (2) |
dividing by the path length and taking the square root then gives us the . Most of the RL emission observed was best characterized with multiple velocity components. Thus to apply equation 2 we interpreted the last two factors as the sum of the product of each (blue-shifted) component, .
The estimated (lower limit) is given in Table 1 for both values of the assumed Te with path length taken to be identical to the source size projected on the sky. C1 is found to have a much higher density with a value of cm-3 than the other mini-cavity sources. C3 and C4 have a much lower range of 1.4 - 2.7 cm-3. The of C2 is comparable to C1 but it should be noted that the assumed size of C2 is nearly half that of C1.
To approximate the total mass of the extreme blue-shifted emission coincident with the mini-cavity, the entire region that contained significant emission from –500 to –300 km s-1 was integrated. The region was equivalent to 11.7 beams () at roughly , . This velocity range accounts for the peaks of negative velocity components as well as the width seen due to thermal and turbulent broadening. The resultant spectra of the blue-shifted emission was best fit with two Gaussians at –353 and –264 km s-1. The more negative component has a peak and FWHM of 1.8 mJy beam-1 and 131 km s-1 respectively. Applying equation 2, we determine an EM of roughly cm-6 pc from this negative component.
The geometric mean of the area of the integrated region was used as the path length, this corresponds to 12 or 0.05 pc, which is roughly the diameter of the mini-cavity. If a nominal value of K for electron the temperature is assumed, then an average electron density of 1.6 cm-3 and total mass of 0.052 M⊙ for the highly disturbed ionized gas in the mini-cavity is determined.
3.2 Cometary Sources
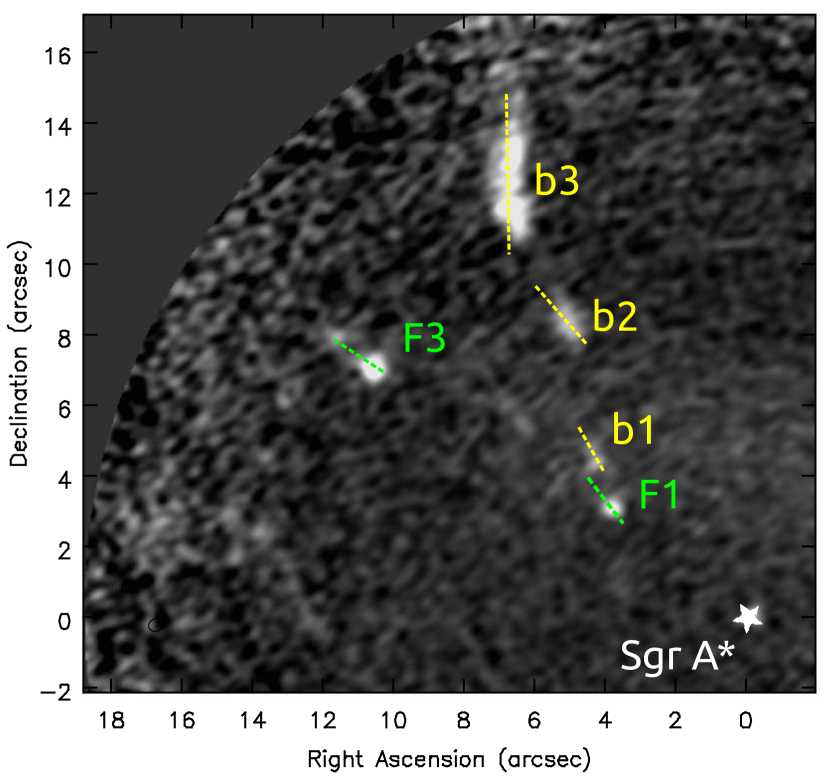
To the NE of Sgr A*, a number of previously detected cometary sources are detected in H30 RLs. Figure 6 is an integrated intensity map from 150 to 190 km s-1 with the detected cometary sources labeled in relation to Sgr A*. PV diagrams of the five sources can be found in Figures 7 and 8.
3.2.1 F Sources
F1 and F3 are known cometary sources pointed in the direction of Sgr A*. These cometary tails are associated with dusty stars that have been detected in the radio (Yusef-Zadeh et al., 2016). The PA (with respect to Sgr A*) of F1 and F3 (52∘ and 55∘ respectively) is similar to two other IR-identified cometary sources, X3 and X7, found to the SW of Sgr A* (Mužić et al., 2007, 2010) as well as the mini-cavity source C3 discussed in Section 3.1.3.
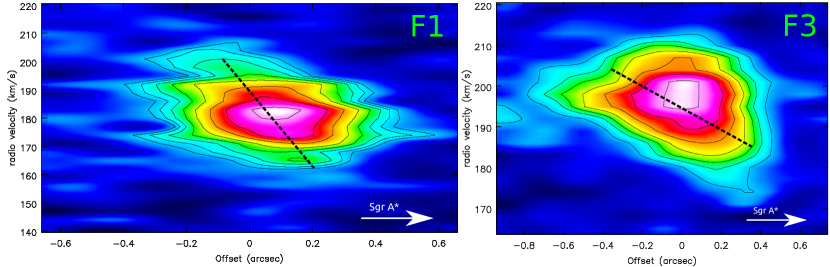
Radial velocities of these dusty sources are derived from their H30 emission and the parameters that characterize these sources are described in Table 1. Electron densities of cm-3 are determined if an electron temperature of K is assumed. The PV diagrams of F1 and F3 (Figure 7) show that the tail, pointed in the direction away from Sgr A*, is more red-shifted than the head of the source. Position angles of 36∘ and 55∘ were adopted for the PV slices of F1 and F3 respectively which matched the morphological orientation of the cometary sources in the -band data (Mužić et al., 2007). For the F1 cometary source, the kinematics vary from 179 km s-1 at the head to 187 km s-1 at the tail across an angular distance of 05. Similarly, F3 varies from 191 km s-1 to 198 km s-1 over 07.
3.2.2 b Sources
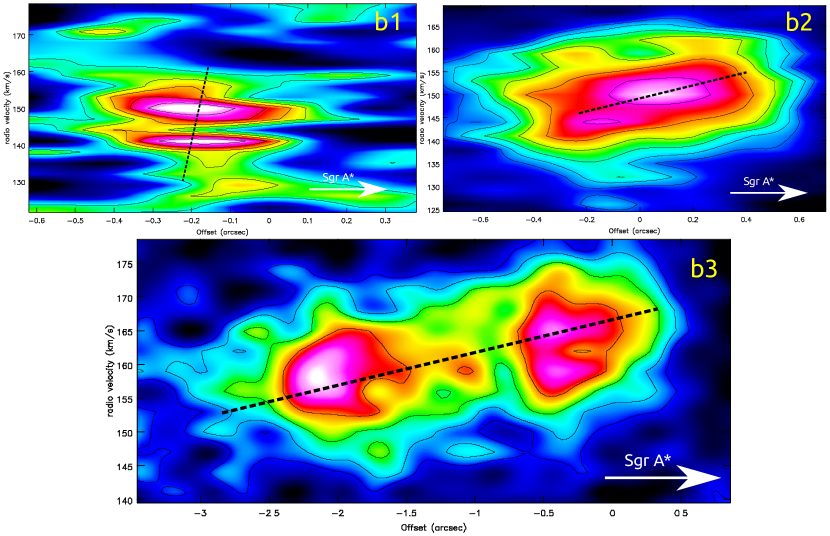
There are also a number of additional cometary sources seen in ionized gas, b1, b2 and b3 in Figure 6, that run nearly parallel to the N arm of the mini-spiral. The PV diagram of each can be found in 8. It is not clear if any of the b sources have stellar counterparts. The general velocity structure differs from that of the F sources which have a red-shifted tail. The overall direction is pointed towards Sgr A*, however the position angle of the head-tail structure does differ from F1 and F3, as they are rotated towards the direction of F1.
The first of the sources, b1, is separated from F1 by roughly 1.3 and is blue-shifted with respect to F1 with km s-1. The source is the weakest of the discussed cometary sources with a peak intensity of 2.92 mJy. Over an angular distance of 03 we find a shift in velocity of 6.6 km s-1 with a red-shifted tail, similar to the F sources.
The remaining two, b2 and b3, both have a velocity gradient with a red-shifted head. These appear to potentially be part of a coherent source distinct from the N arm whose kinematic structure opposes b2 and b3 (see Figure 1b). b2 is roughly 10 from Sgr A* with a central velocity of 152 km s-1. Elongated over an angular distance of 09 and ∘, b2 varies by 3.7 km s-1. b3 is found further to the north, 135 from Sgr A* and extended over 2 - 3 , coincident with the northwestern ridge of the N arm. A velocity gradient of 3.9 km s-1 arcsec-1 is measured.
4 Discussion
4.1 Unbound Mini-cavity
We have detected highly blue shifted ionized gas with radial velocities ranging between –480 and –300 km s-1. This gas is distributed in a region between 20 and 35 from Sgr A*. The high velocity features are partially resolved and are physically associated with the mini-cavity ridge with a 2 circular-shaped diameter. The mini-cavity is embedded within the ionized bar which is dominated by the orbital motion of the gas. Proper motion measurements of the eastern and western edges of the mini-cavity show transverse velocities moving southwest and west, respectively (Yusef-Zadeh et al., 1998; Zhao et al., 2009). In one study, the regions roughly coincident with the edges of the eastern and western walls of the mini-cavity show transverse velocities ranging between and km s-1 (Boxes 2 and 8 in Table 1 of Yusef-Zadeh et al., 1998).
More recent proper motion measurements by Zhao et al. (2009), with much improved signal-to-noise data, showed consistently high transverse velocities in the mini-cavity region. When combined with the high radial velocities of ionized gas detected here, the possibility of unbound components becomes likely. The ionized gas is gravitationally responding to a M⊙ central source, Sgr A*. Although a central stellar population could also contribute, the mass profile of the inner parsec is flat as derived from stellar kinematics (Fritz et al., 2016). Thus, the escape velocity at a projected distance of 0.09 pc (22) is then 620 km s-1. For C1 to be unbound then, it must have a transverse velocity km s-1. Note that the actual requirement is less as the true distance from Sgr A* likely exceeds the projected distance.
Alternatively C1 may be contained in an eccentric Keplerian orbit around Sgr A*, . If we make the assumption of an orbital inclination of , then km s-1 which requires an eccentricity of . However it should be noted that in addition to the assumption of zero transverse velocity, the orbit would also be at perihelion in this scenario.
As an example of proper motions, consider the K25 and K33 sources (see Table 2 of Zhao et al., 2009), which are 052 and 041 away from C1 (within one resolution element) with transverse velocities of 865 km s-1 and 313 km s-1 respectively. When added to the –455 km s-1 radial component of C1 we find a total velocity of 988 km s-1 and 552 km s-1 for K25 and K33 respectively. Thus, if we assume C1 has similar transverse velocities to these closest HII knots studied in Zhao et al. (2009) then C1 is unbound. In the case of C1 being coincident with K25, this would be true considering the projected distance alone.
The other mini-cavity sources (C2 and C3) have similar escape velocities of 500 and 540 km s-1 respectively at their projected distances. C3 is found adjacent (022 apart) to the K32 source of Zhao et al. (2009) with a reported transverse velocity of 656 km s-1, which already places it in the unbound regime. The K41 source of Zhao et al. (2009) is nearly coincident with C2 (013 away) and has a reported transverse velocity of 215 km s-1. When added to the measured C2 radial velocity a total velocity of 444 km s-1 is found. Thus, if the projected distance of C2 is the true distance, it is not necessarily unbound. However if a true distance of at least 0.18 pc is assumed (versus the projected distance of 0.14 pc), the velocity of the ionized gas would exceed the escape velocity. Such a true distance would require an inclination of 38∘ between Sgr A* and C2.
4.2 Origin of High Velocity Gas
Steiner et al. (2013) did not find any stellar sources with radial velocities similar to high velocity ionized gas. The large extent and multiple velocity components of blue-shifted gas are consistent with the picture that stars are not responsible for the origin of high velocity gas. The origin of high velocity gas is argued to be due to collisions between the gas of the N and E arms (Steiner et al., 2013; Zhao et al., 2009). However, the U-shaped morphology of the mini-cavity embedded in the bar is difficult to explain in this picture both spatially and kinematically. Both the N and E arms have velocities that are lower than than the high velocities that are reported here.
The new measurements show that the ionized bar is kinematically disturbed in the region traced by the minicavity ridge. Also, the highest ratio of [Feiii] to radio continuum in the inner 5′′ of Sgr A* coincides with the minicavity (Eckart et al., 1992; Lutz et al., 1993). This high ratio indicates that the gas is shocked and the [Feiii] line emission traces shock destruction of dust (Lutz et al., 1993). In addition, the high electron temperature, gas density, and unbound gas associated with the minicavity make this source unique in morphology, kinematics and thermodynamics. These measurements provide compelling evidence that the gas in the bar is tracing an interaction site due to a jet or wind-driven outflow from the direction of Sgr A*. The outflowing material is responsible for sweeping up the interstellar material, creating a cavity within the bar of ionized gas.
On a larger scale, the head-tail sources (e.g., F1 and F3) at position angles (PAs) of and , as well as a striking tower of nonthermal radio emission at PA (see Yusef-Zadeh et al., 2016) have also been argued to be the sites of an interaction with the atmosphere of dusty stars driven by a collimated outflow by winds or a jet from Sgr A*. In this picture, the acceleration of the tail to higher positive velocities constrain the geometry of the outflowing material, implying that the cometary sources lie on the far side of Sgr A*.
The picture we propose is similar to previous collimated outflow models argued in Yusef-Zadeh et al. (2012, 2016); Lutz et al. (1993) to explain the origin of highly blue-shifted gas. The collimated outflow is generated either by the winds of massive young stars (e.g. Paumard et al., 2006; Lu et al., 2009) distributed within 0.2 pc of Sgr A* or from Sgr A* itself. The model of a nuclear wind from a cluster of massive stars has to punch through the ionized bar and create the minicavity. This implies that the cluster wind has to be anisotropic. However, this scenario appears to be inconsistent with the jet proposed by Li et al. (2013) based on a linear X-ray feature that they detected. The X-ray jet candidate is asymmetric and oriented in the direction towards the Eastern arm, which is roughly perpendicular to the model discussed here.
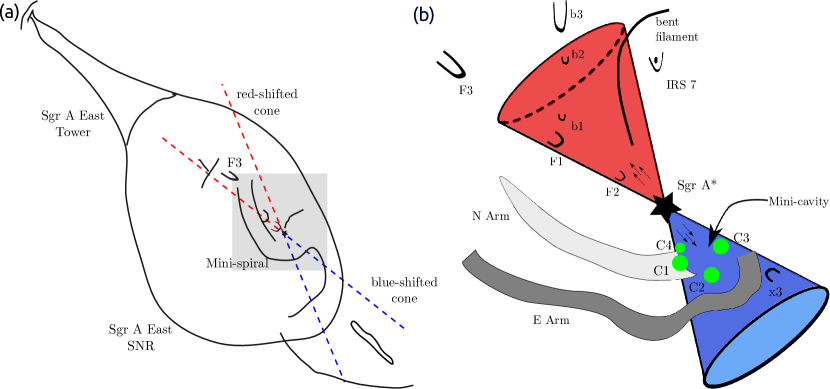
If the outflow originates from Sgr A*, the highly disturbed and blue-shifted gas is a result of a mildly relativistic jet symmetrically emanating from Sgr A*. The blue-shifted component of the jet is on the near-side of Sgr A* and punches through the orbiting gas in the ionized bar which results in the observed structure of the minicavity. This also places the ionized bar on the front side of Sgr A*. The far-side (red-shifted component) of the jet interacts with the atmosphere of dusty cometary sources toward Sgr A*, creating a more red-shifted tail in the direction of Sgr A*. We also consider the possibility that the far-side of the jet interacts with the Sgr A East supernova remnant and creates the Sgr A East tower, 150′′ away from Sgr A* with a PA (Yusef-Zadeh et al., 2016). In this picture, the Northern arm is aligned close to the plane of Sgr A* so that the interaction of the orbiting ionized gas of the mini-spiral and the jet only occurs on the near-side of Sgr A*. Such an alignment is consistent with previous RL studies using the Keplerian model (Zhao et al., 2009). A schematic diagram in Figure 9a shows the large-scale structures including the aforementioned Sgr A East tower. Smaller scale features are displayed in Figure 9b. The suggested symmetric jet driven outflow is colored in the schematic to illustrate the radial direction of flow for each side.
4.3 Mass Outflow Rate
We now quantify the mass outflow rate required to produce the mini-cavity. The blue-shifted ionized bar lies in the near-side of the plane of the sky before the jet accelerates the gas to more negative velocities. The change in the velocity of the gas due to this puncture is about 200 km s-1 over a projected angular distance of 1 (see Figure 3). If the total mass of the disturbed gas found in Section 3.1.4 as 0.052 M⊙ is utilized, then we can estimate the momentum deposition rate as 0.051 M⊙ year-1 km s-1. Adopting a Lorentz factor of for the mildly relativistic jet, a mass outflow rate of M⊙ year-1 would satisfy a jet origin for the mini-cavity.
Alternatively, if the outflow is driven by winds from massive stars, the required mass-loss rate is M⊙ yr-1 assuming a wind velocity of km s-1. The global wind accelerating C1 - C4 and creating the mini-cavity has to be anisotropic with a total mass loss rate much higher than estimated here.
The cometary sources can also be utilized to check for consistencies in a collimated outflow model with similar arguments as above. However, the change in velocity from the head to the tail over the angular distance (Section 3.2 and Table 1) is used to determine the force or momentum deposition rate imparted onto the cometary source that is moving within the candidate outflow. For the F sources a total mass of and M⊙ was found for F1 and F3 respectively.
Unlike the mini-cavity structure however, the cometary sources only subtend a small fraction of the collimated outflow since they are more than a few arcseconds from Sgr A*. We adopt an opening angle for this outflow of 30∘ determined by considering the position angle difference between C1 and C3. Similar cometary sources (X3 and X7) have been modeled by Mužić et al. (2010) where a size of a few hundred AU was determined for the bow shock standoff distance. Thus, a reasonable estimate to the upper limit of the cross sectional size of the mid-IR stellar source is 50 AU. These parameters yield total mass outflow rates of and M⊙ year-1 for a collimated jet. Whereas a wind driven outflow would have to drive M⊙ year-1.
Both b1 and b2 imply similar mass outflow rates as to the cometary sources. For a collimated jet, a mass outflow rate of and M⊙ year-1 is required if it is responsible for b1 and b2 respectively. On the other hand, b3 requires a much larger outflow rate of M⊙ and a highly unlikely wind mass loss rate of 0.02 M⊙ year-1. The larger estimates required for b3 are most likely due to its particularly elongated morphology. However, this most likely suggests b3 is not interacting with the proposed collimated outflow and is caused through different mechanisms.
4.4 Summary
Multiple highly blue-shifted disturbed features of ionized gas have been detected. The high velocity sources are associated with the mini-cavity within 2′′ of Sgr A*. In addition we found the kinematics of cometary sources pointing in the direction of Sgr A*. These measurements suggest a collimated outflow from Sgr A* or an outflowing nuclear wind, possibly produced by the young mass-losing stars near Sgr A*. A wind-driven outflow is unlikely to explain the origin of the mini-cavity and unbound ionized gas unless the outflow is anisotropic with a position angle of 50∘ (and 230∘) within 14 of Sgr A*. One implication of the outflowing material is the prevention of gaseous material falling into the accretion disk of Sgr A*, thus reducing the accretion rate. The proposed hypothesis for a jet from Sgr A* can be tested observationally in the future by searching for linearly polarized emission associated with Sgr A* at radio and submm wavelengths. In addition, future high resolution proper motion measurements of C1-C4 towards the mini-cavity combined with radial velocity measurements will help determine if they are unbound.
| , (J2000)† | Offset† | PA† | Size | SL | Length | |||||
|---|---|---|---|---|---|---|---|---|---|---|
| Source | (arcsec) | (arcsec) | (deg) | (mas) | (mJy) | (km s-1) | (km s-1) | ( cm-3) | (arcsec) | (km s-1) |
| C1 | –0.68, –2.06 | 2.17 | –163 | 320 | 2.06 | –455 | 37.0 | 3.39 - 4.97 | ||
| 2.24 | –419 | 33.1 | ||||||||
| 2.92 | –372 | 89.0 | ||||||||
| C2 | –1.44, –3.11 | 3.43 | –155 | 180 | 3.21 | –388 | 41.1 | 2.99 - 4.39 | ||
| 1.28 | –329 | 37.9 | ||||||||
| C3 | –1.99, –1.96 | 2.80 | –135 | 420⋆ | 4.51 | –381 | 35.7 | 1.85 - 2.72 | ||
| C4 | –0.99, –1.72 | 1.99 | –149 | 390⋆ | 2.01 | –366 | 40.0 | 1.36 - 1.99 | ||
| F1 | +3.89, +3.07 | 4.95 | 51.7 | 390⋆ | 6.42 | 181 | 26.4 | 1.97 - 2.89 | 0.5 | 8 |
| F3 | +10.7, +7.08 | 12.8 | 56.5 | 580 | 11.8 | 196 | 22.1 | 2.01 - 2.94 | 0.7 | 6.7 |
| b1 | +4.29, +4.42 | 6.16 | 35.7 | 480 | 2.92 | 166 | 31.0 | 1.30 - 1.91 | 0.3 | 6.6 |
| b2 | +5.04, +8.20 | 9.63 | 31.6 | 530 | 7.09 | 152 | 25.6 | 1.75 - 2.57 | 0.69 | 3.67 |
| b3 | +6.76, +11.7 | 13.5 | 30.0 | 930 | 10.4 | 164 | 22.9 | 1.51- 2.22 | 2.1 | 8.2 |
Note. — With respect to Sgr A* ().
Assuming electron temperatures ranging from 7.5 K - 12.5 K.
⋆ Unresolved, given size is an upper limit convolved with the beam.
References
- Becker et al. (2011) Becker, P. A., Das, S., & Le, T. 2011, ApJ, 743, 47
- Bradford et al. (2005) Bradford, C. M., Stacey, G. J., Nikola, T., et al. 2005, ApJ, 623, 866
- Christopher et al. (2005) Christopher, M. H., Scoville, N. Z., Stolovy, S. R., & Yun, M. S. 2005, ApJ, 622, 346
- Das et al. (2009) Das, S., Becker, P. A., & Le, T. 2009, ApJ, 702, 649
- Eckart et al. (1992) Eckart, A., Genzel, R., Krabbe, A., et al. 1992, Nature, 355, 526
- Ekers et al. (1983) Ekers, R. D., van Gorkom, J. H., Schwarz, U. J., & Goss, W. M. 1983, A&A, 122, 143
- Falcke & Markoff (2000) Falcke, H., & Markoff, S. 2000, A&A, 362, 113
- Fritz et al. (2016) Fritz, T. K., Chatzopoulos, S., Gerhard, O., et al. 2016, ApJ, 821, 44
- Ghez et al. (2005) Ghez, A. M., Salim, S., Hornstein, S. D., et al. 2005, ApJ, 620, 744
- Gillessen et al. (2009) Gillessen, S., Eisenhauer, F., Trippe, S., et al. 2009, ApJ, 692, 1075
- Guesten et al. (1987) Guesten, R., Genzel, R., Wright, M. C. H., et al. 1987, ApJ, 318, 124
- Herbst et al. (1993) Herbst, T. M., Beckwith, S. V. W., Forrest, W. J., & Pipher, J. L. 1993, AJ, 105, 956
- Herrnstein et al. (2005) Herrnstein, J. R., Moran, J. M., Greenhill, L. J., & Trotter, A. S. 2005, ApJ, 629, 719
- Irons et al. (2012) Irons, W. T., Lacy, J. H., & Richter, M. J. 2012, ApJ, 755, 90
- Jackson et al. (1993) Jackson, J. M., Geis, N., Genzel, R., et al. 1993, ApJ, 402, 173
- Krabbe et al. (1995) Krabbe, A., Genzel, R., Eckart, A., et al. 1995, ApJ, 447, L95
- Lacy et al. (1991) Lacy, J. H., Achtermann, J. M., & Serabyn, E. 1991, ApJ, 380, L71
- Latvakoski et al. (1999) Latvakoski, H. M., Stacey, G. J., Gull, G. E., & Hayward, T. L. 1999, ApJ, 511, 761
- Lebofsky et al. (1982) Lebofsky, M. J., Rieke, G. H., & Tokunaga, A. T. 1982, ApJ, 263, 736
- Li et al. (2013) Li, Z., Morris, M. R., & Baganoff, F. K. 2013, ApJ, 779, 154
- Lo & Claussen (1983) Lo, K. Y., & Claussen, M. J. 1983, Nature, 306, 647
- Lu et al. (2009) Lu, J. R., Ghez, A. M., Hornstein, S. D., et al. 2009, ApJ, 690, 1463
- Lutz et al. (1993) Lutz, D., Krabbe, A., & Genzel, R. 1993, ApJ, 418, 244
- Marshall et al. (1995) Marshall, J., Lasenby, A. N., & Harris, A. I. 1995, MNRAS, 277, 594
- McMullin et al. (2007) McMullin, J. P., Waters, B., Schiebel, D., Young, W., & Golap, K. 2007, in Astronomical Society of the Pacific Conference Series, Vol. 376, Astronomical Data Analysis Software and Systems XVI, ed. R. A. Shaw, F. Hill, & D. J. Bell, 127
- Mužić et al. (2010) Mužić, K., Eckart, A., Schödel, R., et al. 2010, A&A, 521, A13
- Mužić et al. (2007) Mužić, K., Eckart, A., Schödel, R., Meyer, L., & Zensus, A. 2007, A&A, 469, 993
- Paumard et al. (2006) Paumard, T., Genzel, R., Martins, F., et al. 2006, ApJ, 643, 1011
- Quataert (2004) Quataert, E. 2004, ApJ, 613, 322
- Reid & Brunthaler (2004) Reid, M. J., & Brunthaler, A. 2004, ApJ, 616, 872
- Roberts & Goss (1993) Roberts, D. A., & Goss, W. M. 1993, ApJS, 86, 133
- Roberts et al. (1996) Roberts, D. A., Yusef-Zadeh, F., & Goss, W. M. 1996, ApJ, 459, 627
- Serabyn et al. (1991) Serabyn, E., Lacy, J. H., & Achtermann, J. M. 1991, ApJ, 378, 557
- Shcherbakov & Baganoff (2010) Shcherbakov, R. V., & Baganoff, F. K. 2010, ApJ, 716, 504
- Steiner et al. (2013) Steiner, J. E., Menezes, R. B., & Amorim, D. 2013, MNRAS, 431, 2789
- Tsuboi et al. (2017a) Tsuboi, M., Kitamura, Y., Tsutsumi, T., et al. 2017a, ApJ, 850, L5
- Tsuboi et al. (2017b) Tsuboi, M., Kitamura, Y., Uehara, K., et al. 2017b, ApJ, 842, 94
- Wang et al. (2013) Wang, Q. D., Nowak, M. A., Markoff, S. B., et al. 2013, Science, 341, 981
- Wilson et al. (2012) Wilson, T. L., Rohlfs, K., & Huttemeister, S. 2012, Tools of Radio Astronomy, 5th edition
- Wollman et al. (1982) Wollman, E. R., Smith, H. A., & Larson, H. P. 1982, ApJ, 258, 506
- Yuan et al. (2004) Yuan, F., Quataert, E., & Narayan, R. 2004, ApJ, 606, 894
- Yusef-Zadeh & Morris (1991) Yusef-Zadeh, F., & Morris, M. 1991, ApJ, 371, L59
- Yusef-Zadeh et al. (1990) Yusef-Zadeh, F., Morris, M., & Ekers, R. D. 1990, Nature, 348, 45
- Yusef-Zadeh et al. (1998) Yusef-Zadeh, F., Roberts, D. A., & Biretta, J. 1998, ApJ, 499, L159
- Yusef-Zadeh et al. (2016) Yusef-Zadeh, F., Wardle, M., Schödel, R., et al. 2016, ApJ, 819, 60
- Yusef-Zadeh et al. (2012) Yusef-Zadeh, F., Arendt, R., Bushouse, H., et al. 2012, ApJ, 758, L11
- Zhao et al. (2010) Zhao, J.-H., Blundell, R., Moran, J. M., et al. 2010, ApJ, 723, 1097
- Zhao et al. (2009) Zhao, J.-H., Morris, M. R., Goss, W. M., & An, T. 2009, ApJ, 699, 186