Organic molecular tuning of many-body interaction energies in air-suspended carbon nanotubes
Abstract
We investigate adsorption effects of copper phthalocyanine molecules on excitons and trions in air-suspended carbon nanotubes. Using photoluminescence excitation spectroscopy, we observe that exciton energy redshifts gradually with the molecular deposition thickness. The trion emission is also observed at large deposition amounts, which indicates charge transfer between the phthalocyanine molecules and carbon nanotubes. Analysis of the spectra for individual tubes reveal a correlation between the exciton-trion energy separation and the exciton emission energy, showing that the many-body interaction energies scale similarly with the molecular dielectric screening.
Single-walled carbon nanotubes (CNTs) have attracted considerable attention due to their remarkable physical and electronic properties, and much effort has been devoted to functionalize CNTs for expanding their capabilities Hirsch (2002); Miyauchi et al. (2013); He et al. (2017); Guldi et al. (2005). In particular, non-covalent functionalization with organic molecules is a powerful strategy for developing CNT based devices such as photovoltaics and photodetectors Ehli et al. (2009); Malic et al. (2011); Bartelmess et al. (2010); Hecht et al. (2006); Alam et al. (2017). The interactions between the organic molecules and CNTs are considered to be less perturbative compared to covalent modification, and therefore the outstanding properties of CNTs can be preserved. Organic molecules such as porphyrin and phthalocyanine couple to nanotubes through - interactions to modify the charge density of CNTs, while the emission energy is reduced due to the molecular screening Roquelet et al. (2010); Correa and Orellana (2012); Orellana (2014); Garrot et al. (2011). Furthermore, there are unique exciton dynamics at the organic molecule/CNT interface including energy and charge transfer Garrot et al. (2011); Casey et al. (2008); Zhong et al. (2013); Sarkar et al. (2018); Stranks et al. (2011).
In the measurements performed for nanotubes in solutions, however, the existence of solvent molecules inevitably complicate the interpretation by influencing the interactions. Additionally, the solvents themselves provide molecular screening, reducing the dielectric effects of the organic molecules. Investigation of molecular adsorption on air-suspended nanotubes would provide invaluable information towards fundamental understanding of the adsorption effects, as thermal evaporation techniques Lozzi et al. (2008); Basiuk et al. (2018) allow for molecular deposition without introducing other molecules. The use of pristine tubes should further enable drastic dielectric modification for developing non-covalently functionalized CNT devices.
Here, we demonstrate control over many-body interaction energies in air-suspended carbon nanotubes by copper phthalocyanine (CuPc) molecule adsorption. The molecules are deposited on chirality-assigned CNTs by thermal evaporation, and we perform photoluminescence (PL) spectroscopy of the CuPc/CNT hybrid. From the averaged PL and PL excitation (PLE) spectra for various chiralities, we find that the and resonances redshift with increasing deposition thickness. Furthermore, a new emission peak is observed at an energy below the peak, which is attributed to trion emission. Data from individual tubes reveal a good correlation between exciton-trion energy separation and the energy, suggesting the existence of a universal relationship. We consider a model assuming power law scaling of the interaction energies with dielectric constant to explain the observed correlation.
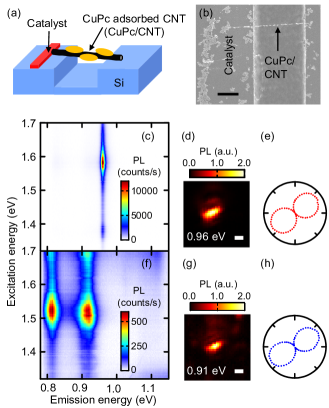
Our suspended CNTs are grown over trenches on bare Si substrates [Fig. 1(a)]. We perform electron beam lithography and dry etching to form the trenches, and another electron beam lithography step defines catalyst areas near the trenches. Fe(III) acetylacetonate and fumed silica dispersed in ethanol are spin coated as catalyst for CNT growth. CNTs are synthesized by alcohol chemical vapor deposition at 800∘C for 1 minute Ishii et al. (2015).
We characterize the suspended nanotubes with a home-built sample scanning microspectroscopy system Ishii et al. (2015). A wavelength tunable Ti:sapphire laser is used for excitation, and the laser polarization is rotated using a half-wave plate. The beam with a power is focused onto the nanotube by an objective lens, which is also used to collect the PL from the nanotubes. The PL signal is detected by an InGaAs photodiode array detector attached to a spectrometer. For PLE maps and PL images, the laser polarization is parallel to the tube axis, and all measurements are conducted at room temperature in dry nitrogen.
Carbon nanotubes are located by line scans along the trenches, and PLE measurements are performed. We check whether only a single peak is observed in the emission spectrum and whether the and resonance energies match tabulated data for air-suspended nanotubes Ishii et al. (2015). If a nanotube satisfies these conditions, the position and the chirality for the nanotube is recorded into a list for further measurements.
After the characterization, the sample is placed in a vacuum chamber for evaporation of CuPc (Sigma-Aldrich) and is kept at about 80∘C for ten minutes to remove air molecules before the evaporation. CuPc molecules are deposited on suspended CNTs in the chamber at room temperature using an evaporator heated to 480–520∘C under a vacuum of less than 10-4 Pa. A glass slide is also placed in the chamber to quantify the deposition thickness from absorbance of CuPc peak at 2.0 eV Tang (1986). Calibration is performed by measuring the actual thickness by a surface profiler for two of the films. Four samples with different deposition amounts are prepared by changing the evaporation time, with nominal thickness on the substrate of 3 nm, 7 nm, 16 nm, and 26 nm. A scanning electron microscope image of a typical CNT after the evaporation is shown in Fig. 1(b). Bright spots are observed sparsely on the suspended CNTs, indicating inhomogeneous adsorption of CuPc.
In order to investigate the molecular adsorption effects, we characterize the nanotubes after the deposition. We compare PL spectra, PL images, and polarization dependence for a suspended CNT before and after CuPc deposition for the 26 nm sample [Figs. 1(c)–(h)]. In the PLE map before the deposition [Fig. 1(c)], the emission occurs at the energy and the transition can be observed as a resonance in the excitation energy. The values for the and resonances are consistent with those for a (9,7) air-suspended nanotube Ishii et al. (2015), indicating that air-molecules such as water are adsorbed Uda et al. (2018); Lefebvre and Finnie (2008). Figure 1(f) shows a PLE map of the same tube after the deposition, and we find differences in the peak energy, the line width, and the intensity. Both of the and resonances show redshift as well as broadening, and the PL intensity decreases significantly with the molecular adsorption. Additionally, a new emission band appears in an energy region below the emission. The PL image of the molecular adsorbed nanotube is slightly smaller compared to that before the evaporation [Figs. 1(g),(d)], which is likely due to the inhomogeneous adsorption as observed in Fig. 1(b). In comparison, the laser polarization dependence does not change before and after the deposition [Figs. 1(e),(h)].
The PLE maps of the nanotubes for the four samples are measured to examine the deposition amount dependence of the adsorption effects. We integrate the PLE maps for each nanotube along the excitation and emission energy axes to obtain PL and PLE spectra, respectively, and the spectra for nanotubes with the same chiralities are averaged within each sample. The ensemble averaged PL and PLE spectra for (9,7) tubes are shown in Figs. 2(a) and 2(b), respectively. In the PL spectra [Fig. 2(a)], the intensity decreases and the resonance energy redshifts with the increase of the deposition thickness. Two peaks are observed for the 3 nm sample, corresponding to emission from regions of nanotubes with and without the CuPc molecule adsorption. At large deposition amounts, the new emission band is observed as in Fig. 1(f). We will refer to this peak as the emission, whose intensity does not seem to depend much on the amount of CuPc molecules. In the PLE spectra [Fig. 2(b)], the resonance also redshifts with increasing deposition thickness, and the simultaneous redshifts for the and resonances can be explained by the molecular dielectric screening Larsen et al. (2012); Lefebvre and Finnie (2008). For the 26 nm sample, the resonance peak is on top of a broad background slope, which may be attributed to the tail of the CuPc absorption peak at 2.0 eV Tang (1986). Exciton transfer from CuPc aggregates to CNTs would be consistent with the appearance of the absorption tail in the PLE spectra Casey et al. (2008); Roquelet et al. (2010).
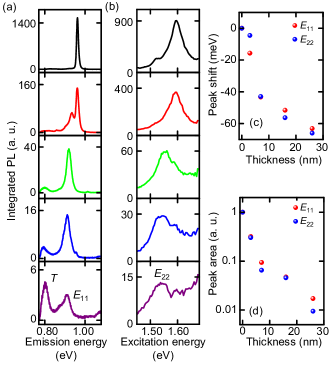
To evaluate the and resonance shifts for each sample, we extract the peak positions by fitting the ensemble averaged PL and PLE spectra. A Lorentz function is used to fit the resonance in the PL spectra, except for the 3 nm sample where two Lorentz functions are used to obtain a weighted average of the emission energy. In the case of the PLE spectra, we extract the resonance energy by fitting with a Lorentzian on top of a linear function. In Fig. 2(c), we plot the energy shifts of the and resonances for (9,7) nanotubes relative to the energies before the evaporation. They show similar behavior, and the energies decrease monotonically with the deposition thickness. The energy shifts by more than 60 meV, which is considerably larger than the shift caused by organic molecule adsorption in solutions ( meV) Roquelet et al. (2010); Garrot et al. (2011). The peak areas obtained from the fitting are also shown in Fig. 2(d), drastically decreasing as the thickness increases. A possible cause for the intensity reduction is carrier-induced PL quenchingYasukochi et al. (2011); Yoshida et al. (2016); Uda et al. (2018) as charge transfer between a metal-phthalocyanine and a CNT has been predicted by a density functional calculation Correa and Orellana (2012).
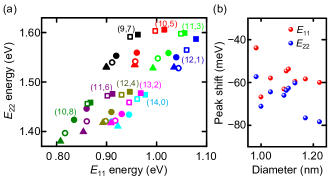
Using the same analysis procedure, the and resonance energies for various chiralities are obtained [Fig. 3(a)]. Redshifts of both resonances are observed for all chiralities measured, consistent with the dielectric screening effects due to the adsorbed molecules. The molecule-induced shifts of the and resonances for the 26 nm sample are plotted as a function of nanotube diameter in Fig. 3(b). Although we expect that the shifts become gradually smaller as the diameter increases Schuettfort et al. (2009); Larsen et al. (2012); Choi and Strano (2007), there is no clear dependence. The scatter of the data points is likely caused by large tube-to-tube deviations of adsorption amounts. Averaging the shifts of the and resonances for all chiralities, we obtain values of meV and meV, respectively. Comparable emission energy shifts have been observed for nanotubes under dielectric screening by solvents Ohno et al. (2007); Larsen et al. (2012), explaining why the shifts due to organic molecule adsorption in solutions are suppressed.
We evaluate the change in the exciton resonance energy by considering the reduction of the electronic many-body interactions due to molecular adsorption. The exciton energy is determined by , where is the single-particle bandgap, is the self-energy from repulsive electron interactions, and is the exciton binding energy from the attractive electron-hole interactions Walsh et al. (2007); Miyauchi et al. (2015). Because the magnitude of the self-energy is larger than that of the exciton binding energy, the exciton energy is higher than by the net many-body correlation energy . Assuming that these interactions scale by the same factor , the shift of the exciton energy relative to the air-molecule-adsorbed state is given by . For air-molecule adsorbed nanotubes with 1-nm diameter, and have been estimated to be 910 meV and 660 meV, respectively Lefebvre and Finnie (2008). From the average of meV for the 26 nm sample, is calculated to be 0.77, which corresponds to a reduction of the many-body interactions with the molecular adsorption by 23%. The average is slightly larger than the average , which is reasonable because the net many-body correlation energy for the excitons is larger than that for the excitons Larsen et al. (2012); Sato et al. (2007).
We now turn our attention to the low energy emission. Figure 4(a) is a PLE map for a (9,7) nanotube in the 26 nm sample, and there are two peaks at 0.81 eV and 0.92 eV corresponding to the and emission, respectively. The absorption resonance energies for both emission are almost the same, and the PL images at the and energies overlap spatially [Figs. 4(b),(c)]. The spectral and spatial coincidence indicates that the emission comes from the same tube. We define the energy separation between the and peaks to be , for example eV in Fig. 4(a). The emission energy for various chiralites are obtained by fitting the ensemble averaged PL spectra with a Lorentz function, and is plotted as a function of the diameter in Fig. 4(d). Since the -momentum exciton emission should appear at 0.13–0.14 eV below the emission peak Matsunaga et al. (2010); Yoshida et al. (2016), it cannot explain the emission with –0.12 eV. In addition, intensity of the -momentum exciton emission is typically 1% of the bright exciton emission Yoshida et al. (2016), but the emission intensity can be comparable to the emission Yoshida et al. (2016). A more plausible interpretation would be emission from trions, as the energy separation can be 0.10–0.14 eV under dielectric screening within the diameter range shown in Fig. 4(d) Matsunaga et al. (2011); Santos et al. (2011). The observed tends to become smaller as the diameter increases, consistent with the behavior for the exciton-trion energy separation Yoshida et al. (2016); Uda et al. (2018). As a trion is a bound state of a carrier and an exciton Matsunaga et al. (2011), we expect trion formation if there is charge transfer between CuPc molecules and CNTs. Such a picture can also explain the intensity reduction with the molecular adsorption.
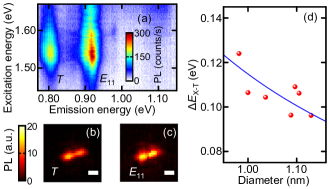
The exciton-trion energy separation for the CuPc adsorbed state is smaller than that for the air molecule adsorbed state by about 70 meV for tubes with diameter 1 nm, indicating that exciton-carrier interactions are considerably screened by the CuPc molecules. It is known that the exciton-trion energy separation follows the relation , where is the trion binding energy and is the singlet-triplet splitting energy while and are proportionality constants Matsunaga et al. (2011); Yoshida et al. (2016). For the air molecule adsorbed state, meV nm and meV nm2 Yoshida et al. (2016). We fit the data by , under an assumption that both and scale by the same factor upon the organic molecule adsorption. The result is shown as a blue line in Fig. 4(d), giving , which is comparable to the value of .
So far we have been discussing the ensemble spectra, but data for the individual tubes provide additional insights to molecular screening effects on the many-body interactions. By fitting the PL spectra for each nanotube, we obtain the energies for the and emission in various molecular screening environments. In Fig. 5(a), for (9,7) individual nanotubes are plotted as a function of the exciton emission energy. We find that there is a good correlation between and , where becomes smaller as the emission energy redshifts. We also plot data points for (9,7) suspended nanotubes with and without air-molecule adsorption from ref 22 as green and blue points, respectively. These data points also follow the trend, suggesting that there is a universal relation applicable to nanotubes under different surface conditions. Similar correlation is observed for (13,2) and (11,3) nanotubes [Figs. 5(b) and 5(c), respectively], as well as for the other chiralities. We note that CuPc adsorption can shift the energy by meV compared to the pritine state, offering flexible tunability over the emission energy
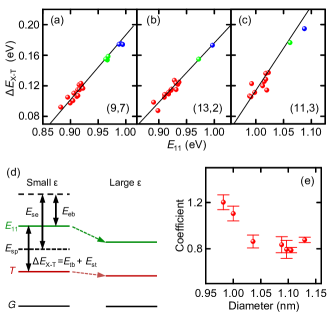
The correlation can be understood in terms of the molecular dielectric screening [Fig. 5(d)]. In general, the many-body interactions determining the and exciton energies are sensitive to environment, which can simply be parameterized as the environmental dielectric constant . Assuming that interaction energies scale as with being a constant Walsh et al. (2007); Lefebvre and Finnie (2008), and , where , , , and are the trion binding energy, singlet-triplet splitting energy, self energy, and exciton binding energy at , respectively. The slope for the correlation is then given by , indicating a linear relation between and . The experimentally observed correlation therefore implies that the many-body interactions energies scale similarly within the experimental conditions explored, which is reasonable since the scaling factor for the exciton is comparable to that for the trion .
Using the reported values for pristine suspended nanotubes of meV, meV, meV, and meV for 1 nm-diameter tubes Lefebvre and Finnie (2008); Uda et al. (2018), the proportionality coefficient is about 0.8. To compare this value with the experimental results, we fit the data points for the organic molecule adsorbed state with a linear function. We impose the line to go through a data point for the air-molecule adsorbed state, where the emission energy is obtained from the table in ref 20 and is determined from the equation given in ref 26. The obtained coefficients range from 0.8 to 1.2 [Fig. 5(e)], which is a reasonable agreement considering the large uncertainty in the absolute value of .
In summary, we have investigated adsorption effects of CuPc molecules on excitons and trions in air-suspended CNTs by measuring PL spectra of the CuPc/CNT hybrids. By averaging the PLE spectra for tubes with the same chiralities, the redshift of the and resonances have been observed with increasing deposition thickness due to the molecular screening. The energy modification from the pristine state to the CuPc adsorbed state can reach 100 meV, which is significantly larger than the energy shift with organic molecule adsorption in solutions. Furthermore, we find that the trion emission emerges at an energy lower than the exciton emission, which is likely due to charge transfer between CuPc molecules and CNTs. The spectra from individual tubes show that there is a good correlation between the exciton-trion energy separation and the exciton emission energy. A model assuming power law scaling of the many-body interactions with dielectric constant can quantitatively explain the observed correlation, which should be able to describe nanotubes with different surface conditions in a universal manner. Our findings show that organic molecule adsorption significantly affects many-body interaction energies of suspended CNTs, which opens up a pathway to CNT devices utilizing noncovalent molecular functionalization.
Acknowledgements.
Work supported in part by JSPS (KAKENHI JP16H05962 and JP17H07359) and MEXT (Photon Frontier Network Program, Nanotechnology Platform). We thank Advanced Manufacturing Support Team at RIKEN for technical assistance.References
- Hirsch (2002) A. Hirsch, Functionalization of single-walled carbon nanotubes, Angew. Chem. Int. Ed. 41, 1853 (2002).
- Miyauchi et al. (2013) Y. Miyauchi, M. Iwamura, S. Mouri, T. Kawazoe, M. Ohtsu, and K. Matsuda, Brightening of excitons in carbon nanotubes on dimensionality modification, Nat. Photon. 7, 715 (2013).
- He et al. (2017) X. He, N. F. Hartmann, X. Ma, Y. Kim, R. Ihly, J. L. Blackburn, W. Gao, J. Kono, Y. Yomogida, A. Hirano, T. Tanaka, H. Kataura, H. Htoon, and S. K. Doorn, Tunable room-temperature single-photon emission at telecom wavelengths from defects in carbon nanotubes, Nat. Photon. 11, 577 (2017).
- Guldi et al. (2005) D. M. Guldi, G. M. A. Rahman, F. Zerbetto, and M. Prato, Carbon nanotubes in electron donor-acceptor nanocomposites, Acc. Chem. Res. 38, 871 (2005).
- Ehli et al. (2009) C. Ehli, C. Oelsner, D. M. Guldi, A. Mateo-Alonso, M. Prato, C. Schmidt, C. Backes, F. Hauke, and A. Hirsch, Manipulating single-wall carbon nanotubes by chemical doping and charge transfer with perylene dyes, Nat. Chem. 1, 243 (2009).
- Malic et al. (2011) E. Malic, C. Weber, M. Richter, V. Atalla, T. Klamroth, P. Saalfrank, S. Reich, and A. Knorr, Microscopic model of the optical absorption of carbon nanotubes functionalized with molecular spiropyran photoswitches, Phys. Rev. Lett. 106, 097401 (2011).
- Bartelmess et al. (2010) J. Bartelmess, B. Ballesteros, G. de la Torre, D. Kiessling, S. Campidelli, M. Prato, T. Torres, and D. M. Guldi, Phthalocyanine-pyrene conjugates: A powerful approach toward carbon nanotube solar cells, J. Am. Chem. Soc. 132, 16202 (2010).
- Hecht et al. (2006) D. S. Hecht, R. J. A. Ramirez, M. Briman, E. Artukovic, K. S. Chichak, J. F. Stoddart, and G. Grüner, Bioinspired detection of light using a porphyrin-sensitized single-wall nanotube field effect transistor, Nano Lett. 6, 2031 (2006).
- Alam et al. (2017) A. Alam, S. Dehm, F. Hennrich, Y. Zakharko, A. Graf, M. Pfohl, I. M. Hossain, M. M. Kappes, J. Zaumseil, R. Krupke, and B. S. Flavel, Photocurrent spectroscopy of dye-sensitized carbon nanotubes, Nanoscale 9, 11205 (2017).
- Roquelet et al. (2010) C. Roquelet, D. Garrot, J. S. Lauret, C. Voisin, V. Alain-Rizzo, P. Roussignol, J. A. Delaire, and E. Deleporte, Quantum efficiency of energy transfer in noncovalent carbon nanotube/porphyrin compounds, Appl. Phys. Lett. 97, 141918 (2010).
- Correa and Orellana (2012) J. D. Correa and W. Orellana, Optical response of carbon nanotubes functionalized with (free-base, zn) porphyrins, and phthalocyanines: A dft study, Phys. Rev. B 86, 125417 (2012).
- Orellana (2014) W. Orellana, Strong - interaction of porphyrins on (6,5) carbon nanotubes with full surface coverage: Ab-initio calculations, Appl. Phys. Lett. 105, 023110 (2014).
- Garrot et al. (2011) D. Garrot, B. Langlois, C. Roquelet, T. Michel, P. Roussignol, C. Delalande, E. Deleporte, J. S. Lauret, and C. Voisin, Time-resolved investigation of excitation energy transfer in carbon nanotube-porphyrin compounds, J. Phys. Chem. C 115, 23283 (2011).
- Casey et al. (2008) J. P. Casey, S. M. Bachilo, and R. B. Weisman, Efficient photosensitized energy transfer and near-ir fluorescence from porphyrin-swnt complexes, J. Mater. Chem. 18, 1510 (2008).
- Zhong et al. (2013) Q. Zhong, V. V. Diev, S. T. Roberts, P. D. Antunez, R. L. Brutchey, S. E. Bradforth, and M. E. Thompson, Fused porphyrin-single-walled carbon nanotube hybrids: Efficient formation and photophysical characterization, ACS Nano 7, 3466 (2013).
- Sarkar et al. (2018) R. Sarkar, M. Habib, S. Pal, and O. V. Prezhdo, Ultrafast, asymmetric charge transfer and slow charge recombination in porphyrin/cnt composites demonstrated by time-domain atomistic simulation, Nanoscale 10, 12683 (2018).
- Stranks et al. (2011) S. D. Stranks, J. K. Sprafke, H. L. Anderson, and R. J. Nicholas, Electronic and mechanical modification of single-walled carbon nanotubes by binding to porphyrin oligomers, ACS Nano 5, 2307 (2011).
- Lozzi et al. (2008) L. Lozzi, S. Santucci, F. Bussolotti, and S. La Rosa, Investigation on copper phthalocyanine/multiwalled carbon nanotube interface, J. Appl. Phys. 104, 033701 (2008).
- Basiuk et al. (2018) V. A. Basiuk, L. J. Flores-Sánchez, V. Meza-Laguna, J. O. Flores-Flores, L. Bucio-Galindo, I. Puente-Lee, and E. V. Basiuk, Noncovalent functionalization of pristine cvd single-walled carbon nanotubes with 3d metal(ii) phthalocyanines by adsorption from the gas phase, Appl. Surf. Sci. 436, 1123 (2018).
- Ishii et al. (2015) A. Ishii, M. Yoshida, and Y. K. Kato, Exciton diffusion, end quenching, and exciton-exciton annihilation in individual air-suspended carbon nanotubes, Phys. Rev. B 91, 125427 (2015).
- Tang (1986) C. W. Tang, Two-layer organic photovoltaic cell, Appl. Phys. Lett. 48, 183 (1986).
- Uda et al. (2018) T. Uda, S. Tanaka, and Y. K. Kato, Molecular screening effects on exciton-carrier interactions in suspended carbon nanotubes, Appl. Phys. Lett. 113, 121105 (2018).
- Lefebvre and Finnie (2008) J. Lefebvre and P. Finnie, Excited excitonic states in single-walled carbon nanotubes, Nano Lett. 8, 1890 (2008).
- Larsen et al. (2012) B. A. Larsen, P. Deria, J. M. Holt, I. N. Stanton, M. J. Heben, M. J. Therien, and J. L. Blackburn, Effect of solvent polarity and electrophilicity on quantum yields and solvatochromic shifts of single-walled carbon nanotube photoluminescence, J. Am. Chem. Soc. 134, 12485 (2012).
- Yasukochi et al. (2011) S. Yasukochi, T. Murai, S. Moritsubo, T. Shimada, S. Chiashi, S. Maruyama, and Y. K. Kato, Gate-induced blueshift and quenching of photoluminescence in suspended single-walled carbon nanotubes, Phys. Rev. B 84, 121409(R) (2011).
- Yoshida et al. (2016) M. Yoshida, A. Popert, and Y. K. Kato, Gate-voltage induced trions in suspended carbon nanotubes, Phys. Rev. B 93, 041402(R) (2016).
- Schuettfort et al. (2009) T. Schuettfort, A. Nish, and R. J. Nicholas, Observation of a type ii heterojunction in a highly ordered polymer-carbon nanotube nanohybrid structure, Nano Lett. 9, 3871 (2009).
- Choi and Strano (2007) J. H. Choi and M. S. Strano, Solvatochromism in single-walled carbon nanotubes, Appl. Phys. Lett. 90, 223114 (2007).
- Ohno et al. (2007) Y. Ohno, S. Iwasaki, Y. Murakami, S. Kishimoto, S. Maruyama, and T. Mizutani, Excitonic transition energies in single-walled carbon nanotubes: Dependence on environmental dielectric constant, Phys. Status Solidi B 244, 4002 (2007).
- Walsh et al. (2007) A. G. Walsh, A. N. Vamivakas, Y. Yin, S. B. Cronin, M. S. Ünlü, B. B. Goldberg, and A. K. Swan, Screening of excitons in single, suspended carbon nanotubes, Nano Lett. 7, 1485 (2007).
- Miyauchi et al. (2015) Y. Miyauchi, Z. Zhang, M. Takekoshi, Y. Tomio, H. Suzuura, V. Perebeinos, V. V. Deshpande, C. Lu, S. Berciaud, P. Kim, J. Hone, and T. F. Heinz, Tunable electronic correlation effects in nanotube-light interactions, Phys. Rev. B 92, 205407 (2015).
- Sato et al. (2007) K. Sato, R. Saito, J. Jiang, G. Dresselhaus, and M. S. Dresselhaus, Discontinuity in the family pattern of single-wall carbon nanotubes, Phys. Rev. B 76, 195446 (2007).
- Matsunaga et al. (2010) R. Matsunaga, K. Matsuda, and Y. Kanemitsu, Origin of low-energy photoluminescence peaks in single carbon nanotubes: -momentum dark excitons and triplet dark excitons, Phys. Rev. B 81, 033401 (2010).
- Matsunaga et al. (2011) R. Matsunaga, K. Matsuda, and Y. Kanemitsu, Observation of charged excitons in hole-doped carbon nanotubes using photoluminescence and absorption spectroscopy, Phys. Rev. Lett. 106, 037404 (2011).
- Santos et al. (2011) S. M. Santos, B. Yuma, S. Berciaud, J. Shaver, M. Gallart, P. Gilliot, L. Cognet, and B. Lounis, All-optical trion generation in single-walled carbon nanotubes, Phys. Rev. Lett. 107, 187401 (2011).