iint \savesymboliiint \restoresymbolTXFiint \restoresymbolTXFiiint
Globular cluster systems as tracers of the evolutionary history in NGC 3258 and NGC 3268 ††thanks: Based on observations collected at the Cerro Tololo Interamerican Observatory (CTIO); observations carried out at the European Southern Observatory, Paranal (Chile), program 71.B-0122(A), and observations obtained at the Gemini Observatory, which is operated by the Association of Universities for Research in Astronomy, Inc., under a cooperative agreement with the NSF on behalf of the Gemini partnership: the National Science Foundation (United States), the National Research Council (Canada), CONICYT (Chile), Ministerio de Ciencia, Tecnología e Innovación Productiva (Argentina), and Ministerio da Ciencia, Tecnologia e Inovasao (Brazil).
Abstract
We present a new photometric study of NGC 3258 and NGC 3268 globular cluster systems (GCSs), using images in filters and , obtained from four different telescopes. The wide spatial coverage allow us to estimate the whole extension of both GCSs more precisely than in previous works, and new values for the richness of GCs subpopulations. We find differences in the azimuthal distribution between blue (metal-poor) and red (metal-rich) globular clusters (GCs), and confirm that radial profiles flatten towards the centre of the galaxies. In both cases we detected a radial gradient in the colour peak of blue GCs which might be related to the construction of the GCSs. We analyse the similarities and differences in both GCSs, in the context of the posible evolutionary histories of the host galaxies. We also obtain photometric metallicities for a large number of GC candidates around NGC 3258, by applying multicolour-metallicity relations. These results confirm the bimodal metallicity distribution.
keywords:
galaxies: elliptical and lenticular, cD – galaxies: evolution – galaxies: star clusters: individual: NGC 3258 & NGC 3268.1 Introduction
Despite some noteworthy cases, the bulk of the globular clusters systems (GCSs) are usually old stellar systems (e.g. Brodie & Strader 2006), formed under environmental conditions achieved during massive star formation episodes (Ashman & Zepf 1992; Larsen & Richtler 2000; Kruijssen 2014). This fact implies a direct connection between the formation of GCSs and field stars populations, which might be useful to describe the evolutionary history of a galaxy based on the study of its GCS (e.g. Caso et al. 2013b; Caso et al. 2015; Escudero et al. 2015).
The most studied property of GCSs, mainly in early-type galaxies, is the bimodality of their colour distributions. This behaviour is usually understood as a result of bimodality in metallicity, in agreement with spectroscopic results (e.g. Woodley et al. 2010; Usher et al. 2012; Cantiello et al. 2014), despite other interpretations have been proposed (e.g. Yoon et al. 2006; Richtler 2013).
In this sense, we can highlight two theories in the current scheme of GCSs origin. According to one of them, massive star formation episodes, consequence of the merging of building blocks of proto-galaxies, are responsible for the formation of blue GCs (bona fide low-metal content) at high redshift, while the red ones (bona fide high-metal content) are formed in subsequent merger events, after gas enrichment by stellar evolution (Muratov & Gnedin 2010; Li & Gnedin 2014). Alternatively, Tonini (2013) suggests a hierarchical clustering model where the red GC subpopulation is composed by clusters formed in the galaxy main progenitor around redshift , while the blue GC subpopulation is composed by clusters accreted from satellites, and formed at redshifts . Both scenarios can explain the age difference found between the two GC subpopulations in the Galaxy (Leaman et al. 2013; Hansen et al. 2013).
Our target galaxies, NGC 3258 and NGC 3268, belong to the Antlia galaxy cluster, located in the Southern sky at a low Galactic latitude (). Its galaxy content was originally studied by Hopp & Materne (1985) and Ferguson & Sandage (1990), and more recently by Smith Castelli et al. (2012) and Calderón et al. (2015). The central part consists of two subgroups, each one dominated by one of these giant elliptical (gE) galaxies (i.e. NGC 3258 and NGC 3268) of almost the same luminosity. The cluster might be in a merging process, but SBF distances (Blakeslee et al. 2001; Cantiello et al. 2005; Tully et al. 2013) and radial velocities analysis (Hess et al. 2015; Caso & Richtler 2015) are not conclusive.
The GCSs around the two gEs were first analysed by Dirsch et al. (2003b). Afterwards, studies of the inner region of both GCSs were carried out, with deeper photometry, by Bassino et al. (2008) with VTL data and Harris et al. (2006); Harris (2009a) with Hubble Space Telescope (HST) data.
Our goal is to enhance previous studies by taking advantge of wider and deeper datasets. From these we have derived robust photometric metallicities for a large sample of GCs in NGC 3258 for the first time.
This paper is organized as follows. The observations and data reduction are described in section 2, and the results are presented in section 3, while section 4 is devoted to the discussion. Section 5 summarizes the concluding remarks.
2 Observations and data reduction
2.1 MOSAIC data
A subset of the data consists of wide-field images in the Washington photometric system, taken with the MOSAIC II camera mounted on the CTIO 4-m Blanco telescope. One field corresponds to the central region of the Antlia cluster while another field is located to the East (hereafter, CF and EF). The observations were performed during 4/5 April 2002 in the case of the CF, and during 24/25 March 2004 for the EF.
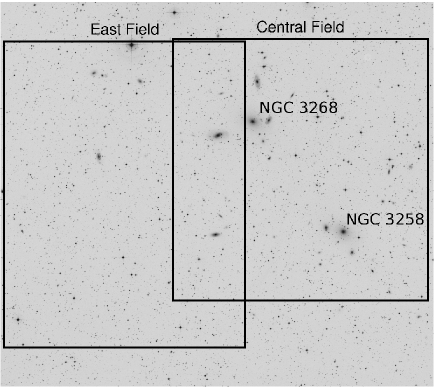
For the CF, four images in and seven in were obtained, all of them with an exposure time of 600 s. For the EF five 600 s images in and seven 900 s exposure in were observed. The Figure 1 shows the location of both MOSAIC fields, overlaid on a DSS image.
We used the Kron-Cousins and Washington filters, although the genuine Washington system uses instead of . However, Geisler (1996) has shown that the Kron-Cousins and magnitudes only differ in the zero-point (we used from Dirsch et al. 2003b). The data were dithered in order to fill in the gaps between the eight individual CCD chips. The MOSAIC pixel scale is arcsec/pixel and its field-of-view (FOV) is arcmin2. Different FOV between CF and EF in Figure 1 are due to a large dithering in the 2004 observations, nedeed to solve an amplifier failure.
2.1.1 Data reduction
The MOSAIC data has been handled using the MSCRED package within IRAF. In order to facilitate point sources detection, the extended galaxy light was subtracted, using a ring median filter with an inner radius of 9 arcmin and an outer radius of 11 arcmin.
We applied the software SExtractor (Bertin & Arnouts 1996) to the images, in order to obtain an initial selection of point sources. The software considered as a positive detection every group of five or more connected pixels with counts above the sky level. The effective radius of classic GCs usually does not exceed a few parsecs (e.g., Harris 2009a). This implies that, at the adopted Antlia distance of Mpc (distance modulus , Dirsch et al. 2003b), GCs are seen as point sources on our MOSAIC images. Thus, we used the star/galaxy classifier from SExtractor, to generate the point sources’ catalogue. We performed the photometry with the DAOPHOT package (Stetson 1987). For both filters, a spatially variable PSF was modelled, employing about a hundred bright stars, well distributed over each field. The final point source selection was based on the and sharpness parameters of the ALLSTAR task.
In the case of the CF, we used the calibration equations from Dirsch et al. (2003b). For the EF, the calibration equations were obtained from standard star fields observed during both nights of the observing run. For each night, 4 to 5 fields, containing about 10 standard stars from the list of Geisler et al. (1996) were observed, spanning a large range in airmass (typically from 1.0 to 1.9). The fitted coefficients for each nights were indistinguishable within the uncertainties, and hence we used a single set of transformation equations.
Finally, the equations for the EF are:
where and are the mean airmass coefficients for each filter. While and are the instrumental colour and magnitude, and are the calibrated ones.
Aperture corrections were obtained from the stars selected for each PSF, and extinction corrections were calculated from Schlafly & Finkbeiner (2011) values (available in NED111This research has made use of the NASA/IPAC Extragalactic Database (NED) which is operated by the Jet Propulsion Laboratory, California Institute of Technology, under contract with the National Aeronautics and Space Administration.) The colour excess for was calculated as (Harris & Canterna 1977).
As both fields partially overlap (Fig. 1), we have been able to determine zero point differences between them from common point sources. Differences in filter are marginal, , but magnitudes in the EF are mag fainter than CF ones. We compared the colours of red Galactic stars and blue background galaxies from the CF photometry, easily identified in the colour-magnitude diagram (CMD), with those available in the literature in the same photometric system, e.g. for the GCSs of NGC 1399 (Bassino et al. 2006), NGC 4636 (Dirsch et al. 2005), and M87 (Forte et al. 2007). In all cases, the colours of Galactic stars and background galaxies agree with those corresponding to our EF field. Hence, we decided to refer the photometry to this latter field and apply the zero-point corrections to the CF one.
2.1.2 Photometric completeness
The data completeness has been studied with the aid of the task ADDSTAR within IRAF, adding 1 000 artificial stars to each science image. These stars present an homogeneous spatial coverage, and span the typical ranges in magnitude and colour as GCs. Then, photometry was carried in the same manner as the original data. This was repeated ten times, resulting in a total of 10 000 artificial stars, and the results were grouped in a single catalogue.
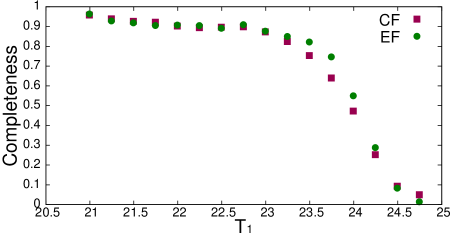
Each field was divided in nine regions, in order to search for strong spatial variations, but no trends were detected, with the exception of the gEs inner region. For these reason, all the point sources at less than 1 arcmin from gEs centre were avoided. The completeness functions in both MOSAIC fields are similar (Figure 2). The completeness in the fields falls below at mag, and the completeness is reached at mag.
Finally a single photometric catalogue was built with the point sources from both fields. In the overlapping region priority was given to the CF photometry.
2.1.3 Selection criteria
GC candidates were selected as points sources with mag and . The colour range proposed here is similar to those used in literature (e.g. Dirsch et al. 2003a; Dirsch et al. 2005; Bassino et al. 2006). The magnitude limit, which implies mag at Antlia distance, was adopted to avoid ultra-compact dwarf (UCD) candidates (e.g. Mieske et al. 2012; Norris et al. 2014), previously studied in Caso et al. (2013a) and Caso et al. (2014). Assuming the mean colour for Es from Fukugita et al. (1995) to transform this latter magnitude, to select GCs candidates we chose mag as the bright end and mag as the faint one.
The background region selected to correct for the contamination, in the MOSAIC photometry, covers an area of 489 arcmin2 and is located at more than 25 arcmin from the gEs, in the Eastern portion of the EF. At this distance, the presence of GCs from NGC 3268 system should be negligible, considering that the extrapolation of the GC radial distribution at this galactocentric distance (see Section 3.2) is less than a seventh of the mean density in the region.
2.2 FORS1 data
We also used FORS1–VLT images in the and bands (program 71.B-0122(A), PI B. Dirsch). These images correspond to three fields, two of them centred on each one of the gEs, and the third one located to the North-West direction (see Figure 1, from Bassino et al. 2008, hereafter N3258F, N3268F and BF, respectively). Their pixel scale is 0.2 arcsec/pixel and their FOV of arcmin2. We refer to Bassino et al. (2008) and Caso et al. (2013a) for further details on the reduction and photometry of these data.
2.2.1 Photometric completeness
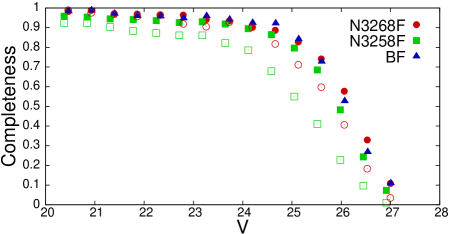
The procedure was similar to that applied to the MOSAIC photometry. This time we added 500 artificial stars to each image, and repeated this procedure 40 times, totalizing 20 000 stars. The results are shown in Figure 3, where the completeness curves for N3258F and N3268F were determined independently for objects at less than 1 arcmin from galaxy centre (open symbols) and out of this limit (filled symbols). Completeness curves for galactocentric distances larger than 1 arcmin are similar in the three fields, achieving at mag.
2.2.2 Selection criteria
Following similar criteria as those described in Section 2.1.3, in this case the GC candidates were selected with mag and mag. The BF was used to estimate the contamination.
2.3 ACS data
In addition, images of an ACS field on NGC 3258 were obtained from the Hubble Space Telescope Data Archive222Some of the data presented in this paper were obtained from the Mikulski Archive for Space Telescopes (MAST). STScI is operated by the Association of Universities for Research in Astronomy, Inc., under NASA contract NAS5-26555. Support for MAST for non-HST data is provided by the NASA Office of Space Science via grant NNX09AF08G and by other grants and contracts. (programme 9427, PI: W. E. Harris), which will be used just to estimate photometric metallicities. The resulting images are the composite of four 1340 s exposures in the filter and four 570 s in the one, where individual exposures were observed in October 2002. Moreover, a field of 47 Tucanae outskirts was used to model the PSF. These observations had been carried out in the same filters as NGC 3258, with exposure times of , in September 2002 (programme 9656). These images present a pixel scale of 0.05 arcsec/pixel and a FOV of arcsec2.
2.3.1 Photometry
With HST GC-like objects might be marginally resolved at NGC 3258 distance (e.g. Caso et al. 2013a, 2014). Hence, we ran SExtractor on the images in both filters, and considered as likely GC candidates those sources with ellipticity and px, similar to other GC studies developed with ACS images (e.g. Jordán et al. 2004, 2007). We performed aperture photometry with the PHOT task within IRAF, using an aperture radius of 5 px. In order to obtain the PSF from the 47 Tucanae fields, approximately 40 bright stars were used in each filter. Then, the ISHAPE (Larsen 1999) software was used, considering such PSF, to calculate structural parameters for bright GC candidates, resulting in a typical effective radius of 0.33 px (i.e., pc at Antlia distance). Approximately 20 GC candidates brighter than mag, relatively isolated and with in both filters were used to calculate aperture corrections, resulting in mag for and mag for .
Calibrated magnitudes in and filters were obtained using the relation
with zero points and , taken from Sirianni et al. (2005).
Finally, we applied the Schlafly & Finkbeiner (2011) Galactic extinction corrections obtained from NED.
2.4 GMOS data
We also used images of a GMOS-Gemini South field, obtained during semester 2016A (programme GS-2016A-Q-66, PI: J.P. Caso). This field contains the gE NGC 3258 (see Fig 1) and was observed as exposures, slightly dithered in order to fill in the gaps of the GMOS-S field and to efficiently remove cosmic rays and bad pixels. The pixel scale in GMOS field is 0.16 arcsec/pixel and the FOV arcmin2.
2.4.1 Data reduction and photometry
The image reduction was performed following standard procedures with the GEMINI package within IRAF.
First, we subtracted the extended galaxy light applying a median filter. Then, we used SExtractor in order to obtain an initial point sources’ catalogue. The photometry was performed with the DAOPHOT package (Stetson 1987) within iraf. A second-order variable PSF was generated from a sample of bright stars, well distributed over the field. This PSF was used to calculate the PSF photometry with the ALLSTAR task. The final point source selection was made with the and sharpness parameters of ALLSTAR.
Aperture correction was obtained from the same bright and moderately isolated stars used to model the PSF and resulted mag.
2.4.2 Photometric calibration
A photometric standard stars field from the list of Smith & et al. (2002) was observed together with the science data and reduced in the same manner. We obtained aperture photometry for the stars located in the field in order to fit transformation equations of the form:
where and are the calibrated and instrumental magnitudes, respectively, and is the photometric zero point, which resulted . is the mean atmospheric extinction at Cerro Pachón, obtained from the Gemini Observatory Web Page333http://www.gemini.edu/sciops/instruments/gmos/calibration, is the airmass, and the colour term, which is a minor correction for GMOS observations ( for filter). As we do not have observations for the standard stars, we obtained their colour from the Smith & et al. (2002) catalogue.
Afterwards, we applied the Schlafly & Finkbeiner (2011) Galactic extinction corrections obtained from NED.
GMOS data will be only used for photometric metallicities estimations in Section 3.5, and completeness curves will not be applied. Despite of this, we analyzed the quality of the photometry adding, 5 000 artificial stars split in 20 images. Then we repeated the photometry in the same manner than the original and compared the measured magnitudes for this set of artificial stars with the input ones. The results showed that magnitudes are not affected neither by the reduction nor photometry procedures.
3 Results
3.1 Spatial distributions
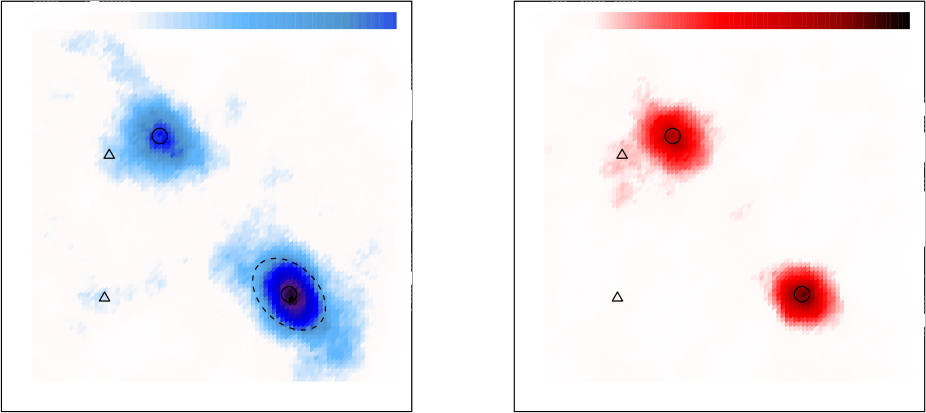
The left panel of Figure 4 shows the spatial distribution of GC candidates around NGC 3268 and NGC 3258 from MOSAIC data for the colour range , assumed as the blue subpopulation. The figure spans arcmin2, and represents the smoothed counts, obtained after dividing the region in arcmin-side cells. The right panel is analogue to the previous one, but devoted to the red GCs, which are assumed to span . Hereafter, the terms blue and red GCs will refer to these colour ranges.
The projected distribution of blue GCs around NGC 3258 is elongated, in a direction that roughly matches the one that crosses both galaxy centres. In the case of NGC 3268, the elongation is not so evident, but an overdensity of GCs towards NGC 3258 seems to be present. For both galaxies, the spatial distribution of red GCs is nearly circular, though that of NGC 3268 looks slightly elongated in the same direction. Dirsch et al. (2003b) and Bassino et al. (2008) indicated that the projected distribution of “all” GCs in NGC 3258 and NGC 3268 seem to be elongated in the direction towards the other gE. From the results in Fig. 4, it is worth discriminating between blue and red GCs in both galaxies, assuming the colour ranges previously indicated. As both GCSs are dominated by blue GCs, the azimuthal distributions for red ones are represented with a larger step ( instead of ).
From FORS1 data, a similar behaviour in the spatial distribution was found for both galaxies in the limited radial range where azimuthal completeness is achieved.
The upper panel of Figure 5 shows the azimuthal distribution for NGC 3258 GC candidates located within 4 arcmin from the galaxy centre, as the number of GCs versus position angle (). We select this radial limit due the presence of several bright galaxies close to both gEs in projected distance. The was measured from North, to the East. We separated blue and red subpopulations, represented by solid and dashed histograms, respectively. The solid and dashed curves indicate the smoothed distributions for each subpopulation, obtained with a Gaussian kernel. The azimuthal distribution for red GCs shows a single maximum at , similar to the projected direction to NGC 3268. Blue GC distribution presents a peak at , together with a second one separated by . These results are similar to what is expected for elongated distributions, taking into account the adopted step. According to this, the dotted line indicates the sinusoidal curve with a -period fitted to the distribution. Its amplitude and PA are and .
The lower panel refers to NGC 3268 GCS. For both subpopulations, the spatial distribution presents a clearly larger number of GCs around , which matches with the projected direction to NGC 3258. The smoothed distribution for red GCs seems to present a second maximum at , which might indicate an elongated distribution, but the evidence is not conclusive.
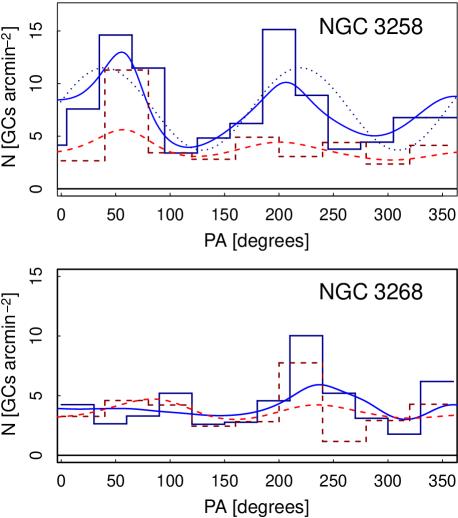
There is plenty of evidence in the literature that points to a close relation between red GCs and galaxy starlight in ellipticals, while blue GCs probably follow the total mass distribution (e.g. Forbes et al. 2012, and references therein). In this context, our results are in agreement with the parameters of the diffuse starlight in both gEs, that present some ellipticity for the inner 2.5 arcmin and a PA of (e.g. Dirsch et al. 2003b; Bassino et al. 2008). The diffuse X-ray emission in both galaxies are also elongated (Pedersen et al. 1997; Nakazawa et al. 2000), something that could link blue GC distributions to them.
3.2 Radial distributions
While MOSAIC spatial coverage allow us to determine the total extension of the GCS, as well as an improved background correction, the depth of FORS1 data results in accurate statistics for the inner part of the GCSs. Therefore, we complement the results from both photometries in order to obtain the radial profiles for blue and red GCs.
From the MOSAIC data we determined the radial distribution for galactocentric distances larger than 1 arcmin. In order to avoid changes in the completeness due to the presence of the three NGC 3268 bright neighbours, we excluded GC candidates near the other bright galaxies in the field (i.e., at less than 1 arcmin from NGC 3257, NGC 3260 NGC 3267 or NGC 3273, and 3 arcmin from NGC 3271). In addition, the gEs GCSs probably overlap as suggested by Bassino et al. (2008). As a consequence, we obtained the extension of both GCS in an iterative way, avoiding candidates in regions where previous studies indicated that a contribution from the other GCS was expected. For both gEs we proposed that the total extension for the GCS is achieved when the GC surface density is equal to 30 per cent of the background level. This criterium has been successfully applied to the study of other GCSs (e.g. Caso et al. 2015; Bassino & Caso 2017), including those developed with MOSAIC images (e.g. Bassino et al. 2006; Caso et al. 2013b). The radial profiles were corrected for contamination and the errors were assumed as Poissonian.
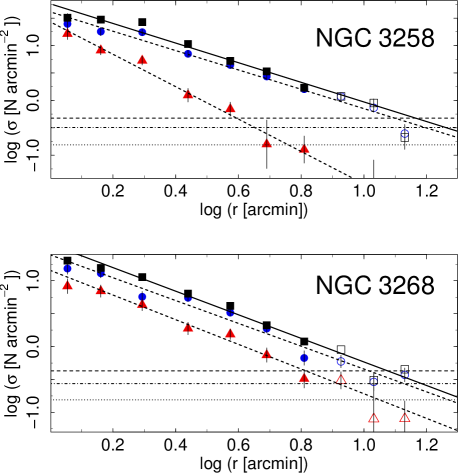
The upper panel of Figure 6 corresponds to the radial projected distribution of GCs around NGC 3258 derived from MOSAIC data. Galactocentric distances smaller than 1 arcmin are avoided due increasing incompleteness. Radial bins that do not overlap with NGC 3268 GCS (from the iterative process, those with projected distance to NGC 3258 lower than arcmin) are indicated with filled symbols. Open symbols represent the projected density at galactocentric radii where both GCS might be overimposed, i.e. the ones where we avoid the overlapping region, which substantially reduces the analyzed area. For blue GCs, we obtain the radial distribution using concentric ellipses with position angle PA= (Figure 5) and ellipticities , calculated from our results as (Dirsch et al. 2003b, and being the number of GCs along major and minor axes, and the slope absolute value for the radial profile when azimuthal symmetry is assumed). As an example, an ellipse with this parameters and major axis 4.5 arcmin is plotted in Figure. 4. The dashed horizontal line represents 30 per cent of the background level for the entire sample, while dot-dashed and dotted lines correspond to blue and red GCs, respectively. We indicate the results of fitting a power-law to blue (circles) and red (triangles) GC distributions with dashed lines, while the solid one represents the power-law fitted to the entire sample of GC candidates (squares). The extrapolation in both curves indicates an extension for the GCS of arcmin ( 170 kpc at Antlia distance) that is defined by the blue subpopuation, while the red subpopulation seems to be more concentrated towards NGC 3258, reaching 6 arcmin . The slopes for the fitted power-laws were and for the blue and red GCs, respectively.
The lower panel corresponds to the radial projected distribution of GCs around NGC 3268 from MOSAIC data, for galactocentric distances larger than 1 arcmin. In this case, we calculated the radial distributions using concentric circles, considering that the evidence of an elliptical distribution is not so conclusive as in NGC 3258. The extension for the blue and red subpopulations are very similar, and arcmin, respectively. In this case the fitted slopes for blue and red GC candidates were and , respectively.
Several studies point to a flatter radial profile in the inner regions of GCSs (e.g. Elson et al. 1998), probably due to GC erosion during early stages of the system evolution (e.g. Capuzzo-Dolcetta & Mastrobuono-Battisti 2009; Brodie et al. 2014). In order to extend the radial profiles from MOSAIC data to these innermost regions, we also obtained the radial profiles from the VLT data. Unlike previous analysis from Bassino et al. (2008), we corrected the profiles by completeness considering different curves for bins within 1 arcmin or outside this limit (see Figure 3). The background correction was obtained from a field located to the North-West of NGC 3268 (see Figure 1 from Bassino et al. 2008). This field might present a small number of GCs from NGC 3268 system, but surface density at large galactocentric distances is very low, and hence contamination from NGC 3268 clusters should be negligible.
In order to fit the FORS1 profile, we adopted a modified Hubble distribution (Binney & Tremaine 1987; Dirsch et al. 2003b),
| (3) |
which behaves as a power-law with slope for large radii. Despite its limited photometric depth, the large FOV of MOSAIC images allow us to obtain a more accurate determination of the slope of radial distributions than FORS1 fields. Thus, for fitting the Hubble distribution we fixed as a half the slope of the corresponding power-law obtained from MOSAIC data. Hence, only and remained as free parameters to fit.
The upper panel of Figure 7 shows the radial profile for GCs around NGC 3258 brighter than , background and completeness corrected. We discriminated in blue (squares) and red (circles) subpopulations using the colour limit , which has been previously used by Bassino et al. (2008). The dotted curves represent the power-laws previously fitted for the outer GCS region from MOSAIC data. It can be noticed the good agreement between the fitted power-laws and the FORS1 data. Dashed lines represent the modified Hubble distributions fitted to FORS1 data. The lower panel is analogue, but for NGC 3268. Table 1 shows the parameters obtained for both distributions.
| NGC 3258 | NGC 3268 | |||
|---|---|---|---|---|
| Blue GCs | Red GCs | Blue GCs | Red GCs | |
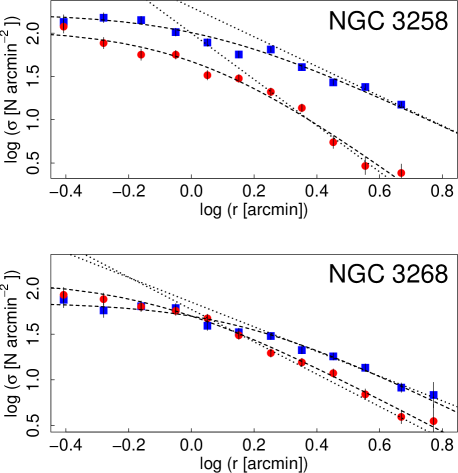
It can be clearly seen that the modified Hubble distribution provides an excellent fit to the inner regions for both GC subpopulations.
3.3 Luminosity functions and size of the GCSs
FORS1 data were previously used by Bassino et al. (2008) to obtain the GC luminosity function (GCLF) and distance through the turn-over magnitudes (TOM). We repeated the measurement, taking into account the different completness curve for point sources within 1 arcmin from the galaxy centre and considering a magnitude limit . As this latter magnitude limit is barely fainter than the TOM obtained by Bassino et al. (2008), it might result in large uncertainties in our TOM determination. In order to avoid this, we fixed the TOM to the distance moduli published by Tully et al. (2013), for NGC 3258 and for NGC 3268. We have chosen these distances because they are the most recent and accurate SBF estimations.
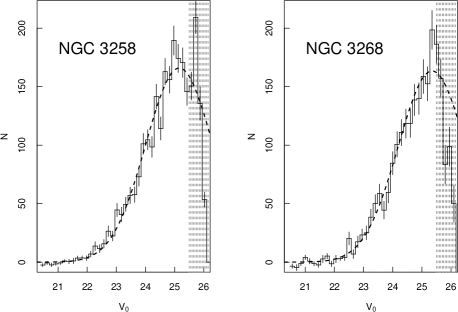
In Figure 8 we present the GCLF for both gEs in the radial range arcmin, where vertical grey lines indicate regions fainter than the magnitude limit, and dashed curves show the fitted functions. We assume that both GCLF are well represented by Gaussian profiles with a nearly universal TOM mag (e.g. Brodie & Strader 2006; Jordán et al. 2007), resulting in dispersions for NGC 3258 and for NGC 3268. From numerical integrations, we calculate that the GCs brighter than represent and per cent, respectively, of the total samples. The errors are dominated by the distance moduli uncertainties.
Hence, we can now estimate new GC populations for NGC 3258 and NGC 3268, considering a more precise completeness correction and a better fit of the radial GC distributions. From the numerical integration of the modified Hubble distributions fitted to the radial profiles (Section 3.2), we can calculate the GC population brighter than in both cases. In order to obtain uncertainties, we calculated 1 000 artificial sets of Hubble distribution parameters using Monte-Carlo simulations, assuming that they are generated by normal distributions with dispersions equal to the fitting errors. Then, the deviation estimated from their numerical integration is assumed as the uncertainty in the GC population.
As a consequence, the blue and red GC populations for NGC 3258 result and members, respectively. For NGC 3268 we obtained a population of blue GCs and reds. That implies that GCSs in both galaxies have similar richness, but their compositions differ considerably. The obtained populations are significantly larger than previously determined ones (Dirsch et al. 2003b; Bassino et al. 2008), as expected from the larger extensions derived for both GCS in this paper. Bassino et al. (2008) integrated the radial profiles up to 10 arcmin, and obtained populations of 6000 and 4750 GCs for NGC 3258 and NGC 3268, respectively. If we integrate our radial profiles up to the same radial limit, it results in and GCs, respectively. Hence, our results are in agreement with Bassino et al. (2008) ones for NGC 3258, and the larger population is due to the new determination of the GCS extension. On the other hand, for NGC 3268 we obtained a larger population in the inner .
From total magnitudes derived by the Carnegie-Irvine Galaxy Survey (Ho et al. 2011), foreground extintion corrections from Schlafly & Finkbeiner (2011) and distance moduli from Tully et al. (2013), absolute magnitudes for NGC 3258 and NGC 3268 are and ,respectively. Hence, the specific frequencies (Harris & van den Bergh 1981) for NGC 3258 and NGC 3268 result and , respectively. The values are among the largest for galaxies of similar luminosity, and point in both cases to evolutionary histories with a large number of merging episodes. The fraction of red-to-blue GCs are for NGC 3258 and for NGC 3268, which is in agreement with Bassino et al. (2008).
3.4 Colour distributions
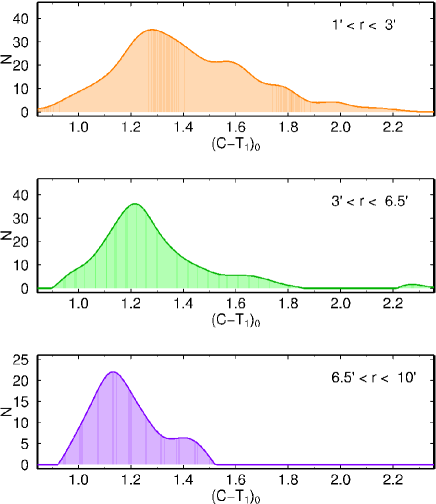
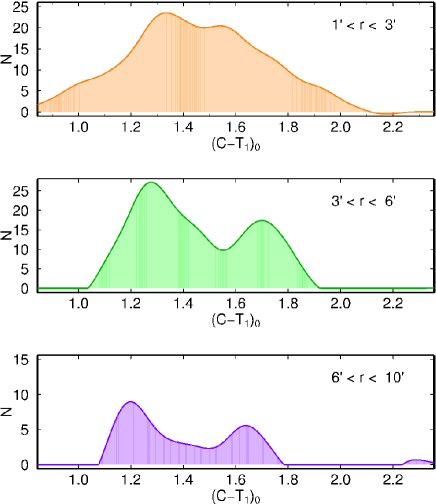
The left panels of Figure 9 show the colour distributions for NGC 3258 GCs, in three ranges of projected galactocentric distance. In order to avoid contamination from the NGC 3268 GCS, for the outer range we have considered only GC candidates with . Bimodality seems to be present in the two inner frames, which is expected from the extension of the radial profile for red GCs in Section 3.2. It is strinking how the blue peak moves towards bluer colours when the projected galactocentric distance increases. In order to quantify this effect, we statistically subtracted the background contribution from the sample of GC candidates in each radial regime. Then, we applied the algorithm Gaussian Mixture Modeling (GMM, Muratov & Gnedin 2010) to the clean samples, and repeated the procedure 25 times. The mean colour for the blue GC peak in the three ranges result , and , respectively, showing that the colour change is significant.
A similar behaviour is also found in the colour distribution of NGC 3268 GCs (right panels of Fig 9). In this case, for the outer colour range we plotted GC candidates with . There are signs of bimodality in all the frames, pointing to a wide extended subpopulation of red GCs. From GMM, the mean colour for the blue GC peaks are , and , respectively.
Similar colour gradients for blue GCs have been found in other giant ellipticals, like NGC 1399 (Bassino et al. 2006) or NGC 4594 (Hargis & Rhode 2014).
A radial gradient in the colour of the blue peak can also be obtained for both galaxies from FORS1 data, when we split the GC candidates between those with galactocentric distances larger than and lower than this limit. However, the small FOV and the limited metallicity dependence of photometry in comparison with one retrict our analysis.
3.5 Photometric metallicities
Multicolour-metallicity relations (e.g. Forte et al. 2013), have proven to be useful for determining photometric metallicities for a large sample of GCs, with a relative low cost in observational hours.
Although an increasing number of GCs present multiple stellar populations (e.g. Milone et al. 2008; Joo & Lee 2013), we are considering globulars integrated properties and the age spreads between these populations are significantly smaller than the total ages of the GCs. Thus, single stellar populations (SSP) still constitute a good approximation to GCs. Recent studies have shown that the ages of GCs indicate that they mostly formed at larger redshifts than (e.g. VandenBerg et al. 2013; Forbes et al. 2015, and references therein). We aim at obtaining photometric metallicities for a subsample of NGC 3258 GCs, based on the long-base set of photometric measurements available, ranging from to bands. We assumed ages of 10, 11.2, and 12.6 Gyr and metallicities in the range of . We used the synthetic magnitudes for SSP obtained from CMD 2.8444http://stev.oapd.inaf.it/cmd (Bressan et al. 2012) with a lognormal initial mass function.
We selected objects brighter than , in order to achieve an acceptable signal-to-noise ratio. This limit implies uncertainties lower than 0.1 mag in the filter, 0.05 mag in the filter and 0.03 mag for the other photometries. We split our sample in three groups, according to the set of photometrical measurements available for each object. Objects in group A present available photometry in ,,,, and filters, those in group B lack magnitudes, and the set of magnitudes for GC candidates in group C corresponds to bands ,, and . The number of GC candidates in the three groups are 145, 91, and 85, respectively.
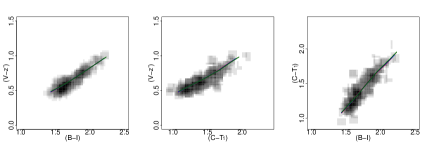
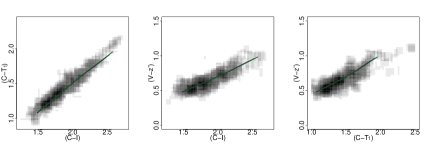
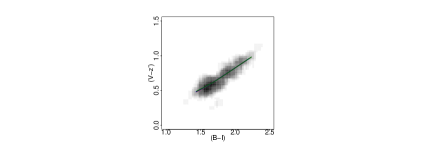
For groups A and B we defined a three-dimensional space with linearly independent colours, while a two-dimensional space was established for group C. Figure 10 shows smoothed colour-colour relations from the colour-space for each group. The solid curves depict the SSPs from Bressan et al. (2012) for 10 (red), 11.2 (blue), and 12.6 Gyr (green), respectively, presenting almost identical positions in all the diagrams.
Hence, metallicities for each object correspond to the point in the SSP for which the distance to the object in the colour-space is a minimum. In order to obtain metallicity uncertainties, we assumed the colour uncertainties as dispersions of Gaussian distributions, and applied Monte-Carlo to obtain simulated colours. For each GC candidate, we repeated the process 100 times, and then we calculated deviations from the resulting metallicities.
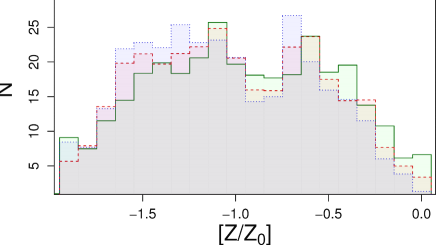
The left panel of Figure 11 shows the metallicity distributions, assuming ages of 10 Gyr (solid histogram), 11.2 Gyr (dashed histogram) and 12.6 Gyr (dotted histogram). In the three cases, the distributions seem to deviate from a single Gaussian. Thus, we run GMM to each sample, obtaining the results listed in Table 2. We obtained negative kurtosis values and parameters larger than 2, pointing to a bimodal distribution (Muratov & Gnedin 2010). The Gaussian peaks are in agreement within the uncertainties in the three cases, slightly moving towards lower metallicities as the age increases.
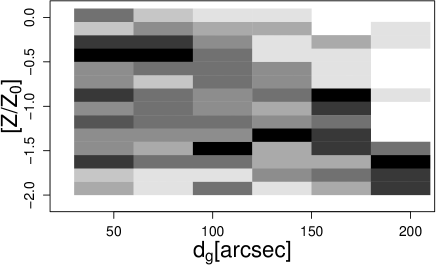
The right panel presents the metallicity distribution as a function of the projected distance to NGC 3258 centre, assuming GC candidates as SSP with age 10 Gyr. The grey-scale has been normalized for each radial range, with black representing the metallicity bins with the largest counts. As expected, metal-rich GCs dominate close to the galaxy centre, but the mode of the distribution moves towards lower metallicities for larger radii.
| SSP [Gyr] | ||||||
|---|---|---|---|---|---|---|
4 Discussion
4.1 Implications of the colour gradient
In the current scenario for GC formation, the blue GC population (bona fide metal-poor) in early-type galaxies formed during the violent star-formation events that occurred when first proto-galaxies begin to merge, or were captured from satellite galaxies. Afterwards, the metal-rich ones formed in merging episodes occurred in a limited number, but involving more massive, and more evolved, galaxies (Muratov & Gnedin 2010; Kruijssen 2014; Li & Gnedin 2014).
The accretion of dwarf galaxies could also be important to increase a GCS population, particularly for the metal-poor GCs (Schuberth et al. 2010; Richtler 2013; Tonini 2013, and references therein). Assuming this scenario, the accreted GCs could present a spatial distribution more spread, compared with GCs formed in-situ. This would be in agreement with the larger velocity dispersions that blue GCs present in nearby gEs (e.g. Sharples et al. 1998; Côté et al. 2003; Schuberth et al. 2010, 2012; Puzia et al. 2014). Hence, the correlation between the peak of blue GCs in the colour distribution and galactocentric distance found in NGC 3258, NGC 3268 and NGC 1399 (Bassino et al. 2006) could be explained by the correlation between the colour and metallicity for blue GCs and the galaxy masses (e.g. Peng et al. 2006; Strader et al. 2004).
This scenario of two phases in galaxy formation was also proposed by Forbes et al. (2011) to explain similar colour gradients in NGC 1407 and other giant ellipticals with large GCS like NGC 1399 (Bassino et al. 2006) or M87 Harris (2009b).
As a consequence, the radial gradient in the colour of the blue GCs peak points to a large accretion history of satellite galaxies for both gEs.
4.2 Clues for the evolutionary histories in the GCS composition
Both gEs present similar halo masses (Pedersen et al. 1997; Nakazawa et al. 2000), luminosities (Ho et al. 2011) and colours (being NGC 3268 0.1 mag redder Dirsch et al. 2003b). Hence their stellar masses should not differ significantly. From literature galaxy stellar and halo masses might be correlated with the size of the GCS (Harris et al. 2013; Hudson et al. 2014), and even with the fraction of red GCs ( Harris et al. 2015). The higher in NGC 3268 might indicate that it has followed the fiducial ellipticals’ evolutionary history. Otherwise, the smaller in NGC 3258 may suggest that major mergers ocurred between galaxies with lower gas mass available for starburst episodes, even possibly including dry mergers. A mixture of wet and dry mergers could be in agreement with the slightly bluer colour profile of NGC 3258 (Dirsch et al. 2003b). The accretion of a large number of satellite galaxies, whose GCS are mainly formed by blue GCs (e.g. Peng et al. 2008; Georgiev et al. 2010) could also be responsible by the smaller .
4.3 The central flattening in GCs radial profiles
Our results for both gEs point that the flattening in the GC radial profiles is not explained just by the completeness drop, and physical processes like GCs erosion (Capuzzo-Dolcetta & Mastrobuono-Battisti 2009) should be invoked. Kruijssen (2015) found that the same environmental conditions involved in GC formation favour their tidal disruption at early stages, unless its progenitor suffered a merger which redistributed the GCs into the galaxy halo. In this context, subsequent major mergers not only result in a larger formation of red GCs, but also improve their survivance ratio. Hence the larger and radial extension of the red GC subpopulation of NGC 3268 with respect to NGC 3258 might be explained by different merger histories, as indicated in Section 4.2.
5 Conclusions
On the basis of multi-band , , , , , and photometry, obtained with images taken with four different telescopes (CTIO, VLT, GEMINI, and archive HST), we carry out a new study of the GCSs of NGC 3258 and NGC 3268. Our results complement previous ones, with the main advantages of working with: a larger FOV, a filter combination never used before for these galaxies, and a more precise calculation of the completeness corrections.
We summarize our conclusions in the following.
-
•
Previous studies have shown that the projected total GC distributions are both elongated. We now confirm that blue GCs are responsible for such distributions, being clearly elongated in the same direction as a line joining both galaxies. Even an overdensity of blue GCs close to NGC 3268 can be detected, towards NGC 3258. That is in agreement with the corresponding azimuthal GC distributions, where NGC 3268 blue GCs show a peak in the direction towards NGC 3258. Tidal effects between both galaxies and their blue GC subpopulations might be present, as the elongations agree with the elongation of the galaxies’ bodies.
-
•
The extension of the blue and red GC subpopulations for NGC 3258 are quite different, 170 kpc and 60 kpc for blues and reds, respectively. However, for NGC 3268 they are much more alike, 140 kpc and 120 kpc for blues and reds, respectively. The red GC subpopulation is much more concentrated in NGC 3258 than in NGC 3268.
-
•
Thanks to the improvement in the completeness corrections, the inner radial GC profiles, for blue and red subpopulations and for both galaxies, can be perfectly fitted with a modified Hubble law. Thus, the flattened inner GC profiles are pointing to a ‘true’ effect of GC erosion in both cases.
-
•
Thanks to improved GCLFs and better fits of the radial GC distributions for both galaxies, we estimate new GC populations. For NGC 3258, we obtain blue GCs and red GCs, and for NGC 3268 blue GCs and reds. The total GC populations are similar, of about 8000 members, i.e. larger than previous determinations. However, the fraction of red GCs is higher in NGC 3268 which suggests that, although both galaxies belong to the same environment, they should have experienced a different merging history.
-
•
In the GC colour distributions, we detect a clear gradient in the blue GC subpopulations, in the sense that the blue peak gets bluer when the galactocentric radius increases. This colour gradient is present in NGC 3258 as well as in NGC 3268, and can be understood as a consequence of an important accretion of satellite proto/dwarf galaxies during the early stages of galaxy formation.
-
•
By means of muti-colour relations, we estimate photometric metallicities for a subsample of GCs and fit SSPs. We recover clear bimodal metallicity distributions for ages between 10 and 12.6 Gyr.
Similarities in the GCSs, i.e., richness, radial extensions and presence of radial gradients in the colour of blue GCs point in both cases to a large number of accretion and merging episodes. Despite of this, differences suggest unalike evolutionary histories of the host galaxies, probably due to different number of dry and wet mergers.
Acknowledgments
JPC acknowledges Tom Richtler and Francisco Azpilicueta for useful comments that improved the article.
This research was funded with grants from Consejo Nacional de Investigaciones Científicas y Técnicas de la República Argentina (PIP 112-201101-00393), Agencia Nacional de Promoción Científica y Tecnológica (PICT-2013-0317), and Universidad Nacional de La Plata (UNLP 11-G124), Argentina.
References
- Ashman & Zepf (1992) Ashman K. M., Zepf S. E., 1992, ApJ, 384, 50
- Bassino & Caso (2017) Bassino L. P., Caso J. P., 2017, MNRAS, 466, 4259
- Bassino et al. (2006) Bassino L. P., Faifer F. R., Forte J. C., Dirsch B., Richtler T., Geisler D., Schuberth Y., 2006, A&A, 451, 789
- Bassino et al. (2008) Bassino L. P., Richtler T., Dirsch B., 2008, MNRAS, 386, 1145
- Bertin & Arnouts (1996) Bertin E., Arnouts S., 1996, A&AS, 117, 393
- Binney & Tremaine (1987) Binney J., Tremaine S., 1987, Galactic dynamics
- Blakeslee et al. (2001) Blakeslee J. P., Lucey J. R., Barris B. J., Hudson M. J., Tonry J. L., 2001, MNRAS, 327, 1004
- Bressan et al. (2012) Bressan A., Marigo P., Girardi L., Salasnich B., Dal Cero C., Rubele S., Nanni A., 2012, MNRAS, 427, 127
- Brodie & Strader (2006) Brodie J. P., Strader J., 2006, ARA&A, 44, 193
- Brodie et al. (2014) Brodie J. P., et al., 2014, ApJ, 796, 52
- Calderón et al. (2015) Calderón J. P., Bassino L. P., Cellone S. A., Richtler T., Caso J. P., Gómez M., 2015, MNRAS, 451, 791
- Cantiello et al. (2005) Cantiello M., Blakeslee J. P., Raimondo G., Mei S., Brocato E., Capaccioli M., 2005, ApJ, 634, 239
- Cantiello et al. (2014) Cantiello M., Blakeslee J. P., Raimondo G., Chies-Santos A. L., Jennings Z. G., Norris M. A., Kuntschner H., 2014, A&A, 564, L3
- Capuzzo-Dolcetta & Mastrobuono-Battisti (2009) Capuzzo-Dolcetta R., Mastrobuono-Battisti A., 2009, A&A, 507, 183
- Caso & Richtler (2015) Caso J., Richtler T., 2015, Astronomy and Astrophysics, 584
- Caso et al. (2013a) Caso J. P., Bassino L. P., Richtler T., Smith Castelli A. V., Faifer F. R., 2013a, MNRAS, 430, 1088
- Caso et al. (2013b) Caso J. P., Richtler T., Bassino L. P., Salinas R., Lane R. R., Romanowsky A., 2013b, A&A, 555, A56
- Caso et al. (2014) Caso J. P., Bassino L. P., Richtler T., Calderón J. P., Smith Castelli A. V., 2014, MNRAS, 442, 891
- Caso et al. (2015) Caso J. P., Bassino L. P., Gómez M., 2015, MNRAS, 453, 4421
- Côté et al. (2003) Côté P., McLaughlin D. E., Cohen J. G., Blakeslee J. P., 2003, ApJ, 591, 850
- Dirsch et al. (2003a) Dirsch B., Richtler T., Geisler D., Forte J. C., Bassino L. P., Gieren W. P., 2003a, AJ, 125, 1908
- Dirsch et al. (2003b) Dirsch B., Richtler T., Bassino L. P., 2003b, A&A, 408, 929
- Dirsch et al. (2005) Dirsch B., Schuberth Y., Richtler T., 2005, A&A, 433, 43
- Elson et al. (1998) Elson R. A. W., Grillmair C. J., Forbes D. A., Rabban M., Williger G. M., Brodie J. P., 1998, MNRAS, 295, 240
- Escudero et al. (2015) Escudero C. G., Faifer F. R., Bassino L. P., Calderón J. P., Caso J. P., 2015, MNRAS, 0, 0
- Ferguson & Sandage (1990) Ferguson H. C., Sandage A., 1990, AJ, 100, 1
- Forbes et al. (2011) Forbes D. A., Spitler L. R., Strader J., Romanowsky A. J., Brodie J. P., Foster C., 2011, MNRAS, 413, 2943
- Forbes et al. (2012) Forbes D. A., Ponman T., O’Sullivan E., 2012, MNRAS, 425, 66
- Forbes et al. (2015) Forbes D. A., Pastorello N., Romanowsky A. J., Usher C., Brodie J. P., Strader J., 2015, MNRAS, 452, 1045
- Forte et al. (2007) Forte J. C., Faifer F., Geisler D., 2007, MNRAS, 382, 1947
- Forte et al. (2013) Forte J. C., Faifer F. R., Vega E. I., Bassino L. P., Smith Castelli A. V., Cellone S. A., Geisler D., 2013, MNRAS, 431, 1405
- Fukugita et al. (1995) Fukugita M., Shimasaku K., Ichikawa T., 1995, PASP, 107, 945
- Geisler (1996) Geisler D., 1996, AJ, 111, 480
- Geisler et al. (1996) Geisler D., Lee M. G., Kim E., 1996, AJ, 111, 1529
- Georgiev et al. (2010) Georgiev I. Y., Puzia T. H., Goudfrooij P., Hilker M., 2010, MNRAS, 406, 1967
- Hansen et al. (2013) Hansen B. M. S., et al., 2013, Nature, 500, 51
- Hargis & Rhode (2014) Hargis J. R., Rhode K. L., 2014, ApJ, 796, 62
- Harris (2009a) Harris W. E., 2009a, ApJ, 699, 254
- Harris (2009b) Harris W. E., 2009b, ApJ, 703, 939
- Harris & Canterna (1977) Harris H. C., Canterna R., 1977, AJ, 82, 798
- Harris & van den Bergh (1981) Harris W. E., van den Bergh S., 1981, AJ, 86, 1627
- Harris et al. (2006) Harris W. E., Whitmore B. C., Karakla D., Okoń W., Baum W. A., Hanes D. A., Kavelaars J. J., 2006, ApJ, 636, 90
- Harris et al. (2013) Harris W. E., Harris G. L. H., Alessi M., 2013, ApJ, 772, 82
- Harris et al. (2015) Harris W. E., Harris G. L., Hudson M. J., 2015, The Astrophysical Journal, 806, 36
- Hess et al. (2015) Hess K. M., Jarrett T. H., Carignan C., Passmoor S. S., Goedhart S., 2015, preprint, (arXiv:1506.06143)
- Ho et al. (2011) Ho L. C., Li Z.-Y., Barth A. J., Seigar M. S., Peng C. Y., 2011, ApJS, 197, 21
- Hopp & Materne (1985) Hopp U., Materne J., 1985, A&AS, 61, 93
- Hudson et al. (2014) Hudson M. J., Harris G. L., Harris W. E., 2014, ApJL, 787, L5
- Joo & Lee (2013) Joo S.-J., Lee Y.-W., 2013, ApJ, 762, 36
- Jordán et al. (2004) Jordán A., et al., 2004, ApJS, 154, 509
- Jordán et al. (2007) Jordán A., et al., 2007, ApJs, 171, 101
- Kruijssen (2014) Kruijssen J. M. D., 2014, Classical and Quantum Gravity, 31, 244006
- Kruijssen (2015) Kruijssen J. M. D., 2015, MNRAS, 454, 1658
- Larsen (1999) Larsen S. S., 1999, A&AS, 139, 393
- Larsen & Richtler (2000) Larsen S. S., Richtler T., 2000, A&A, 354, 836
- Leaman et al. (2013) Leaman R., VandenBerg D. A., Mendel J. T., 2013, MNRAS, 436, 122
- Li & Gnedin (2014) Li H., Gnedin O. Y., 2014, ApJ, 796, 10
- Mieske et al. (2012) Mieske S., Hilker M., Misgeld I., 2012, A&A, 537, A3
- Milone et al. (2008) Milone A. P., et al., 2008, ApJ, 673, 241
- Muratov & Gnedin (2010) Muratov A. L., Gnedin O. Y., 2010, ApJ, 718, 1266
- Nakazawa et al. (2000) Nakazawa K., Makishima K., Fukazawa Y., Tamura T., 2000, PASJ, 52, 623
- Norris et al. (2014) Norris M. A., et al., 2014, MNRAS, 443, 1151
- Pedersen et al. (1997) Pedersen K., Yoshii Y., Sommer-Larsen J., 1997, ApJ, 485, L17
- Peng et al. (2006) Peng E. W., et al., 2006, ApJ, 639, 95
- Peng et al. (2008) Peng E. W., et al., 2008, ApJ, 681, 197
- Puzia et al. (2014) Puzia T. H., Paolillo M., Goudfrooij P., Maccarone T. J., Fabbiano G., Angelini L., 2014, ApJ, 786, 78
- Richtler (2013) Richtler T., 2013, in Pugliese G., de Koter A., Wijburg M., eds, Astronomical Society of the Pacific Conference Series Vol. 470, 370 Years of Astronomy in Utrecht. p. 327 (arXiv:1210.0045)
- Schlafly & Finkbeiner (2011) Schlafly E. F., Finkbeiner D. P., 2011, ApJ, 737, 103
- Schuberth et al. (2010) Schuberth Y., Richtler T., Hilker M., Dirsch B., Bassino L. P., Romanowsky A. J., Infante L., 2010, A&A, 513, A52
- Schuberth et al. (2012) Schuberth Y., Richtler T., Hilker M., Salinas R., Dirsch B., Larsen S. S., 2012, A&A, 544, A115
- Sharples et al. (1998) Sharples R. M., Zepf S. E., Bridges T. J., Hanes D. A., Carter D., Ashman K. M., Geisler D., 1998, AJ, 115, 2337
- Sirianni et al. (2005) Sirianni M., et al., 2005, PASP, 117, 1049
- Smith & et al. (2002) Smith J. A., et al. 2002, AJ, 123, 2121
- Smith Castelli et al. (2012) Smith Castelli A. V., Cellone S. A., Faifer F. R., Bassino L. P., Richtler T., Romero G. A., Calderón J. P., Caso J. P., 2012, MNRAS, 419, 2472
- Stetson (1987) Stetson P. B., 1987, PASP, 99, 191
- Strader et al. (2004) Strader J., Brodie J. P., Forbes D. A., 2004, AJ, 127, 3431
- Tonini (2013) Tonini C., 2013, ApJ, 762, 39
- Tully et al. (2013) Tully R. B., et al., 2013, AJ, 146, 86
- Usher et al. (2012) Usher C., et al., 2012, MNRAS, 426, 1475
- VandenBerg et al. (2013) VandenBerg D. A., Brogaard K., Leaman R., Casagrande L., 2013, ApJ, 775, 134
- Woodley et al. (2010) Woodley K. A., Harris W. E., Puzia T. H., Gómez M., Harris G. L. H., Geisler D., 2010, ApJ, 708, 1335
- Yoon et al. (2006) Yoon S.-J., Yi S. K., Lee Y.-W., 2006, Science, 311, 1129