J12343901: an extremely metal-deficient compact star-forming dwarf galaxy at redshift 0.133
Abstract
We have obtained optical spectroscopy of one of the most metal-poor dwarf star-forming galaxies (SFG) in the local Universe, J12343901, with the Large Binocular Telescope (LBT)/Multi-Object Dual Spectrograph (MODS). This blue compact dwarf (BCD) galaxy with a redshift =0.133 was selected from the Data Release 14 (DR14) of the Sloan Digital Sky Survey (SDSS). Its properties are extreme in many ways. Its oxygen abundance 12 + log O/H = 7.035 0.026 is among the lowest ever observed for a SFG. Its absolute magnitude = 17.35 mag makes it the brightest galaxy among the known BCDs with 12 + log O/H 7.3. With its low metallicity, low stellar mass = 107.13 M⊙ and very low mass-to-light ratio / 0.01 (in solar units), it deviates strongly from the mass-metallicity and luminosity-metallicity relations defined by the bulk of the SFGs in SDSS DR14. J12343901 has a very high specific star-formation rate sSFR 100 Gyr-1, indicating very active ongoing star-formation. Its spectrum shows a strong He ii 4686 emission line, with a flux 2.4 per cent that of the H emission line. The most probable source of ionizing radiation for producing such a strong line is fast radiative shocks. J12343901 has a ratio O32 = [O iii]5007/[O ii]3727 15, the highest among the lowest-metallicity SFGs, and is thus likely leaking Lyman continuum radiation. It is a good candidate for being a young dwarf galaxy, with a large fraction of its stars formed recently. As such, it is probably one of the best local counterparts of dwarf primeval galaxies responsible for the reionization of the early Universe.
keywords:
galaxies: dwarf – galaxies: starburst – galaxies: ISM – galaxies: abundances.1 Introduction
The most metal-deficient nearby star-forming galaxies (SFGs), with oxygen abundances 12 + logO/H 7.3, are often considered to be the best local counterparts of the dwarf galaxies at high redshifts. They share many of the same properties. Besides their very low metallicities, they have low stellar masses, high specific star formation rates, high gas masses and a compact structure. Therefore, these very rare nearby extremely metal-poor galaxies constitute excellent laboratories in which to study the physical conditions that prevailed in galaxies at redshifts 5–10, during the epoch of reionization of the Universe. Because of their proximity, they can be studied with an accuracy that is not possible for high-redshift dwarf galaxies. The majority of these nearby galaxies can often be classified as blue compact dwarf (BCD) galaxies because of their low mass, blue colour, due to the active star-formation, and compact morphology (Thuan & Martin, 1981).
The first spectroscopically observed extremely metal-deficient SFG, I Zw 18 (Searle & Sargent, 1972), has 12 + log O/H 7.17 – 7.26 (e.g. Skillman & Kennicutt, 1993; Izotov & Thuan, 1998). More recently, other SFGs with lower metallicities, e.g. SBS 0335052W with 12 + logO/H = 7.120.03 (Izotov et al., 2005) and Little Cub with 12 + logO/H = 7.130.08 (Hsyu et al., 2017) have been found. The large spectroscopic data base provided by the Sloan Digital Sky Survey (SDSS) has allowed to increase considerably the number of known SFGs with 12 + log O/H 7.1 – 7.3, to 50 objects (e.g. Izotov et al., 2012a; Guseva et al., 2017). However, only very few SFGs with 12 + log O/H 7.1 have been uncovered so far. One example is AGC 198691 with 12 + logO/H = 7.020.03 (Hirschauer et al., 2016). Recently, Izotov et al. (2018a) have discovered in the SDSS Data Release 13 the SFG J08114730 with a record low 12 + log O/H = 6.980.02, as derived from a high signal-to-noise ratio spectrum obtained with the Large Binocular Telescope (LBT). Similar or lower oxygen abundances of 7.010.07, 6.980.06, 6.860.14 have been reported by Izotov et al. (2009) in three individual H ii regions of SBS 0335052W, and of 6.960.09 by Annibali et al. (2019) in one of the H ii regions in DDO 68. However, we note that the luminosity-weighted oxygen abundances (i.e. derived from the integrated spectrum of all observed H ii regions in the galaxy) in SBS 0335052W and DDO 68 are higher than that in J08114730.
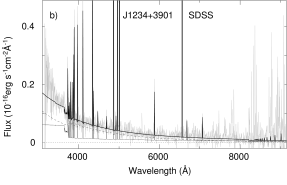
In this paper, we present LBT111The LBT is an international collaboration among institutions in the United States, Italy and Germany. LBT Corporation partners are: The University of Arizona on behalf of the Arizona university system; Istituto Nazionale di Astrofisica, Italy; LBT Beteiligungsgesellschaft, Germany, representing the Max-Planck Society, the Astrophysical Institute Potsdam, and Heidelberg University; The Ohio State University, and The Research Corporation, on behalf of The University of Notre Dame, University of Minnesota and University of Virginia. spectroscopic observations of a new SFG, J12343901 (the IAU designation is SDSS J123415.69390116.4), which can also be classified as a BCD. The galaxy was selected from the SDSS Data Release 14 (DR14) data base (Abolfathi et al., 2018), based on various emission line ratios, as one of the most promising candidates for being a very low metallicity SFG with high-excitation H ii regions (see the SDSS spectrum in Fig. 1a). Its coordinates, redshift and other characteristics obtained from the photometric and spectroscopic data are presented in Table 1. For comparison, we also show in the Table similar data for the most metal-poor BCD known, J08114730 from Izotov et al. (2018a).
| Parameter | J08114730 | J12343901 |
|---|---|---|
| R.A.(J2000) | 08:11:52.12 | 12:34:15.70 |
| Dec.(J2000) | +47:30:26.24 | +39:01:16.41 |
| 0.04444 | 0.13297 | |
| GALEX FUV, mag | … | 21.240.38 |
| GALEX NUV, mag | … | 22.170.57 |
| SDSS , mag | 21.370.05 | 21.920.06 |
| WISE , mag | … | 16.990.10 |
| WISE , mag | … | 16.160.17 |
| , Mpc∗ | 198 | 650 |
| , mag† | 15.410.06 | 17.350.06 |
| log /Lg,⊙‡ | 8.350.03 | 9.120.03 |
| log /M⊙†† | 6.240.33 | 7.130.30 |
| /, M⊙/Lg,⊙ | 0.0078 | 0.0102 |
| (H), erg s-1∗∗ | (2.10.1)1040 | (4.90.3)1040 |
| SFR, M⊙yr-1‡‡ | 0.480.02 | 1.080.08 |
| 12+logO/H††† | 6.9790.019 | 7.0350.026 |
∗Luminosity distance.
†Corrected for Milky Way extinction.
‡log of the SDSS -band luminosity corrected for Milky Way extinction.
††Derived from the extinction- and aperture-corrected SDSS spectrum.
∗∗Corrected for extinction and the SDSS spectroscopic aperture.
‡‡Derived from the Kennicutt (1998) relation using the extinction- and aperture-corrected H luminosity.
†††Oxygen abundances of J08114730 (Izotov et al., 2018a) and J12343901 (this paper) derived from the LBT spectra.
The LBT observations of J12343901 and data reduction are described in Sect. 2. We derive its element abundances in Sect. 3. Integrated characteristics of J12343901 are presented in Sect. 4. In Sect. 5 we discuss the origin of the hard ionizing radiation responsible for the strong He ii 4686 emission line. The possibility of Lyman continuum leakage in J12343901 is considered in Sect. 6. We summarize our main results in Sect. 7.


2 LBT Observations and data reduction
We have obtained LBT long-slit spectrophotometric observations of J12343901 on 6 June, 2018 in the twin binocular mode using the MODS1 spectrograph222This paper used data obtained with the MODS spectrographs built with funding from NSF grant AST-9987045 and the NSF Telescope System Instrumentation Program (TSIP), with additional funds from the Ohio Board of Regents and the Ohio State University Office of Research.. As for MODS2, due to a technical problem with the CCD of the red channel, observations were executed only with the blue channel. Spectra were obtained in the wavelength range 3200 – 10000Å with a 1.2 arcsec wide slit, resulting in a resolving power 2000. The seeing during the observations was 0.6 arcsec. The angular size of J12343901 as measured by the Full Width at Half Maximum of the Point Spread function is 1.28 arcsec. Thus the LBT slit width should include most of the light of the galaxy. We will discusss this issue more quantitatively in Section 4.
Four 900 s subexposures were obtained in the blue range separately with MODS1 and MODS2, resulting in a total exposure time of 23600 s, counting both spectrographs. In the red range, three 900 s subexposures were obtained with the MODS1, resulting in the total exposure of 2700 s. The airmass during observations was in the range 1.05 – 1.15. Thus, the effect of atmospheric refraction is small for all subexposures (see Filippenko, 1982).
The spectrum of the spectrophotometric standard star GD 153 was obtained during the same night with a 5 arcsec wide slit for flux calibration and correction for telluric absorption in the red part. Additionally, calibration frames of biases, flats and comparison lamps were obtained during the same period with the same setups of MODS1 and MODS2.
The MODS Basic CCD Reduction package modsccdred333http://www.astronomy.ohio-state.edu/MODS/Manuals/ MODSCCDRed.pdf and iraf444iraf is distributed by the National Optical Astronomy Observatories, which are operated by the Association of Universities for Research in Astronomy, Inc., under cooperative agreement with the National Science Foundation. were used for bias subtraction, flat field correction, wavelength and flux calibration. After these reduction steps, MODS1 and MODS2 subexposures in the blue part of the spectrum and MODS1 subexposures in the red part were combined. The one-dimensional spectrum of J12343901 extracted in a 1.2 arcsec aperture along the spatial axis is shown in Fig. 1c and 1d. Strong emission lines are present in the spectrum, suggesting active star formation. In particular, a strong [O iii] 4363 emission line is detected with a signal-to-noise ratio much higher than in the SDSS spectrum (compare insets in Fig. 1a and Fig. 1c), allowing reliable abundance determinations. The another notable feature detected in both the SDSS and LBT spectra is the He ii 4686 emission line (Fig. 1c), implying the presence of hard ionizing radiation with energy above 4 Ryd. We also note that the weak [N ii]6584 emission line is not detected in the LBT spectrum because of insufficient signal-to-noise ratio (see inset in Fig. 1d). This fact precludes the determination of the nitrogen abundance. On the other hand, weak broad wings of H are present (see inset in Fig. 1d), indicating fast moving ionized gas in J12343901 with a velocity dispersion 850 km s-1. However, this estimate is somewhat uncertain because of the low intensity of the broad H emission line and a noisy continuum.
| Line | SDSS | LBT |
|---|---|---|
| 3187.74 He i | … | 1.930.24 |
| 3703.30 H16 | … | 1.280.17 |
| 3711.97 H15 | … | 2.630.40 |
| 3721.94 H14 | … | 0.950.11 |
| 3727.00 [O ii] | 11.742.38 | 12.760.45 |
| 3734.37 H13 | … | 1.510.13 |
| 3750.15 H12 | … | 4.620.42 |
| 3770.63 H11 | … | 5.720.43 |
| 3797.90 H10 | 6.392.45 | 6.750.43 |
| 3819.64 He i | … | 1.080.11 |
| 3835.39 H9 | 7.012.33 | 7.870.41 |
| 3868.76 [Ne iii] | 15.792.56 | 12.770.44 |
| 3889.00 He i+H8 | 20.763.20 | 17.700.63 |
| 3968.00 [Ne iii]+H7 | 21.593.27 | 20.160.71 |
| 4026.19 He i | … | 1.590.14 |
| 4101.74 H | 25.793.38 | 26.030.85 |
| 4227.20 [Fe v] | … | 0.660.21 |
| 4340.47 H | 45.454.60 | 46.371.40 |
| 4363.21 [O iii] | 6.941.88 | 7.730.29 |
| 4471.48 He i | 3.191.50 | 3.820.19 |
| 4685.94 He ii | 3.031.51 | 2.420.20 |
| 4712.00 [Ar iv]+He i | … | 1.870.17 |
| 4740.20 [Ar iv] | … | 1.730.17 |
| 4861.33 H | 100.007.58 | 100.002.89 |
| 4958.92 [O iii] | 64.955.48 | 68.402.01 |
| 5006.80 [O iii] | 187.0612.4 | 197.005.74 |
| 5875.60 He i | 10.661.91 | 10.090.50 |
| 6562.80 H | 272.0718.9 | 271.298.48 |
| 6678.10 He i | 4.091.23 | 2.430.33 |
| 7065.30 He i | 5.101.30 | 3.850.41 |
| (H)† | 0.0000.083 | 0.0000.037 |
| (H)‡ | 10.930.58 | 9.740.28 |
| EW(H)∗∗ | 276.014.5 | 242.21.0 |
| EW(abs)∗∗ | 0.42.4 | 2.70.4 |
∗in units 100/(H).
†Extinction coefficient, derived from the observed hydrogen
Balmer decrement.
‡Observed flux in units of 10-16 erg s-1 cm-2.
∗∗Equivalent width in Å.
| Property | SDSS | LBT |
|---|---|---|
| (O iii), K | 211003700 | 21900600 |
| (O ii), K | 156002500 | 15600400 |
| (S ii), cm-3 | 1010 | 1010 |
| O+/H+106 | 0.9390.425 | 1.0320.077 |
| O2+/H+105 | 0.9690.382 | 0.9500.064 |
| O3+/H+106 | 0.2360.162 | 0.3130.054 |
| O/H105 | 1.0860.385 | 1.0850.065 |
| 12+log(O/H) | 7.0360.154 | 7.0350.026 |
| Ne2+/H+106 | 1.7700.691 | 1.3220.087 |
| ICF(Ne) | 1.046 | 1.053 |
| Ne/H106 | 1.8520.775 | 1.3920.100 |
| log(Ne/O) | 0.7680.238 | 0.8920.041 |
The observed emission-line fluxes and their errors in both the SDSS and LBT spectra were measured using the iraf splot routine. Following Izotov et al. (1994) they were corrected for extinction and underlying stellar absorption, derived from the observed decrement of the hydrogen Balmer emission lines. The equivalent widths of the underlying stellar Balmer absorption lines are assumed to be the same for each line. The fluxes corrected for extinction (all lines) and underlying stellar absorption (hydrogen lines) are shown in Table 2 for both the SDSS and LBT observations. The Table also includes the extinction coefficient (H), the observed H emission-line flux (H), the rest-frame equivalent width EW(H) of the H emission line, and the equivalent width of the Balmer absorption lines. Within the errors, the derived extinction (H) /2.1 (Aller, 1984) is zero (Table 2). This null value is consistent with the low Milky Way extinction = 0.042 mag (NASA Extragalactic Database) and implies a very low internal galaxy extinction, likely due to the very low metallicity of J12343901. A similar conclusion can be made for J08114730 with the lowest luminosity-weighted oxygen abundance known (Izotov et al., 2018a). Its internal extinction = 0.167 mag is smaller than the Milky Way extinction = 0.180 mag. Low 0.5 mag are typical for low-redshift compact SFGs (Izotov et al., 2014; Guseva et al., 2017). We finally note that the EW(H) in J12343901 is high, 276Å in the SDSS spectrum and 242Å in the LBT spectrum, implying that its optical emission is dominated by radiation from a very young starburst, with age 3 Myr.
3 Heavy element abundances
The procedures described by Izotov et al. (2006a) are used to determine heavy element abundances from the SDSS and LBT spectra. The temperature (O iii) is calculated from the [O iii] 4363/(4959 + 5007) emission-line flux ratio. It is used to derive the abundances of O3+, O2+ and Ne2+. The abundance of O+ is derived with the electron temperature (O ii), using the relations of Izotov et al. (2006a) between (O ii) and (O iii). These relations have been obtained from the ionization-bounded H ii region models of Stasińska & Izotov (2003), assuming the low-density limit, when collisional de-excitation from upper levels of forbidden transitions is unimportant (e.g. Aller, 1984), and adopting the stellar evolution models of Meynet et al. (1994) and the stellar atmosphere models of Smith, Norris & Crowther (2002). To check the integrity of our (O ii) – (O iii) relations, we have also derived relations using as input the cloudy v17.01 H ii region models of Ferland et al. (2017). The resulting relations are very similar to the ones obtained by Izotov et al. (2006a). We note that in the particular case of J12343901, the fraction of O+ ions is one order of magnitude lower than that of O2+ ions because of the very high O32 ratio (see Section 6). Therefore, uncertainties of (O ii) of 10 per cent will result in uncertainties of oxygen abundances 0.01 dex. The [S ii] 6717, 6731 emission lines are not detected and the [O ii]3726, 3729 emission lines are not resolved in both the SDSS and LBT spectra. Therefore, the electron number density (S ii) cannot be determined from the spectra. We adopted it to be 10 cm-3. The precise adopted value does not influence the determinations of oxygen and neon abundances because they do not depend sensitively on for typical electron number densities of 103 cm-3 in H ii regions (e.g. Aller, 1984).
The total oxygen abundance is derived as follows:
| (1) |
where the abundances of ions O+, O2+, O3+ are obtained using the relations of Izotov et al. (2006a). For neon, we also use the relations of Izotov et al. (2006a) to derive the Ne2+ abundance, the ionization correction factor ICF(Ne) and the total Ne abundance.
The electron temperatures, electron number densities, ionic abundances, ionization correction factors and total O and Ne abundances are presented in Table 3. The electron temperatures (O iii) of 21900 600 K derived from the LBT spectrum and of 21100 3700 K derived from the SDSS spectrum are high. This is a consequence of the very low metallicity of J12343901.
The nebular oxygen abundance of 12+logO/H = 7.0350.026 derived from the LBT spectrum is among the lowest found for SFGs. A similar value was obtained from the SDSS spectrum, although with a higher error because of the lower signal-to-noise ratio. The Ne/O abundance ratio for this galaxy (Table 3), is similar to that in other low-metallicity SFGs (e.g., Izotov et al., 2006a).
4 Integrated characteristics of J12343901
The stellar mass, absolute magnitudes and luminosities of J12343901 are derived adopting the luminosity distance = 650 Mpc, obtained from the galaxy redshift for the cosmological parameters = 67.1 km s-1 Mpc-1, = 0.318, = 0.682 (Planck Collaboration XVI, 2014) and assuming a flat geometry.
The absolute SDSS magnitude, corrected for the Milky Way extinction is = 17.35 mag (Table 1). Thus, J12343901 is the most luminous BCD known with 12 + logO/H 7.3. Like most other extremely metal-deficient SFGs, it strongly deviates from the luminosity – metallicity relation defined by the bulk of the SDSS SFGs, (e.g. see fig. 5 in Izotov et al., 2018a).
The star-formation rate (SFR) in J12343901, derived from the SDSS H luminosity (Table 2) using the Kennicutt (1998) calibration is equal to 1.1 M⊙ yr-1.
The stellar mass of J12343901 is determined from fitting the spectral energy distribution (SED). According to the SDSS database, the Petrosian radius within which 90 per cent of the galaxy’s light in the SDSS band is contained, is equal to 1.06 arcsec. Therefore, for SED fitting, we have used the SDSS spectrum obtained with a round 2 arcsec aperture which contains most of the galaxy’s light, instead of the LBT spectrum obtained with a narrow 1.2 arcsec slit. Some light is missed in the case of the latter, as evidenced by the lower observed H flux (Table 2). The difference in the EW(H)s of the LBT and SDSS spectra can also be explained by an aperture effect. Assuming that the central ionizing cluster is inside both the SDSS and LBT apertures, but some H flux is outside the LBT slit, we should correct the EW(H) of 242.2 Å in the LBT spectrum by a factor 10.93/9.74, the ratio of the H fluxes in the SDSS and LBT spectra. We obtain 271.8 Å which agrees well, within the errors, with the observed value of the EW(H) in the SDSS spectrum.
To carry out the SED fitting, we calculated a grid of SEDs for instantaneous burst models in the age and heavy element mass fraction ranges of 1 Myr – 10 Gyr and = 0.0004 – 0.02, respectively. We use starburst99 models (Leitherer et al., 1999) and adopt stellar evolution models by Girardi et al. (2000), stellar atmosphere models by Lejeune, Buser & Cuisiner (1997) and the Salpeter (1955) initial mass function (IMF) with lower and upper mass limits of 0.1 M⊙ and 100 M⊙, respectively.
Because the equivalent width of the H emission line is high (Table 2), the contribution of the nebular continuum should be taken into account in the SED fitting, in addition to the stellar emission. The nebular continuum was calculated adopting the electron temperature derived from the galaxy emission-line spectrum. The fraction of the nebular continuum flux in the total continuum flux near the H emission line is determined by the ratio of the observed equivalent width EW(H) to the H equivalent width of 900 – 1100Å (the precise value depends on the electron temperature) for pure nebular emission. The star-formation history in J12343901 was approximated by a recent short burst at age 10 Myr and a prior continuous star formation with a constant SFR during the time interval – with , 10 Myr and . Finally, the total (stellar+nebular) SED is scaled to the observed continuum flux near H. We use a Monte Carlo method with minimization, varying , , and the mass fraction of stellar populations formed during the burst and after the age of 10 Myr, and aiming to obtain the best agreement between the modelled and observed continuum in the entire wavelength range of the SDSS spectrum. Additionally, the observed EW(H) and EW(H) have to simultaneously be reproduced within 10 per cent of their values by the best model. More details on the SED fitting procedure can be found e.g. in Izotov et al. (2018a).
The SDSS spectrum superposed by the modelled stellar, nebular and total SEDs is shown in Fig. 1b. Despite the noisy data, the model SED reproduces reasonably well the observed SDSS spectrum, including the region shortward of the Balmer jump at 3660Å. We obtain a low stellar mass for J12343901, = 107.13±0.30 M⊙ (Table 1). This yields in turn a very high specific star formation rate sSFR of 100 Gyr-1, indicative of very active ongoing star formation.
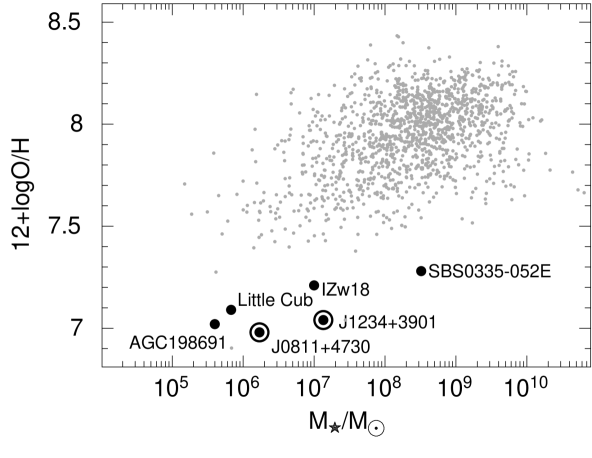
In Fig. 2 we show the mass – metallicity relation for low-redshift SFGs. It is seen that both J08114730 and J12343901 strongly deviate from the general relation defined by the bulk of the compact SFGs in the SDSS DR14 (grey dots) with oxygen abundances determined reliably by the direct method. These two galaxies are 3 – 5 times more metal-poor for their stellar masses. They are also more extreme compared to other very metal-deficient SFGs found in the literature and shown by filled circles.
Using and deriving the -band luminosity from the relation
| (2) |
where = 5.45 is the absolute -band magnitude of the Sun (Blanton et al., 2003), we obtain the very low mass-to-luminosity ratio of 0.01 (in solar units). This is more than one order of magnitude lower than the average value for SDSS SFGs, but similar to the one derived for the lowest-metallicity BCD known, J08114730 (Table 1, Izotov et al., 2018a). This / value is consistent with the value for a stellar population with age 10 Myr (Leitherer et al., 1999, 2014; Izotov et al., 2018a), indicating that the emission of J12343901 in the optical range is dominated by young massive stars with a negligible contribution of older stars, and possibly supporting the idea that this SFG is a young galaxy having formed most of its stars only very recently.
5 The origin of the hard ionizing radiation in J12343901
An important feature of the J12343901 spectrum is the presence of a strong narrow nebular He ii 4686 emission line (Table 2). A similarly strong He ii 4686 emission line was detected by Izotov et al. (2018a) in the spectrum of the lowest-metallicity BCD known J08114730. This line is seen quite often in low-metallicity SFGs (e.g. Thuan & Izotov, 2005; Shirazi & Brinchmann, 2012), but very rarely with a flux above 2 per cent that of H, as is the case for the two above BCDs. Its origin remains unclear. Several mechanisms have been proposed for the creation of hard ionizing radiation with energy above 4 Ryd, responsible for the production of He2+ ions followed by recombination He ii emission. In particular, Izotov, Thuan & Privon (2012b) have examined X-ray emission from AGN and high-mass X-ray binaries. Although these cannot be ruled out as sources of hard ionizing photons, they are considered to be unlikely for the majority of low-mass galaxies with active ongoing star formation. The most favoured mechanisms are extreme UV (EUV) radiation from hot massive stars and from relatively fast radiative shocks, as discussed below.
5.1 Stellar radiation
At the moment, the role of stellar radiation in the production of He ii emission remains controversial. While e.g. Shirazi & Brinchmann (2012), based on the starburst99 population synthesis models, have suggested that hard radiation is produced by a Wolf-Rayet stellar population in young starbursts with age 4 – 5 Myr, Guseva, Izotov & Thuan (2000) and Thuan & Izotov (2005) have argued for another mechanism, since no WR features were detected in most of the low-metallicity He ii-emitting galaxies with 12 + logO/H 8.0.
One of the most studied He ii emitters is the BCD SBS 0335052E with an oxygen abundance 12 + logO/H = 7.30. This galaxy is also the lowest-metallicity SFG with detected [Ne v] emission which requires the presence of even harder radiation, with energy above 7 Ryd. Izotov, Chaffee & Schaerer (2001), Thuan & Izotov (2005) and Izotov et al. (2006b) have discussed the origin of He ii and [Ne v] emission in SBS 0335052E. It was found that the He ii emission is spatially distinct from its hydrogen H and H emission and broader, suggesting that the main source of hard radiation in that BCD is not stars but more likely radiative shocks. Observations of [Ne v] emission in other SFGs (Izotov et al., 2004, 2012b) support and strengthen the radiative shock hypothesis.
Recently Kehrig et al. (2018) have reconsidered the origin of the He ii 4686 emission in SBS 0335052E. To study the role of stellar radiation in producing He ii emission, they adopted a set of stellar population synthesis models by Eldridge et al. (2017) called Binary Population and Spectral Synthesis or bpass v2.1 models. These are different from e.g. the starburst99 models (Leitherer et al., 1999, 2014) in that they include binary stellar evolution. Those authors found that the He ii emission of SBS 0335052E can only be produced by either single, rotating metal-free stars or a binary population with 10-5 and a ’top-heavy’ IMF. A difference between the assumed stellar and observed interstellar medium (ISM) metallicities of several orders of magnitude does not appear to be reasonable, even for the most metal-deficient galaxies known, J08114730 and J12343901. Furthermore, Kehrig et al. (2018) did not discuss the presence of [Ne v] emission in SBS 0335052E which requires an even harder ionizing radiation than He ii emission.
Below we consider the lowest-metallicity bpass v2.1 stellar models to assess the role these models play in the production of He ii emission in the particular cases of J08114730 and J12343901.
We use the cloudy v17.01 model calculations (Ferland et al., 2017) in conjunction with the bpass v2.1 stellar models with = 10-3, 10-4 and 10-5, the ionization parameter in the range 10-3.0 – 10-1.6, and an ISM oxygen abundance 12 + logO/H = 7.0, to calculate the temporal evolution of the He ii 4686/H emission line ratio (Fig. 3a).
It is seen that binary evolution considerably increases the He ii 4686 emission line intensity, producing two maxima at = 6 and 20 Myr. However, only models with = 10-5 are able to produce He ii 4686/H 1 per cent. But even these peak values are considerably lower than those observed in J08114730 and J12343901 (shaded horizontal region). We note that the He ii 4686/H flux ratio is nearly independent of . We also note that cloudy models with bpass v2.1 population synthesis models calculated for a population of single stars or with starburst99 models predict a very low He ii 4686 line intensity, 0.1 per cent that of H.
Adopting a top-heavy IMF, i.e. changing the IMF slope from the Salpeter value = 1.35 (Salpeter, 1955) to = 1, and/or increasing the upper mass limit from = 100 M⊙ to 300 M⊙, will change the model predictions in Fig. 3a, but by not more than 10 per cent. Thus, we conclude that stellar radiation is unlikely to be the main source of hard ionizing photons for the production of high-ionization lines.

5.2 Radiative shocks
Izotov et al. (2012a) have suggested that interstellar radiative shocks with velocities of 300 – 500 km s-1 can produce sufficient extreme UV ionizing radiation to reproduce observed He ii 4686/H emission-line ratios of 2 – 3 per cent.
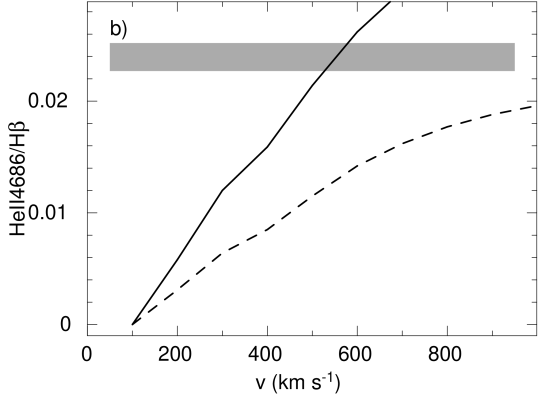
To further investigate this possibility, we consider a set of spherically-symmetric composite cloudy v17.01 models, adopting ionizing radiation consisting of two components: a) radiation of a single stellar population with age 2 Myr, with a production rate of ionizing photons = 1053 s-1 corresponding to the average H luminosity of the two studied galaxies, and with various metallicities, calculated with the starburst99 code by using Geneva evolutionary tracks of non-rotating stars; and b) radiation from radiative shocks coincident with the source of stellar radiation, with various shock velocities and the lowest metallicity available, that of the Small Magellanic Cloud, calculated by Allen et al. (2008). We set, somewhat arbitrarily, the production rate of ionizing photons from shocks to be 5 – 10 per cent of the production rate of ionizing stellar photons . The ionization parameter averaged over the H ii region volume is varied in the range 10-3.0 – 10-1.6, the same range as for the models discussed in Sect. 5.1. Our models correspond to the case when shocks propagate through the ionized medium of the H ii region, different from the Allen et al. (2008) calculations who considered propagation of shocks through the neutral medium.
In Fig. 3b we show the dependence of the He ii 4686/H emission-line ratio on the shock velocity for two composite models, with / = 5 per cent (dashed line) and 10 per cent (solid line). The shaded region shows the range of He ii 4686/H for J08114730 and J12343901. In contrast to the models with pure stellar ionizing radiation (Fig. 3a), the composite model with / = 10 per cent can quite succesfully reproduce observations for shock velocities of 500 – 600 km s-1.
Kehrig et al. (2018) discussing the origin of He ii 4686 emission line in SBS 0335052E dismissed radiative shocks as a source of this emission, citing the models by e.g. Allen et al. (2008) which predict enhanced [O i] 6300 and [S ii] 6717, 6731 emission lines compared to those observed in SBS 0335052E. However, this argument is not convincing because Allen et al. (2008) considered shocks propagating through a neutral ISM, while shocks in SBS 0335052E most likely propagate through an ionized medium. The H ii region extends to 1 – 2 kpc from the ionizing clusters, and both the oxygen and sulfur in it are in stages of ionization higher than neutral oxygen and singly ionized sulfur. Applying the composite models above to the SFGs J08114730 and J12343901, we find that radiative shocks increase at most the fluxes of the [O i] 6300 and [S ii] 6717, 6731 emission lines by 10 per cent compared to the models with pure stellar emission.
6 Can J12343901 be a Lyman continuum leaking galaxy?
It is generally thought that primeval galaxies were low-mass star-forming systems formed from zero-metallicity gas at redshifts 10. They likely were the main sources of reionization of the Universe at redshifts 5 – 10 (e.g. Ouchi et al., 2009; Karman et al., 2017). J12343901 as well as J08114730 are likely the best local counterparts of these primeval galaxies because of their compactness, low mass, extremely low metallicity and vigorous ongoing star formation.
It has been suggested by Jaskot & Oey (2013) and Nakajima & Ouchi (2014) that one of the criteria for the selection of SFGs with density-bounded H ii regions, allowing Lyman continuum escape, is a high O32 = [O iii]5007/[O ii]3727 line ratio. Both J08114730 and J12343901 have very high O32, respectively 10 and 15, implying LyC leakage.
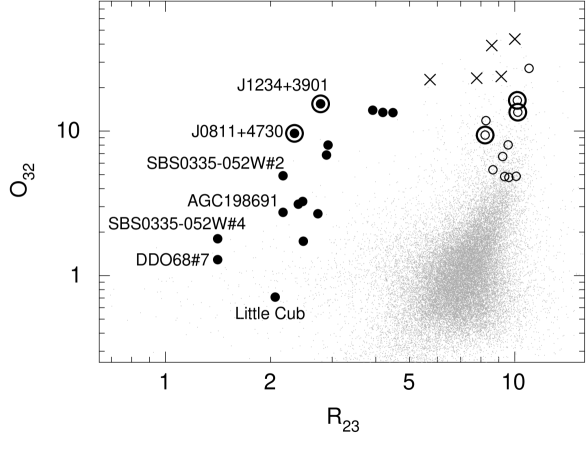
The O32 – R23 diagram (where R23 = ([O ii]3727 + [O iii]4959 + [O iii]5007)/H), including both of the two lowest-metallicity galaxies discussed here, is shown in Fig. 4. We have also plotted several other very metal-deficient local galaxies as listed in Izotov et al. (2018a) and one galaxy from Hsyu et al. (2017) (filled circles), SFGs with the highest O32 known ( 20, crosses) and 0.3 – 0.4 LyC leakers (open circles and encircled open circles). It is seen that J12343901 has the highest O32 among the lowest-metallicity galaxies with 12 + logO/H 7.3 (filled circles). Because of its extremely low metallicity, it is located very far to the left of the SFGs with highest O32 and the LyC leakers, as these have considerably higher 12 + logO/H 7.5 – 8.0. We note that both J08114730 and J12343901 have O32 similar to those for LyC leakers with the highest escape fraction of ionizing radiation ((LyC) 46 – 72 per cent) shown by encircled open circles (Izotov et al., 2018b, c). These similarities suggest that our two lowest-metallicity SFGs are likely also LyC leakers.
However, Izotov et al. (2018c) have shown that the O32 ratio is not a certain indicator of LyC leakage, because it depends also on other factors such as metallicity and ionization parameter. Furthermore, because of their low redshifts, direct observation of the ionizing radiation from these galaxies with the HST/COS is not possible. The most promising way to investigate whether J08114730 and J12343901 are LyC leakers is to use an indirect indicator, the Ly profile which can be observed with the HST. Following the analysis of Izotov et al. (2017), the presence of Ly emission is expected in both galaxies from the values of their He i 3889/6678 and He i 7065/6678 emission-line ratios, as derived from the LBT optical spectra which we have obtained for both BCDs. These ratios correspond to the case of low optical depths (3889) in the He i 3889 emission line and are similar to those in the confirmed LyC leakers with strong Ly emission (Izotov et al., 2017).
7 Conclusions
In this paper we present Large Binocular Telescope (LBT)/Multi-Object Dual Spectrograph (MODS) spectrophotometric observations of the star-forming galaxy (SFG) J12343901, selected from the Data Release 14 (DR14) of the Sloan Digital Sky Survey (SDSS). This galaxy can also be classified as a blue compact dwarf (BCD) galaxy because of its low mass, blue colour indicating active star formation and compact structure. Our main results are as follows.
1. The properties of J12343901 are extreme in many ways. Its oxygen abundance is 12+logO/H = 7.0350.026, one of the lowest for nearby SFGs. This galaxy with a redshift = 0.133 is the most distant and most luminous object known among BCDs with 12 + logO/H 7.3. Its mass-to-luminosity ratio of 0.01 in solar units is extremely low, indicating that its optical luminosity is strongly dominated by a very young stellar population. These properties are very similar to those of the most metal-deficient SFG known, J08114730 (Izotov et al., 2018a). Both galaxies deviate strongly from the luminosity-metallicity and stellar mass-metallicity relations defined by the bulk of SFGs: they are 3-5 more metal-poor for their stellar masses and about a factor of 5-8 more metal-deficient for their SDSS -band luminosities.
2. A strong He ii 4686 emission line with a flux of 2.4 per cent that of H is observed in the spectrum of J12343901. We discuss possible sources of hard ionizing radiation that can produce He ii emission and conclude that stellar ionizing radiation is insufficient. Comparing model predictions and the observed fluxes of high-ionization lines in J12343901 and the most metal-deficient SFG known J08114730, we find that the most likely source of hard ionizing radiation in these galaxies is fast radiative shocks.
3. The O32 = [O iii]5007/[O ii]3727 flux ratios of 10 and of 15 in J08114730 and J12343901, respectively, are very high. The O32 value for J12343901 is the highest among the lowest-metallicity SFGs. These properties imply that the two galaxies are likely Lyman continuum leakers and that they are the best local counterparts of high-redshift primeval SFGs.
Acknowledgements
Y.I.I. and N.G.G. acknowledge support from the National Academy of Sciences of Ukraine (Project No. 0116U003191) and by its Program of Fundamental Research of the Department of Physics and Astronomy (Project No. 0117U000240). Funding for the Sloan Digital Sky Survey IV has been provided by the Alfred P. Sloan Foundation, the U.S. Department of Energy Office of Science, and the Participating Institutions. SDSS-IV acknowledges support and resources from the Center for High-Performance Computing at the University of Utah. The SDSS web site is www.sdss.org. SDSS-IV is managed by the Astrophysical Research Consortium for the Participating Institutions of the SDSS Collaboration. This research has made use of the NASA/IPAC Extragalactic Database (NED), which is operated by the Jet Propulsion Laboratory, California Institute of Technology, under contract with the National Aeronautics and Space Administration.
References
- Abolfathi et al. (2018) Abolfathi B. et al., 2018, ApJS, 235, 42
- Allen et al. (2008) Allen M. G., Groves B. A., Dopita M. A., Sutherland R. S., Kewley L. J., 2008, ApJS, 178, 20
- Aller (1984) Aller L. H., 1984, Physics of Thermal Gaseous Nebulae (Dordrecht: Reidel)
- Annibali et al. (2019) Annibali F. et al., 2019, MNRAS, 482, 3892
- Blanton et al. (2003) Blanton M. R. et al., 2003, ApJ, 592, 819
- Eldridge et al. (2017) Eldridge J. J., Stanway E. R., Xiao L., McClelland L. A. S., Taylor G., Ng M., Greis S. M. L., Bray J. C., 2017, PASA, 34, 58
- Ferland et al. (2017) Ferland G. J. et al., 2017, Revista Mexicana de Astronomia y Astrofisica, 53, 385
- Filippenko (1982) Filippenko A. V., 1982, PASP, 94, 715
- Girardi et al. (2000) Girardi L., Bressan A., Bertelli G., Chiosi C., 2000, A&AS, 141, 371
- Guseva et al. (2000) Guseva N. G., Izotov Y. I., Thuan T. X., 2000, ApJ, 531, 776
- Guseva et al. (2017) Guseva N. G., Izotov Y. I., Fricke K. J., Henkel C., 2017, A&A, 599, A65
- Hirschauer et al. (2016) Hirschauer A. S. et al., 2016, ApJ, 822, 108
- Hsyu et al. (2017) Hsyu, T., Cooke, R. J., Prochaska, J. X., Bolte, M. 2017, ApJ, 845, L22
- Hunt et al. (2015) Hunt L. K. et al., 2015, A&A, 583, A114
- Izotov & Thuan (1998) Izotov Y. I., Thuan T. X., 1998, ApJ, 497, 227
- Izotov et al. (1994) Izotov Y. I., Thuan T. X., Lipovetsky V. A., 1994, ApJ, 435, 647
- Izotov et al. (2001) Izotov Y. I., Chaffee F. H., Schaerer D., 2001, A&A, 378, L45
- Izotov et al. (2004) Izotov Y. I., Noeske K. G., Guseva N. G., Papaderos P., Thuan T. X., Fricke K. J., 2004, A&A, 415, L27
- Izotov et al. (2005) Izotov Y. I., Thuan T. X., Guseva N. G., 2005, ApJ, 632, 210
- Izotov et al. (2006a) Izotov Y. I., Stasińska G., Meynet G., Guseva N. G., Thuan T. X., 2006a, A&A, 448, 955
- Izotov et al. (2006b) Izotov Y. I., Schaerer D., Blecha A., Royer F., Guseva N. G., North P., 2006b, A&A, 459, 71
- Izotov et al. (2009) Izotov Y. I., Guseva N. G., Fricke K. J., Papaderos P., 2009, A&A, 503, 61
- Izotov et al. (2012a) Izotov Y. I., Thuan T. X., Guseva N. G., 2012a, A&A, 546, 122
- Izotov et al. (2012b) Izotov Y. I., Thuan T. X., Privon G., 2012b, MNRAS, 427, 1229
- Izotov et al. (2014) Izotov Y. I., Guseva N. G., Fricke K. J., Henkel C., 2014, A&A, 561, A33
- Izotov et al. (2016a) Izotov Y. I., Orlitová I., Schaerer D., Thuan T. X., Verhamme A., Guseva N. G., Worseck G., 2016a, Nature, 529, 178
- Izotov et al. (2016b) Izotov Y. I., Schaerer D., Thuan, T. X., Worseck G., Guseva N. G., Orlitová I., Verhamme A., 2016b, MNRAS, 461, 3683
- Izotov et al. (2017) Izotov Y. I., Thuan T. X., Guseva N. G., 2017, MNRAS, 471, 548
- Izotov et al. (2018a) Izotov Y. I., Thuan T. X., Guseva N. G., Liss S. E., 2018a, MNRAS, 473, 1956
- Izotov et al. (2018b) Izotov Y. I., Schaerer D., Worseck G., Guseva N. G., Thuan T. X., Verhamme A., Orlitová I., Fricke K. J., 2018b, MNRAS, 474, 4514
- Izotov et al. (2018c) Izotov Y. I., Worseck G., Schaerer D., Guseva N. G., Thuan T. X., Fricke K. J., Verhamme A., Orlitová I., 2018c, MNRAS, 478, 4851
- Jaskot & Oey (2013) Jaskot A. E., Oey M. S., 2013, ApJ, 766, 91
- Karman et al. (2017) Karman W. et al., 2016, A&A, 599, A28
- Kehrig et al. (2018) Kehrig C., Vílchez J. M., Guerrero M. A., Iglesias-Páramo J., Hunt L. K., Duarte-Puertas S., Ramos-Larios G., 2018, MNRAS, 480, 1081
- Kennicutt (1998) Kennicutt R. C., Jr., 1998, Ann.Rev.Astron.Astrophys., 36, 189
- Leitherer et al. (1999) Leitherer C. et al., 1999, ApJS, 123, 3
- Leitherer et al. (2014) Leitherer C., Ekström S., Meynet G., Schaerer D., Agienko K. B., Levesque E. M., 2014, ApJS, 212, 14
- Lejeune et al. (1997) Lejeune T., Buser R., Cuisinier F., 1997, A&AS, 125, 229
- Meynet et al. (1994) Meynet G., Maeder A., Schaller G., Schaerer D., Charbonnel C., 1994, A&AS, 103, 97
- Nakajima & Ouchi (2014) Nakajima K., Ouchi M., 2014, MNRAS, 442, 900
- Ouchi et al. (2009) Ouchi M. et al., 2009, ApJ, 706, 1136
- Planck Collaboration XVI (2014) Planck Collaboration XVI, 2014, A&A, 571, A16
- Salpeter (1955) Salpeter E. E., 1955, ApJ, 121, 161
- Searle & Sargent (1972) Searle L., Sargent W. L. W., 1972, ApJ, 173, 25
- Shirazi & Brinchmann (2012) Shirazi M., Brinchmann J., 2012, MNRAS, 421, 1043
- Skillman & Kennicutt (1993) Skillman E., Kennicutt R. C. Jr., 1993, ApJ, 411, 655
- Smith et al. (2002) Smith L. J., Norris R. P. F., Crowther P. A., 2002, MNRAS, 337, 1309
- Stasińska & Izotov (2003) Stasińska G., Izotov Y., 2003, A&A, 397, 71
- Thuan & Martin (1981) Thuan T. X., Martin G. E., 1981, ApJ, ApJ, 247, 823
- Thuan & Izotov (2005) Thuan T. X., Izotov Y. I., 2005, ApJ, ApJS, 161, 240