Contact transience during slow loading
of dense granular materials
Abstract
The irregularity of particle motions during quasi-static deformation is investigated using discrete element (DEM) simulations of of sphere and sphere-cluster assemblies. Three types of inter-particle movements are analyzed: relative motions of particle centers, relative motions of material points of two particles at their contact, and the traversal of contacts across the surfaces of particles. Motions are a complex combination of rolling, sliding, and elastic distortion at the contacts, and all motions are highly irregular and variant, qualities that increase with increasing strain. The relative motions of particle centers diverges greatly from those of an affine displacement of the particles. The motions of the non-convex sphere-cluster particles was more regular that those of spheres. The paper also investigates the effect of the distance between two remote particles and their pair-wise relative displacements. Even for particle-pairs separated by more than 6 intermediate particles, the relative motions do not conform with the mean deformation (affine) field. Force chains are shown to be transient features, which survive only briefly across elapsed strains.
Granular material, micro-mechanics, discrete element method, contact mechanics, simulation.
1 Introduction
Two approaches predominate the micro-mechanical modeling of granular materials. In one approach, the grains are viewed as moving and interacting in an orderly, regular manner, respecting simple kinematic or statical fields. As an example, introductory geotechnical textbooks often represent soil failure as a continuous planar sheet of particles sliding across a facing sheet of particles, and dilation is often represented as the opening of pore space between the two sheets. Although most researchers now discount such simple views as being rudimentary, current multi-scale analyses of granular material often assume a simple spatial homogenization of the underlying micro-scale complexity and also assume that the temporal transitioning of the micro-scale landscape occurs smoothly and continuously through a continuum of states as the material undergoes bulk deformation. The loading of granular materials is now known to involve the interactions of particles that individually progress in a seemingly disordered and random fashion, but in a manner that collectively produces repeatable and consistent progressions of deformation and stress. The paper considers this second view of granular materials and quantifies the non-uniform and seemingly capricious, erratic nature of grain interactions. Whereas previous studies have primarily examined the spatial domain and have focused upon spatial irregularities and heterogeneities (shear bands, micro-bands, topological irregularities, etc.), the paper examines the temporal domain and seeks to characterize the transience of grain movements during deviatoric loading.
The paper considers the rate at which the particles interact and are rearranged during quasi-static loading, by addressing the following questions:
-
•
Is contact motion regular, and how severe is any irregularity in this motion? For example, while a pair of grains is in contact, does their point of contact shift across the surfaces of the two grains in a smooth, regular manner?
-
•
To what extent do the contact motions conform with the imposed bulk, mean deformation field? At what length scale do particle movements begin to approach compliance with the mean field?
-
•
Loading behavior is known to originate in the interactions of touching grains. How long do grains typically remain in contact? At what rate are contacts created and expired during quasi-static loading?
-
•
In a recent view of granular stress, the contacts are partitioned into two sets: those bearing a force greater than the mean (the “strong” contacts) and those that support a smaller force (“weak” contacts). What is the longevity of this partition, and how frequently do contacts pass between the two sets?
-
•
Load-bearing chains of particles, “force chains,” are the most apparent feature of force transmission within granular materials. Over what time-scale are these force chains persistent?
Many of these questions have already received attention, as will be cited below. The questions are explored with 3D discrete element simulations using assemblies of spherical particles and assemblies of non-convex particles — agglomerated clusters of spheres termed “sphere-clusters.” The quasi-static simulations reveal the non-smooth, transient, and inconstant nature of the grain motions and inter-granular forces, which occurs to a degree that is quite remarkable. We begin with a brief description of the simulation methods and recount general trends in the particle movements. We then answer, in turn, the questions posed above, quantifying the transient and irregular character of the micro-scale granular landscape. We conclude with perspectives on the results and suggestions of possible future approaches to micro-mechanical analysis.
2 DEM Methods
The discrete element method (DEM) was used to simulate the loading of two assemblies: one composed of sphere particles and the other of sphere-clusters. The clusters were formed from seven overlapping spheres, having a larger central particle and six smaller satellite particles in an octahedral arrangement (Fig. 1).
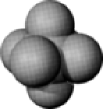
Cluster particles were used to achieve a more realistic representation of natural materials by incorporating a modest non-convexity and to compare the micro-scale behaviors of convex (sphere) and non-convex particles. These sphere-clusters can be efficiently implemented and have been shown to produce results that are very similar to those of a poorly graded natural sands composed of fine sub-rounded particles [Kuhn et al. (2014)]. The range of particle sizes was small, between 0.075 mm and 0.28 mm, with a median size of 0.165 mm. The two assemblies of 6400 particles were isotropically compacted within periodic boundaries to a medium density (void ratios of 0.576 and 0.706 for the spheres and sphere-clusters). The assemblies are large enough to capture the average material behavior but sufficiently small to prevent meso-scale localization, such as shear bands.
The contact model was a full implementation of a Hertz-Mindlin contact between elastic-frictional spheres by using the Jäger algorithm, which can model arbitrary sequences of normal and tangential contact movements [Kuhn (2011)]. The simulations were conducted with an inter-particle friction coefficient , particle shear modulus GPa, and Poisson ratio .
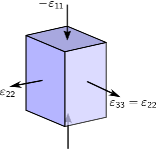
The two assemblies started with an initial isotropic arrangement of particles, confined with an isotropic stress of 100 kPa. The assemblies were then monotonically loaded under triaxial conditions in which the assembly height (in direction ) was reduced at a constant slow rate () while maintaining a constant mean stress by adjusting the transverse, horizontal widths in directions and , with . These conditions are represented in Fig. 2a.


daCruz:2005a classify granular flows in three regimes, depending upon the rapidity of deformation: quasi-static (slow), collisional, and an intermediate, dense regime of flow. The current simulations are quasi-static, with an inertial number of less than 0.0003. The internal kinetic energy of the assembly during loading was consistently less than 3% of the internal elastic energy throughout the simulation, and the internal kinetic energy was less than 0.3% of the work expended in frictional sliding for each 1% of strain. The particles remained in near-equilibrium throughout the simulations, with an average imbalance of force that was less than 2% of the average contact force.
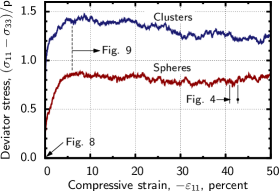
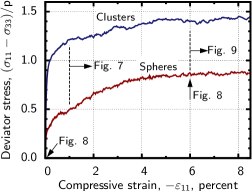
Figure 3 shows the stress-strain behavior of the assemblies. As expected, the assemblies of non-convex sphere-clusters are considerably stronger and stiffer than the sphere assemblies (peak angles of internal friction of 22.7∘ and 36.4∘ respectively).
3 Grain Motions
In recent work by the author on the loading of granular media, the averaged contact motions were found to follow a regular trend during bulk deformation: contacts tend to migrate from orientations in which the principal strain is compressive and toward orientations of extensional principal strains [Kuhn (2010)]. That is, if one considers all contact orientations as populating the unit sphere, the contacts are, on average, conveyed from directions of compressive strain toward directions of extension. For the triaxial compression constant-mean-stress conditions of the current simulations (Fig. 2a), the general motion of contacting particle pairs is a tangential shifting of the contacts’ normal vectors from the compression direction (in Fig. 2b, the north-south and directions) toward the transverse directions of expansion (toward the – equator in Fig. 2b). As will be seen, the individual contact motions are quite diverse — nearly erratic — and short-lived, to the extent that this model of general contact conveyance is only revealed by averaging the motions of thousands of contacts. The paper focuses, instead, on the diverse, fleeting, and transitory aspect of granular motion.
We will characterize the nature and diversity of contact movements in three respects,
-
(a)
as relative movements of the centers of particles that form contacting pairs, since these movements are the micro-mechanical source of bulk strain [Bagi (1996), Satake (2004)],
-
(b)
as the relative movements of particles’ material points in the vicinities of their contacts, since these movements are the source of the evolving contact forces and of the bulk stress and stiffness [Christoffersen et al. (1981), Satake (2001)], and
-
(c)
as movements of the contact points (actually of the contact zones) migrating across the surfaces of particles. Advanced theories of friction acknowledge the effects of sliding distance, sliding rate, and heat generation and the interaction of rolling and sliding, matters that arise from migrations across contacting surfaces [Di Toro et al. (2004), Rice (2006), Kuhn (2014b)].
These three movements are designated as , , and in the following derivations.
Consider two particles, and , that touch at contact . If the particles are rigid, the relative incremental movement of points on either side of the contact (of material points in relative to those in ) is
| (1) |
where and are the rotation increments of the two particles; and are vectors that join the centers of each particle to the contact point; and is the increment of relative movement of the two particles’ centers:
| (2) |
with and being the separate movements of each particle’s center.
If the particles were truly rigid, an arbitrary increment could produce inter-penetration at the contact. In contrast, an elastic Hertz contact between deformable spherical bodies produces deformation in the contact vicinity, so that contact occurs within a circular patch on each surface, with the radius of this patch dependant on the normal force. According to Cattaneo-Mindlin theory, a modest tangential contact motion produces micro-slip inside of an annular peripheral zone within the contact patch, even as the particles frictionally adhere within the central portion of the patch. With greater movement, the tangential contact force reaches the frictional limit, and the center of the contact patch can then move (slip) across the surfaces of the two particles. In this regard, the rigid increment can be separated into two parts: one corresponding to rigid slip (and movement of the contact patch) and the other an elasto-plastic (or elasto-frictional) increment that produces deformation within the particle bodies and micro-slip within the contact patch,
| (3) |
noting that slip movement is possible only when the frictional limit is reached: when the magnitude of tangential force reaches the product of the normal force and the friction coefficient .
We can also separate each increment in Eq. (3) into motions that are normal and tangential to the contact plane, denoted with “n” and “t” superscripts:
| (4) |
where is the unit normal, directed outward from . Note that the slip motion in Eq. (3) is entirely tangential.
Besides movement , other types of motion can also cause the contact patch to migrate across the particles. Twelve components of motion are available to the two particles (three components of rotation and displacement for each particle), and only three components are expressed in the objective motion . Six additional components are associated with non-objective, rigid-body motions [Kuhn and Bagi (2005)]. Of the three remaining objective motions, two are associated with the contact rolling that occurs within the contact’s tangential plane, and these two rolling components can cause the contact patch to shift across the particles’ surfaces.
The rolling of two rigid particles depends upon their movements and upon the local shapes of their surfaces at the contact [Kuhn and Bagi (2004)]:
| (5) |
where and are the surfaces’ curvature tensors. As two rigid particles roll and slide, they trace paths across each of their surfaces. The rolling increment is simply the average increment of two traced paths: the average of increment across the surface of , and of increment across , where the are the unit directions of these traced paths within the contact’s tangent plane and the are the increments’ magnitudes. In a complementary manner, the rigid increment of Eq. (1) is simply the difference , such that the movement of the contact point across the rigid particle is
| (6) |
Applying Eq. (3) for deformable particles, the corresponding movement is
| (7) |
The movement in parentheses is the movement of the center of the contact patch across the surface of ; whereas, movement is produced by deformation (within particle and in the contact’s vicinity) due to frictional adhering. Although rarely incorporated in DEM simulations (including the current simulations), the contact force is influenced by both and , as an amalgam of sliding friction and rolling friction [Kuhn (2014b)].
We will later compare the movements at individual contacts with those that would occur if the particles conformed perfectly with the bulk deformation field. This hypothetical, “ideal” (affine or mean-field) movement is designated as and can also be expressed in its normal and tangential components:
| (8) | |||
| (9) |
where is the bulk Eulerian strain increment (possibly at large strains) computed from the displacement gradient: . The tangential component of this ideal movement is aligned with the general direction of contact conveyance during the bulk deformation, as was described at the start of this section.
As an example, Fig. 4 shows the movement of a single contact between two spheres recorded during DEM simulations of triaxial compression (described in the DEM section and with Fig. 2). This contact was one of about 8500 contacts within the assembly.
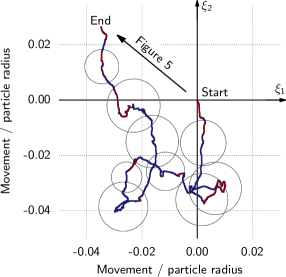
The two particles touched when the bulk strain was 40.9% and separated at a bulk strain of 42.7%. As will be seen in the next section, the longevity of this particular contact () was greater than most contacts; but in other respects, this contact was similar to most of the contacts in the sphere simulation. Figure 4 shows the tangential movement of the contact patch, the motion , across the surface of one of its particles (say ), projected onto a – plane (Fig. 2c). The direction corresponds to the direction of general contact conveyance (i.e., the direction of in Eq. 92). For triaxial compression in the direction, the direction is aligned along meridians (the north–south meridians in Fig. 2c), such that contacts with an orientation in the “northern hemisphere” of the unit sphere (i.e. ) have directed southward toward the equator. For contacts in the southern hemisphere (i.e. ), is directed northward.
As is typical of most contacts, the contact in Fig. 4 is seen to wander in a seemingly erratic manner across the surface of the particle, with much of the motion in a direction contrary to that corresponding to bulk deformation (i.e., contrary to the mean-field direction of positive ). The contact movement has been normalized by dividing by the radius of the particle, so that the movement of this one contact can be compared with the bulk strain. If fully unfolded, the normalized length of this contact’s path is 0.256, more than 14 times greater than the elapsed strain of only 0.018. That is, when viewed at the micro-scale of contact interactions, the migration activity of this contact is much more vigorous than the bulk deformation. The circles in the figure show sizes of the contact patch, which is seen to expand and contract as the contact migrates, corresponding to a growing and diminishing normal force. Migration of the patch occurs during periods of slip (shown in red) and also while the contact is not undergoing slip (shown in blue). Frictional slip is seen repeatedly to start and stop, occurring in a sporadic, fitful sequence of slip episodes. No aspect of this contact’s behavior is regular: force and movement progress in an irregular, desultory fashion with numerous periods both of slow, lingering movement and of darting, rapid movement.
The general trend of this contact’s motion is indicated by the arrow in Fig. 4 (this contact lies in the southern hemisphere, and its general trend is in the southwest direction, contrary to the northern direction of general conveyance, see Fig. 2b). Figure 5 shows a projection of the contact motions in the general direction of the arrow in Fig. 4.
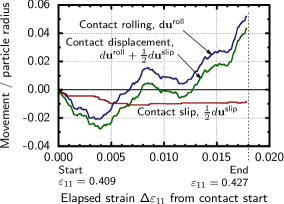
The migration of this contact patch is a sum of its rolling and slip motions (Eq. 7), which are shown separately in the figure. Although rolling occurs in a wandering manner throughout the life-time of this contact, slip is seen to occur intermittently, sometimes slipping “forward” and sometimes slipping in the “reverse” direction. Oddly, slip and rolling often occur in opposite directions: at times, the contact is seen to be rolling forward while slipping backward.
The results for this one contact suggest considerable diversity in particle movements, and we now consider the motions of a large set of contacts within the assembly. Figure 6 illustrates the range and nature of motions in the assembly of spheres shortly after the start of loading, at strain .
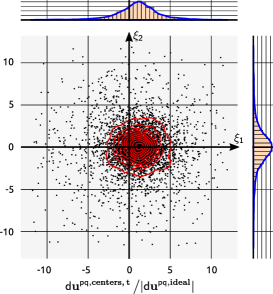
The figure shows the results for the subset of 4630 contacts that lie within the latitudes of 20∘ and 70∘, for reasons that are given below. The scatter plot presents the relative tangential motions of the centers of contacting particles, , as in Eq. (2). In this figure, the motions are projected onto the – tangential plane, with the positive direction corresponding to the expected direction of contact conveyance (Fig. 2c). The movements have also been normalized by dividing by the magnitudes of the tangential movements that would occur if the pairs of particles had complied perfectly with the bulk deformation field (the distance , as in Eq. 92); that is, the movement at each contact has been divided by the corresponding quantity , which is the magnitude of movement if the two particles conformed to the mean, uniform deformation field (i.e. affine motion). If every particle complied with the mean field, all values would lie at the single point in the – plane. Because the magnitude of the ideal motion approaches zero at the poles and at the equator (i.e., when any of the components is close to zero, Fig. 2b), we restrict Fig. 6 to the subset of particles that lie in the “temperate zone”, between latitudes 20∘ and 70∘ (again, Fig. 2b).
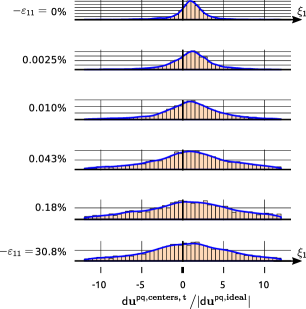
In regard to the motions of the particles’ centers (Fig. 6), the movements are quite varied and can diverge greatly from the mean field. Even at the very small strain presented in the scatter plot (), some particles move at rates many times faster than those of the mean field and in directions that depart from the ideal direction (positive in the figure), with many moving in the the opposite, “wrong” direction. The density plots on the right of Fig. 6 show the distribution of contact motions in the direction, and we see that the diversity of motion increases with increasing strain. At both small and large strains, we can discern a slight bias in the contact motions toward the direction of positive , which is the direction of general particle conveyance, but this bias (of about 1) is small when compared with the dispersion of the motions and can only be distinguished by examining several thousands of contacts.
The variable nature of the tangential contact motions is also displayed in Table 1 for the assemblies of spheres and of non-convex sphere-clusters, at both small and large strains and for various types of motion. The table gives the standard deviations of various particle motions, after they have been normalized by dividing by the reference tangential motion . Only contacts with orientations between latitudes 20∘ and 70∘ are reported in the table.
| Particle shape | |||
| Sphere- | |||
| Spheres | clusters | ||
| Small strains () | |||
| Eq. (1) | 7.4 | 5.4 | |
| Eq. (2) | 5.9 | 5.4 | |
| Eq. (5) | 14.4 | 1.9 | |
| Eq. (6) | 14.7 | 2.4 | |
| Large strains () | |||
| Eq. (1) | 15.4 | 7.5 | |
| Eq. (2) | 9.7 | 7.9 | |
| Eq. (5) | 39.4 | 5.1 | |
| Eq. (6) | 40.3 | 6.9 | |
The most evident finding is that all types of contact motion are highly varied and far more vigorous than that of the mean-field motion, with quite large standard deviations (to compare, the mean of the movements is approximately 1.0), and the dispersion of the contact movements increases with increasing strain. Notably, the dispersion was considerably smaller among non-convex particles than among spheres, and this reduced movement was most pronounced for the rolling motions between non-convex particles. Non-convex particles can touch at multiple points, and the contact forces among multiple contacts produce resistive couples which can suppress particle rotation. The reduced dispersions of the sphere-cluster movements is most marked in the dispersions of the rolling movements and of the contact migrations , which were much smaller for the non-convex sphere-clusters than for the spheres (the sphere values of 10 and larger are quite extreme).
We also note that the dispersion in the tangential contact movements, , from which the contact forces and bulk stress originate, was usually smaller than the dispersion in the relative translations of the particle centers, . This result indicates that particle rotations (i.e., the last term in Eq. 1) tend to offset the relative translations of particles, reducing the relative movements of the particles at their contacts and abating changes in the tangential contact forces.
4 Contact Longevity
We now consider the longevity of contacts during bulk deformation, a matter also addressed by \citeNHanley:2014a. Specifically, how long do grains typically remain in contact, and at what rate are contacts created and expired during loading? To answer these questions, we recorded a journal of all contact creation and extinction events that had occurred throughout the loading process. Many contacts are brief collisional events between rattler particles, not contributing to the load-bearing network of the more persistent contacts. We identified and removed these collisional contacts from the journal, which were characterized by one of the two particles having only two or fewer contacts at the time the contact was created and having only one or zero contacts when the contact was parted. This method of identifying contact duration differs from that of \citeNHanley:2014a who, instead of creating a continuous journal, sampled the assembly at strain increments of about (their -constant simulations) and compared the contacts present in these snapshots. The current method is expected to yield smaller durations, as the journal captures multiple creation-extinction events that can occur across strains of (or less) for the same particle pair. With non-convex particles, we also distinguished between particle neighbors and particle contacts, since two neighboring (touching) particles can share multiple contacts.
| Particle shape | |||
| Sphere-clusters | |||
| Spheres | Neighbors | Contacts | |
| Initial contacts | |||
| Mean longevity | 0.019 | 0.021 | 0.012 |
| Median longevity | 0.0068 | 0.0041 | 0.0031 |
| Subsequent contact activity | |||
| Mean longevity | 0.0016 | 0.021 | 0.0020 |
| Median longevity | 0.00018 | 0.0024 | 0.00022 |
| Creation rate | 680. | 433. | 545. |
| Separation rate | 680. | 433. | 548 |
| Longevities are in terms of elapsed strains . Rates are the numbers of contacts or neighbors created (or separated) divided by the total number of contacts or neighbors, and divided by the elapsed strain . | |||
The results are summarized in Table 2 for the initial set of contacts at the start of loading and also for all contacts that were subsequently created during triaxial compression. These contact longevity values are in terms of the elapsed strain over which the particle pairs (or contacts) were touching. The median longevity (half-life) of contacts within the sphere assemblies was very brief. Half of the contacts that were initially present at the start of loading had separated after a strain of only 0.68%; whereas, half of the contacts that had formed between spheres during the subsequent loading had separated within an elapsed strain of only 0.018%. The median longevity of neighboring non-convex sphere-cluster particles is somewhat more extended, as half of the sphere-clusters that were established during loading remained as neighbors for a strain of about 0.24%. Between these neighbors, however, the possibly multiple contacts are more active, with a half-life strain of only 0.022%.
The ephemeral nature of contact is also seen in the rapid rates of their creation and separation (Table 2). The creation rate of for the sphere assembly was computed by dividing the number of contacts created during small strain intervals by the average number of contacts within these intervals and by the elapsed strain . This rate means that during an average interval of 1% strain, contacts were created for every current contact within the assembly, but a corresponding contacts also separated during the same 1% strain interval. The activity among neighbors of sphere-cluster particles is slightly more subdued: for every neighboring pair at a given strain, neighbors formed and neighbors separated during an average 1% strain interval.
These results are for slow quasi-static conditions rather than for collision-driven rapid flow. Yet even after the obviously collisional (rattler) contacts had been eliminated, these rates of contact creation and extinction demonstrate the ephemeral, transient nature of contact interactions during quasi-static loading.
5 Persistence of Strong Contacts
Recent attention has been given to the relative roles of the most heavily and the most weakly loaded contacts during deviatoric loading. Strong contacts, those contacts with a normal force that is greater than the mean, predominantly support the deviatoric stress; whereas, the stress attributed to weak contacts (with normal forces smaller than the mean) is primarily isotropic [Radjai et al. (1996)]. Close correlations have been found between the fabric of the strong contact network and the evolving deviatoric stress [Antony and Kuhn (2004)]. We use results of DEM simulations to examine the persistence of this partition of the contacts between the two sets — strong and weak — for assemblies of spheres and of sphere-clusters. With a pair of sphere-cluster particles, which can have multiple contacts, we used the total of the normal forces between the pair. To measure persistence of the strong-contact partition, we considered the set of all contacts at a reference strain and then tracked the subset of strong contacts that were present at this original strain across the subsequent loading. Those original strong contacts (at 1% strain) that remained as strong contacts after an elapsed strain were considered “persistently strong” across that strain interval. Some contacts would transition between the strong and weak subsets, and these contacts were not considered as being persistently strong. Figure 7 shows the diminution of the persistently strong contacts across a range of elapsed strains.
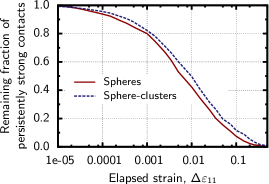
The results show that the partition of strong and weak subsets was quite transitory: for example, fewer than half (42%) of the original strong contacts between spheres persistently remained within the strong subset after the strain had advanced by just 1% (). Only 7.5% of the original strong subset persisted across an elapsed strain of 10%. The persistence of the strong-contact subset among sphere-clusters, although brief, is slightly more protracted than among spheres.
6 Movements at Distance and Force Chains
As has been shown, the relative movements of the centers of contacting particles, , are poorly predicted by the mean-field movement , as evidenced by the large dispersions in Fig. 6 and in Table 1. The non-affine nature of the motions of neighboring grains has been widely reported [Bagi (1993), Calvetti et al. (1997), Kuhn (2003), Tordesillas et al. (2008)]. If we instead consider pairs of particles that are more remotely distanced from each other, we would expect that the relative motions of these particles would more closely conform with the mean-field deformation. We might ask, at what distance (length scale) do particle movements begin to approach compliance with the mean field? To systematically investigate the relative movements of particles that are farther apart, we used a discrete measure of the distance between pairs of particles that were part of the assembly’s load-bearing network. A discrete, integer measure of distance has been introduced for two-dimensional assemblies [Kuhn (2003)], which can be extended to three-dimensional assemblies (see Fig. 8).

Following principles of graph theory [Satake (1992)], we constructed the adjacency matrix of the sphere assembly at a reference strain, with one row and one column for each particle in the load-bearing network (i.e. excluding rattlers). For this adjacency matrix, 1’s were placed in locations of contacting particles and ’s were placed in all other matrix locations. We then applied the Floyd-Warshall algorithm to create a matrix in which an element is the shortest path (discrete, integer distance) between particles and . For the particles in the load-bearing contact network, this symmetric matrix gives the distances between all combinations of particles .
6.1 Conformity of movements with mean deformation
Our first use of the distance matrix is determining how consistently the relative movements of distant particles conform with the mean deformation field. In this regard, we selected all particle pairs separated by a particular distance, with discrete distances ranging from (i.e., contacting neighbors) through 8. For the 6400-particle assemblies, greater distances would extend beyond the periodic boundaries. As a measure of two particles’ conformance with the mean deformation, we used a normalized inner product:
| (10) |
where and are computed with Eqs. (2) and (9) for the distant particles and . Particle movements in perfect conformity with the mean-field deformation have ; movements in counter-conformity have ; and movements that are orthogonal to the mean-field movement have .
Figure 9 gives the dispersions (fluctuations) in at two strains, reported as standard deviations in : at the start of loading and at strain for assemblies of spheres and of sphere-clusters.
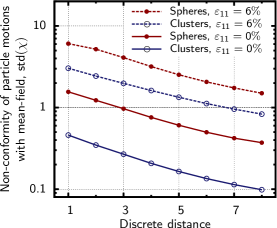
To place these results in perspective, the mean values of were very close to 1.0 at both strains, at all distances, and for both particle shapes: on average, the motions of particle pairs were consistent with the mean deformation. The average inconsistency (dispersion or fluctuation) in conformance is indicated by the standard deviation of , measured at different distances. The figure shows that conformance improves with the distance (discrete separation) between particles. Moreover, particle movements conform more closely to the mean-field deformation at the start of loading than at the larger strain. Even at the start of loading, however, conformance is far from perfect, with the standard deviation equal to 1.56 for contacting sphere pairs and improving to 0.37 for sphere pairs that are separated by 8 contacts (at the ends of chains of 9 particles). Again, these standard deviations can be compared with the mean of 1.0, demonstrating a relatively large degree of deviation of the particle movements from the affine field for particles separated by as many as 8 contacts.
We note a much better conformance with the mean-field deformation for the non-convex sphere-clusters than for the spheres. At the start of loading, the standard deviation of was 0.46 for the contacting sphere-clusters: although large, this dispersion is much smaller than the 1.56 of contacting spheres. Indeed, sphere-clusters at distances of 5 or greater conform fairly closely with the mean-field deformation at the start of loading ( values less than 0.16). The conformance is very poor, however, at larger strains, and even the lnog-range motions do not approach the affine ideal.
6.2 Persistence of force chains
We used similar methods to evaluate the longevity of chains of heavily loaded particles (so-called "force chains"), which are an ubiquitous feature of the load-bearing fabric of granular materials [Drescher and de Josselin de Jong (1972), Thornton and Barnes (1986), Majmudar and Behringer (2005)]. Simulations have shown that force chains are non-stationary, evolving structures that alter the local topologic arrangements of particles and the load-bearing fabric [Walker and Tordesillas (2012), Oda and Kazama (1998)]. We identified these force chains by using a weighted graph, in which each edge (contact) was assigned its inverse normal force, , as a weight (for non-convex particles, the denominator is the sum of normal forces at the multiple contacts between a particle pair). A weighted adjacency matrix was then populated with these inverse contact forces for the contacting particles but with ’s placed in other matrix locations. The Floyd-Warshall algorithm was used to compute a "nearest weighted distance" matrix , in which each element is the sum of the inverse forces of all contacts along the contact chain between two particles and . We defined and identified the dominant force chains with two criteria. Recognizing the significant length of force chains, we first considered the subset of pairs that were separated by 6 contacts (that is, chains of 7 particles), found by scanning the discrete distance matrix for the condition . The representative intensities of forces within these chains were characterized by the harmonic means of their normal forces:
| (11) |
where are the contacts in the chain between particles and . Note that different metrics were used in computing distance matrices and , and different particle chains (geodesics) can be associated with the corresponding elements and , a subtlety that was ignored in our calculation of mean force . As the second criterion, we identified those particle pairs within the first subset (pairs at distance 6) whose force intensity ranked among the largest 10% of all pairs within this subset. The two criteria provided a systematic means of identifying the dominant force chains at a given instant in the triaxial loading process. (Other methods have also been used for identifying force chains, such as \citeNPZhang:2001A)
To investigate the temporal persistence of these dominant force chains, we compared the set of force chains at the reference strain with the set of force chains at several later strains of . That is, we compared the set of force chains present near the peak stress with the set of force chains that had developed after an elapsed strain . We considered the union of these two sets of pairs and found the correlation of their force intensities at the two strains. Because the mean stress could differ at the two strains (and, with it, the average contact force), we compared the rankings of the mean forces among force chains at the two strains, using Spearman’s rank correlation coefficient as a measure of the persistence of the dominant force chains. If the rankings of particle pairs were the same at the two strains, then ; but if they had opposite rankings, then . Figure 10 gives this measure of the persistence of force chains that were originally present at the reference strain for the subsequent strains. The increment ranged from an almost instantaneous difference of 0.001% to the considerable interval of 40%, well beyond the peak stress and near the critical state.
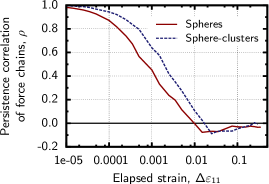
For spheres and for sphere-clusters, the correlation is nearly reduced to zero for elapsed strains of 1% and larger, indicating that force chains present at strain 6% had largely been replaced by other force chains at strain 7%. At a smaller elapsed strain of 0.1%, the correlation of 0.6 (or less) demonstrates that force chains are fairly ephemeral structures that are constantly being formed and transformed across small time scales.
7 Conclusions
Progress in engineering mechanics follows a sequence of five endeavors: observation, understanding, explanation, modeling, and prediction. Much of the research on granular materials (including the current work) has been in the first three areas, and progress on the first has advanced the furthest: examining and cataloging granular behaviors at various scales. A largely unresolved problem in granular mechanics is the accurate modeling and prediction of bulk mechanical behaviors from micro-scale analyses. These mechanical behaviors include the stress (strength) that is attained after a given deformation history and the incremental stiffness for a given particle packing or state. In this regard, the greatest attention has been given to predicting incremental stiffness at small strains, since the movements of contacting or nearby particles during the start of loading conforms most closely to an affine assumption. The simplest models are based upon two-particle systems or upon systems that include the first and second shells of particles around a central particle. The current observations do not provide much encouragement for such modeling approaches: deviations from the affine condition are severe, even if the third or more distance shells of particles are considered. At large strains, the effort appears to be futile, since contact movements become complex, darting sequences of sliding and rolling motions that are far from the affine field, and particle arrangements are quite fleeting.
Some consoling results do appear among the data, however. Although individual force chains are transient features that are weakened and replaced during strain intervals of as small as 1%, their presence is fairly resilient for increments of up to 0.01%. As such, the micro-scale modeling of force chains could become the basis of predicting incremental stiffness and strength. The recent work of Tordesillas and her coworkers has greatly advanced three of the five activities: understanding, explaining, and modeling the origins of force chains (for example, \citeNPTordesillas:2009a). The partitioning of contacts into weak and strong contacts also exhibits some of the same qualities as force chains, since this partition is fairly resilient for strain increments of as large as 0.1%. If future research can improve understanding and explain the origin of strong contacts (e.g., which features exist in the neighborhoods of the most heavily loaded contacts and particles?), models based upon the strong-weak partition are promising candidates for predicting stiffness and strength.
The current study also shows that non-convex particles behave in a more regular fashion than spheres. The movements of non-convex sphere-clusters are less varied, their strong-weak partition is more temporally resilient, their movements are not as far removed from an affine field, and their force chains are more persistent. These simulation results apply to rather smooth sphere-clusters, which have a shape that is only modestly non-convex and less irregular than that of most natural grains. In this regard, micro-scale models of simpler sphere particles using near-affine kinematics might give reasonable predictions for natural materials, even though the model might yield poor predictions for sphere assemblies! As another possible approach, analyses of force chains and strong contacts could be extended to include the effects of non-convexity and non-sphericity in the particle shapes.
A more unusual approach for estimating granular strength and stiffness is to eschew the notions of regularity and order and to assume that the material is thoroughly disordered, even maximally so. This approach has been taken by the author in modeling fabric and strength at the critical state [Kuhn (2014a)]. Although the results are encouraging, they do not yet address the incremental stiffness or the evolution of deviatoric stress in the pre-peak regime. Answers in these areas may require a synthesis of the modeling approaches mentioned above: the use of non-affine kinematic fields and non-convex particle shapes with attention to the dominant meso-scale structures (e.g., strong particles or force chains), while incorporating maximum disorder principles.
Acknowledgement
The author great-fully acknowledges productive discussions of this work with Dr. WaiChing Sun.
References
- Antony and Kuhn (2004) Antony, S. J. and Kuhn, M. R. (2004). “Influence of particle shape on granular contact signatures and shear strength: new insights from simulations.” Int. J. Solids Struct., 41(21), 5863 – 5870 Granular Mechanics.
- Bagi (1993) Bagi, K. (1993). “On the definition of stress and strain in granular assemblies through the relation between micro- and macro-level characteristics.” Powders & Grains 93, C. Thornton, ed., A.A. Balkema, Rotterdam, 117–121.
- Bagi (1996) Bagi, K. (1996). “Stress and strain in granular assemblies.” Mech. of Mater., 22(3), 165–177.
- Calvetti et al. (1997) Calvetti, F., Combe, G., and Lanier, J. (1997). “Experimental micromechanical analysis of a 2D granular material: relation between structure evolution and loading path.” Mech. Cohesive-Frict. Mater., 2(2), 121–163.
- Christoffersen et al. (1981) Christoffersen, J., Mehrabadi, M. M., and Nemat-Nasser, S. (1981). “A micromechanical description of granular material behavior.” J. Appl. Mech., ASME, 48(2), 339–344.
- da Cruz et al. (2005) da Cruz, F., Emam, S., Prochnow, M., Roux, J.-N., and Chevoir, F. (2005). “Rheophysics of dense granular materials: Discrete simulation of plane shear flows.” Phys. Rev. E, 72(2), 021309.
- Di Toro et al. (2004) Di Toro, G., Goldsby, D. L., and Tullis, T. E. (2004). “Friction falls towards zero in quartz rock as slip velocity approaches seismic rates.” Nature, 427(6973), 436–439.
- Drescher and de Josselin de Jong (1972) Drescher, A. and de Josselin de Jong, G. (1972). “Photoelastic verification of a mechanical model for the flow of a granular material.” J. Mech. Phys. Solids, 20, 337–351.
- Hanley et al. (2014) Hanley, K. J., Huang, X., O’Sullivan, C., and Kwok, F. C. Y. (2014). “Temporal variation of contact networks in granular materials.” Granul. Matter, 16(1), 41–54.
- Kuhn (2003) Kuhn, M. R. (2003). “Heterogeneity and patterning in the quasi-static behavior of granular materials.” Granul. Matter, 4(4), 155–166.
- Kuhn (2010) Kuhn, M. R. (2010). “Micro-mechanics of fabric and failure in granular materials.” Mech. of Mater., 42(9), 827–840.
- Kuhn (2011) Kuhn, M. R. (2011). “Implementation of the Jäger contact model for discrete element simulations.” Int. J. Numer. Methods Eng., 88(1), 66–82.
- Kuhn (2014a) Kuhn, M. R. (2014a). “Dense granular flow at the critical state: maximum entropy and topological disorder.” Granul. Matter, 16(4), 499–508.
- Kuhn (2014b) Kuhn, M. R. (2014b). “Transient rolling friction model for discrete element simulations of sphere assemblies.” Comptes Rendus Mécanique, 342(3), 129–140 Micromechanics of granular materials - A tribute to Ching S. Chang.
- Kuhn and Bagi (2004) Kuhn, M. R. and Bagi, K. (2004). “Alternative definition of particle rolling in a granular assembly.” J. Eng. Mech., 130(7), 826–835.
- Kuhn and Bagi (2005) Kuhn, M. R. and Bagi, K. (2005). “On the relative motions of two rigid bodies at a compliant contact: application to granular media..” Mech. Res. Comm., 32(4), 463–480.
- Kuhn et al. (2014) Kuhn, M. R., Renken, H., Mixsell, A., and Kramer, S. (2014). “Investigation of cyclic liquefaction with discrete element simulations.” J. Geotech. and Geoenv. Eng., 140(12), 04014075.
- Majmudar and Behringer (2005) Majmudar, T. S. and Behringer, R. P. (2005). “Contact force measurements and stress-induced anisotropy in granular materials.” Nature, 435(1079), 1079–1082.
- Oda and Kazama (1998) Oda, M. and Kazama, H. (1998). “Microstructure of shear bands and its relation to the mechanisms of dilatancy and failure of dense granular soils.” Géotechnique, 48(4), 465–481.
- Radjai et al. (1996) Radjai, F., Jean, M., Moreau, J.-J., and Roux, S. (1996). “Force distributions in dense two-dimensional granular systems.” Phys. Rev. Lett., 77(2), 274–277.
- Rice (2006) Rice, J. R. (2006). “Heating and weakening of faults during earthquake slip.” Journal of Geophysical Research: Solid Earth, 111(B5), B05311.
- Satake (1992) Satake, M. (1992). “A discrete-mechanical approach to granular materials.” Int. J. Engng. Sci., 30(10), 1525–1533.
- Satake (2001) Satake, M. (2001). “Stress and strain in granular materials.” Powders and Grains 2001, Y. Kishino, ed., A.A. Balkema, Lisse, 149–152.
- Satake (2004) Satake, M. (2004). “Tensorial form definitions of discrete-mechanical quantities for granular assemblies.” Int. J. Solids Struct., 41(21), 5775–5791.
- Thornton and Barnes (1986) Thornton, C. and Barnes, D. J. (1986). “Computer simulated deformation of compact granular assemblies.” Acta Mechanica, 64(1–2), 45–61.
- Tordesillas and Muthuswamy (2009) Tordesillas, A. and Muthuswamy, M. (2009). “On the modeling of confined buckling of force chains.” J. Mech. Phys. Solids, 57(4), 706–727.
- Tordesillas et al. (2008) Tordesillas, A., Muthuswamy, M., and Walsh, S. D. C. (2008). “Mesoscale measures of nonaffine deformation in dense granular assemblies.” J. Eng. Mech., 134(12), 1095–1113.
- Walker and Tordesillas (2012) Walker, D. M. and Tordesillas, A. (2012). “Taxonomy of granular rheology from grain property networks.” Phys. Rev. E, 85, 011304.
- Zhang et al. (2001) Zhang, H.-W., Zhong, W.-X., and Gu, Y.-X. (2001). “A new method for solution of 3D elastic-plastic frictional contact problems.” Appl. Math. and Mech., 22(7), 756–765.