Charge-transfer effect in hard x-ray 1 and 2 photoemission spectra:
LDA+DMFT and cluster-model analysis
Abstract
We study and hard x-ray photoemission spectra (XPS) in a series of late transition metal oxides: Fe2O3 (3), FeTiO3 (3), CoO (3) and NiO (3). The experimental spectra are analyzed with two theoretical approaches: MO6 cluster model and local density approximation (LDA) + dynamical mean-field theory (DMFT). Owing to the absence of the core-valence multiplets and spin-orbit coupling, 1 XPS is found to be a sensitive probe of chemical bonding and nonlocal charge-transfer screening, providing complementary information to 2 XPS. The 1 XPS spectra are used to assess the accuracy of the -initio LDA+DMFT approach, developed recently to study the material-specific charge-transfer effects in core-level XPS.
I INTRODUCTION
Transition-metal oxides are an important class of functional materials, showing a variety of fascinating phenomena, such as giant magnetoresistance and spontaneous ordering of spin, charge or orbital degrees of freedom Imada et al. (1998); Khomskii (2014). Thanks to the progress in using the hard x-ray sources in the last decade, core-level x-ray photoemission spectroscopy (XPS) has become a powerful tool to study electronic properties of transition-metal oxides Kobayashi (2009); Taguchi et al. (2013); Taguchi and Panaccione (2016); de Groot and Kotani (2014). Electronic response to the local charged perturbation (core-hole creation) gives rise to specific features in the XPS spectra due to the charge-transfer screening from distant transition metals, traditionally called nonlocal screening van Veenendaal and Sawatzky (1993); van Veenendaal (2006); Hariki et al. (2017), in addition to local screening from neighboring ligands. The nonlocal screening features are sensitive to various aspects of intersite physics in transition-metal oxides including magnetic and orbital order, and metal-insulator transition Horiba et al. (2004); van Veenendaal (2006); Hariki et al. (2017); Taguchi et al. (2008); Eguchi et al. (2008); Obara et al. (2010); Kamakura et al. (2004); Hariki et al. (2013a); Taguchi et al. (2005); Chang et al. (2018). The unscreened final states, on the other hand, leave trace of intra-atomic multiplets on the satellite features in the XPS spectra, which are usually well separated in energy from the charge-transfer features 111The unscreened final states can be described by taking the local core-valence and valence-valence interaction into account, that is encoded in standard impurity-model approaches..
In 2 XPS, the charge-transfer features are buried in complex spectra reflecting the 2–3 core-valence multiplets and spin-orbit coupling in the 2 shell. These effects are absent in the XPS spectra. In practice, little additional effort is required to measure 1 XPS together with valence or other core-level spectra. Despite the large life-time broadening, the absence of the core-valence multiplets and spin-orbit coupling allows 1 XPS to be used: (1) to identify charge-transfer satellites at higher binding energies, which enables an accurate estimation of material-specific parameters Miedema et al. (2015); Rubio-Zuazo et al. (2018), (2) to distinguish local- and nonlocal-screening features. We note that in principle there is a 1–3 exchange interaction but the interaction strength is only a few meV and this effect is not visible in the spectral shape.
The cluster model describing the electronic states of transition-metal ion hybridized to discrete states of neighboring ligands has been widely employed in core-level XPS studies de Groot and Kotani (2014); Bocquet et al. (1992). The adjustable parameters of the cluster model can be to a large extent eliminated by -initio low-energy Hamiltonians in the basis of the localized Wannier orbitals Haverkort et al. (2012). Nevertheless, the cluster model misses the nonlocal charge-transfer screening from the bulk of crystal beyond the ligand atoms. This deficiency can be cured by generalizing the cluster model with discrete ligand states to a quantum impurity model with a continuous spectrum, which represents the host surrounding the excited transition-metal ion. While this description is exact for a noninteracting host, in the cases of our interest, the host is correlated due to electron-electron interaction between localized electrons, even strongly. In that case, dynamical mean-field theory (DMFT) Metzner and Vollhardt (1989); Georges et al. (1996) provides an optimized effective description of the host. Following simplified model studies Hariki et al. (2013a, b, 2015, 2016); Haverkort et al. (2014); Kim et al. (2004), -initio local-density approximation (LDA) approach + DMFT was applied to core-level spectroscopies recently Hariki et al. (2017, 2018), see also Ref. Lüder et al. (2017) in a similar direction. The unified impurity-model description of core-level spectra in a wide range of correlated materials Kolorenč et al. (2015) and in various excitation processes/edges Hariki et al. (2018); Kolorenč (2018) provided by the LDA+DMFT approach is posted to experimental tests.
In this paper, we present a combined experimental and theoretical study of and XPS spectra in selected late transition-metal oxides: Fe2O3, FeTiO3, CoO and NiO. By comparison of the cluster-model and LDA+DMFT calculations, we distinguish the local- and nonlocal-screening contributions in the 1 and 2 spectra. We demonstrate that in the 2 spectra, popular choice for the study of 3 transition-metal oxides so far, disentanglement of the local and nonlocal-screening contributions is a complex task due to the core-valence multiplets, while asymmetric shape of the main 1 XPS line is found to be a fingerprint of nonlocal screening in the studied compounds. The accuracy of the ab-initio material-specific parameters is examined by comparing to the present 1 XPS data. The LDA+DMFT approach reproduces both the 1 and 2 spectra consistently.
II Experimental details
The Ni 1 XPS of NiO was measured at the HIKE station of the KMC-1 beamline at BESSY. The photon energy of 8.95 keV was used and the energy resolution is 0.5 eV. According to the Tanuma Powell and Penn algorithm (TPP-2M) formula PTanuma et al. (1994), the inelastic mean free path (IMFP) for the mentioned photon energy is 13 . The NiO thin film was grown on a Ag substrate (001) and capped by 3 nm of MgO to avoid the charging effects Calandra et al. (2012).
The Co 1 and 2 XPS spectra of the single crystal CoO were measured at SXRMB beamline of the Canadian Light Source (CLS). The photon energy of 9 (3) keV for 1 (2) were used with the energy resolution of 0.9 (0.3) eV. The IFMP (obtained with TPP-2M) is estimated as 23 (35) for 1 (2) measurements.
The Fe 1 and 2 XPS spectra of -Fe2O3 single crystal were measured at ID16 beamline of ESRF. The photon energy of 10 keV and 7.7 keV were used for the 1 and 2 measurement, with the IMFP (obtained with TPP-2M) of 50 and 105 , respectively. The energy resolution at 10 keV is 0.48 eV and at 7.7 keV is 0.42 eV.
The Fe 1 XPS and 2 XPS spectra of FeTiO3 (Fe2+) powders (99.8%) were measured at I09 beamline of Diamond light source. The photon energy of 12 keV and 6 keV were used for the 1 and 2 measurements, respectively. The energy resolution at 12 keV is 0.3 eV and at 6 keV is 0.25 eV. The IFMP (obtained with TPP-2M) is estimated as 93 and 100 for the 1 and 2 photon energy, respectively.
All experimental data were collected at room temperature.
We present fitting analysis for the experimental 1 spectra. The main line is fitted using two Pseudo-Voigt functions composed of 20% Lorentzian and 80% of Gaussian. Considering the present experimental energy resolution and typical life-time of the 1 core hole, the width (HWHM) of the Lorentzian and Gaussian is set to (, )=(0.08, 1.02), (0.28, 1.12), (0.29, 0.91), and (0.20, 0.80) in the unit of eV for NiO, CoO, Fe2O3, and FeTiO3, respectively. For the satellites, the widths of the Pseudo-Voigt functions are relaxed to reproduce the experimental data. The background in the experimental data is subtracted prior to the fitting analysis using the Shirley method Shirley (1972).
III COMPUTATIONAL METHOD
A Theoretical Methods
The and XPS spectra are analyzed by the cluster model and the LDA+DMFT approach. Both approaches build on the same lattice model constructed from LDA calculations but use different approximations for describing the valence states surrounding the x-ray excited transition-metal site. Both approaches start with a standard LDA calculation using the Wien2K package Blaha et al. for the experimental crystal structure. Then the tight-binding representation of the transition metal 3 and O 2 bands is constructed using the Wannier90 package Mostofi et al. (2014) and Wien2wannier interface Kuneš et al. (2010). The – model is augmented with the electron–electron interaction within the transition metal 3 shell, leading to the lattice Hamiltonian
| (1) | |||||
Here, () is an operator-valued vector whose elements are Fourier transforms of (), that annihilates the transition metal 3 (O 2) electron in the flavor (combined orbital and spin indices) in the unit cell. The local Coulomb interaction, acting on the transition metal shell, is parameterized by Slater integrals , and . We fix the ratio , that enables to determine Coulomb vertices using Habbard and Hund’s parameters Pavarini et al. (2011). The double-counting term , which corrects for the – interaction presented in the LDA step, renormalizes the – splitting, thus relates to the charge-transfer energy Hariki et al. (2017, 2018); Karolak et al. (2010). We introduce the relation of and as, , where () is the average energy of transition metal 3 (O 2) states and is the value of the (configuration-averaged) Coulomb interaction. The calculation temperature is set to K in the present study. We note that, in NiO, CoO and Fe2O3, the unit cell is enlarged to simulate the antiferromagnetic ordering observed experimentally below 300 K 222In the LDA+DMFT calculation, the self-energy depends on the spin in the AF phase.. In FeTiO3, the unit cell contains Ti and Fe atoms.
In the cluster-model approach, following the conventional definition, we discard all states in Eq. (1) except for those on the x-ray excited transition-metal and its nearest-neighboring ligands. The waverfunction of the initial state as well as the final states is represented in the truncated Fock space. Thus by construction nonlocal charge transfer beyond neighboring ligands cannot be described by the cluster model. In the LDA+DMFT approach, on the other hand, we first solve the lattice model of Eq. (1) within DMFT Georges et al. (1996); Kotliar et al. (2006). The DMFT renders local self-energy to one-particle LDA bands, that yields many-body description of valence excitations. The infinite lattice model is mapped onto the Anderson impurity model coupled to the optimized non-interacting host that represents valence states around the excited metal. The Hamiltonian of the cluster model is given by
where represents the hybridization intensity between the metal state and molecular orbital (with energy ) composed of 2 states on nearest neighboring ligands. The Hamiltonian of the Anderson impurity model in the LDA+DMFT approach is given by
where () is the creation (annihilation) operator for the auxiliary state with energy in the DMFT hybridization function. The third term discriminates the cluster model and LDA+DMFT approach in the description of the hybridization between the excited metal and the rest of the crystal. In the LDA+DMFT approach, the effect of the long-distant atoms is represented by hopping amplitude . The two approaches have the same form of the local terms acting on the excited metal site
Here, is the creation operator for core electron (1 or 2). The on-site energies of transition-metal states are the ones of the wannier states shifted by the double-counting correction . The isotropic part of the core-valence interaction is shown explicitly, while other terms containing higher multipole contributions and the spin-orbit interaction are included in , see Sec. IIIB. Since common basis functions ( wannier functions) are adopted in the cluster model and LDA+DMFT approach, we use the same interaction parameters in the two, actual values are given in Sec. IIIB.
In the present LDA+DMFT calculations, the strong coupling continuous-time quantum Monte Carlo method Werner et al. (2006); Gull et al. (2011); Boehnke et al. (2011); Hafermann et al. (2012) with density-density approximation to the Coulomb vertices in Eq. (1) was used to compute the self-energy of the auxiliary Anderson impurity model. Upon reaching the LDA+DMFT self-consistency, the self-energy is analytically continued with the maximum entropy method Wang et al. (2009); Jarrell and Gubernatis (1996) in order to obtain the hybridization function in the real-frequency domain. Then, for computing core-level spectra, we augment the Anderson impurity model with the core orbitals ( or ).
The core-level XPS spectrum is calculated with the truncated configuration interaction method Hariki et al. (2017). The XPS spectral function for the binding energy is given by de Groot and Kotani (2014); Hariki et al. (2017)
where is the eigen energy of the -th excited states in the initial state. The temperature effect is taken into account with the Boltzmann factor at = 300 K. The operator creates a 1 or 2 core hole at the impurity transition-metal site. Here is the model Hamiltonian, i.e. the Hamiltonian of the cluster model or the Anderson impurity model with the DMFT hybridization function. In both models, full Coulomb vertices for the valence-valence and core-valence interaction are included in the XPS calculations explicitly. The computational details in the LDA+DMFT method can be found in Refs. Hariki et al. (2017, 2018). In the cluster-model approach, we employ the CTM4XAS program Stavitski and de Groot (2010), which implements a standard three configuration scheme.
| Fe2O3 | FeTiO3 | CoO | NiO | |
|---|---|---|---|---|
| Fe3+ () | Fe2+ () | Co2+ () | Ni2+ () | |
| 10 | 0.5 | 0.25 | 0.25 | 0.45 |
| 3.7 | 3.5 | 4.1 | 4.4 | |
| () | 8.4 | 8.0 | 8.6 | 7.8 |
| 6.4 | 6.4 | 6.8 | 6.5 | |
| V | 1.3 | 1.3 | 1.2 | 1.2 |
| V | 2.5 | 2.1 | 2.0 | 2.1 |
| 0.7 | 1.1 | 0.9 | 0.9 | |
| 0.5 | 0.5 | 0.4 | 0.4 |
B Computational Parameters
The following computational parameters are used both in the cluster model and LDA+DMFT method: the Coulomb interaction of the 3 electrons ; the core-valence Coulomb interactions () in the () XPS; Slater integrals representing the multipole part of the Coulomb interaction; one-particle hopping parameters; crystal-field splitting; and charge-transfer energy . The value is fixed by consulting with DFT-based estimations or previous XPS studies, as given in Table 1. The core-hole potential () is fixed by fitting the experimental core-level spectra. Based on experimental observations in Sec. IV, we use the same value for and . The multipole part of the core-valence interaction is determined by the Slater integrals and , defined as de Groot and Kotani (2014)
where denotes and orbit for 1-3 and 2-3 core-valence interactions, respectively. Here () means the larger (smaller) one of and , and is corresponding radial function. The spin-orbit coupling in the 2 and 3 shell, and the Slater integrals , are calculated with an atomic Hartree-Fock code. The and values are scaled down to 80% of the Hartree-Fock values to simulate the effect of intra-atomic configuration interaction from higher basis configurations, which is a successful empirical treatment Matsubara et al. (2005); Sugar (1972); Tanaka and Jo (1992); de Groot et al. (1990); Cowan . The one-particle hopping and the crystal-field parameters are obtained from the LDA bands. The double-counting correction in LDA+DMFT is treated as an adjustable parameter and fixed by comparison to the valence photoemission spectra Hariki et al. (2017). For FeTiO3, is determined to reproduce the experimental gap ( eV) Ginley and Butler (1977) since valence photoemission data are not reported so far. The computed XPS intensities are broadened using Gaussian function to simulate the instrumental resolution and the finite core-hole life time.
C Hybridization Function
The hybridization function describes electron hopping between the 3 orbitals on the x-ray excited transition-metal site and the rest of the crystal. In the cluster model, which is a special case of the Anderson impurity model, the hybridization function has a form of Dirac delta function and usually is not introduced explicitly. The LDA+DMFT hybridization function is a general function of energy , which is obtained for flavor 333In the present study, we neglect the small off-diagonal elements of . ,
| (2) |
where and are the local self-energy and the one-body part of the on-site Hamiltonian, respectively Georges et al. (1996); Kotliar et al. (2006); Hariki et al. (2017). The local Green’s function is computed by averaging the lattice Green’s function over the Brillouin zone. While the Anderson impurity model provides only an approximate description of local dynamics in interacting lattice system, it becomes exact for non-interacting host. In this case, the hybridization function can be decomposed to the distance-shell contributions,
| (3) |
Here operator describes the hopping between the transition metal 3 orbitals on the impurity site and the rest of the crystal. The operator is the host Hamiltonian which contains all terms in Eq. (1) except the ones including the x-ray excited transition-metal site. The indices and runs over the lattice sites and thus the summation can be truncated at the desired distance. For example, the hybridization function of the cluster model (with in Sec. IIIA) is given as,
We use Eq. (3) to compute of the cluster model as well as the (non-interacting) finite-size clusters to demonstrate hopping-distance dependence of structure. Analysis of the contributions of the various distance-shells will be discussed later in Fig. 5. Note that similar expression for holds also for an interacting host (with an additional self-energy in the denominator). However, decomposition to different hopping cut-offs is not strictly defined since all hoppings are implicitly present in the self-energy.
IV RESULTS
A NiO
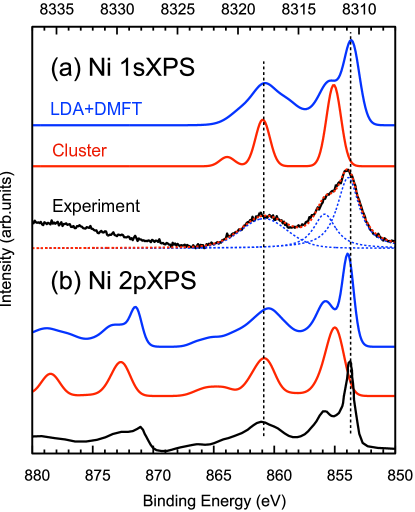
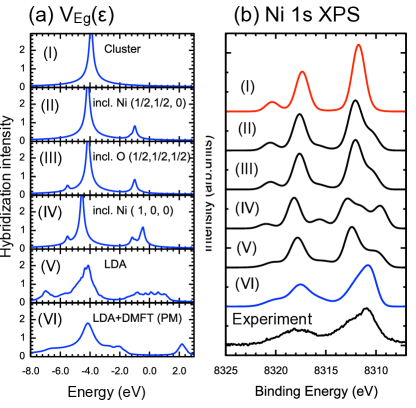
We start with NiO, a prototype Mott insulator with a large charge gap ( 4 eV). Figure 1 shows Ni 1 and 2 XPS spectra of NiO, together with the calculated spectra by the cluster model and LDA+DMFT. The 1 main line around 8311 eV corresponds to configuration, where and denote a 1 core-hole and a hole in the valence band, respectively. In addition, the charge-transfer satellite with a mixed character of and configurations is clearly observable around 8318 eV. The Ni 1 XPS spectrum is free from spin-orbit coupling in the core level, while the 2 spectrum is composed of 2 (868853 eV) and 2 (885870 eV) components. Since the spin-orbit coupling in the Ni 2 core level is large (11 eV), the Ni 2 and 2 components have no overlap. The 2 () main line locates around 854 eV (873 eV) and the 2 () charge-transfer satellite is observed around 861 eV (878 eV). The splittings of the main line and the charge-transfer satellite in the Ni 1 and 2 spectra are almost identical to each other ( eV), indicating the values of the core-hole potential and are comparable. Indeed, the LDA+DMFT calculation with eV well reproduces the splitting of the main and charge-transfer satellite in both the 1 and 2 XPS spectra. A double-peak feature is observed in the 2 main line. The lower (higher) binding-energy side of the double peaks is due to the nonlocal (local) screening in the final states Taguchi et al. (2008); Hariki et al. (2013a, 2017). The LDA+DMFT result qualitatively reproduces the Ni 2 XPS data including the double-peak lacked in the cluster-model result. We find that a double peak is discernible in the 1 main line despite the larger core-hole broadening. The similarity to the 2 main line and its presence/absence in the LDA+DMFT/cluster-model spectra suggests its nonlocal screening origin. In addition, the charge-transfer satellite shows a noticeable difference in the the cluster and LDA+DMFT results, indicating the nonlocal screening affects not only the main line but also the satellite with a higher binding energy. This is because the charge-transfer satellite has a contribution of the configuration, the so-called over-screened states, in which the nonlocal screening takes part.
B CoO
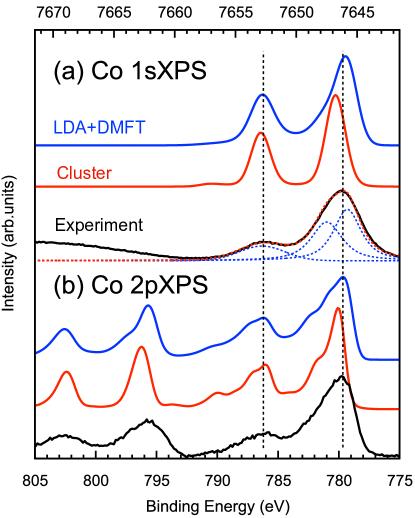
CoO is a typical transition-metal oxide with a large charge gap eV. Figure 2 shows Co 1 and 2 XPS spectra of CoO, together with the calculated spectra by the cluster model and LDA+DMFT. The Co 1 XPS, see Fig. 2a, shows the main line (7647 eV) corresponding to configuration and the charge-transfer satellite ( eV). In the 2 spectra, 2 (2) component is located in 794-778 eV (807-795 eV), in which the main line and satellite are observed around 780 eV (796 eV) and 787 eV (803 eV), respectively. The splitting of the main line and the charge-transfer satellite in the 1 and 2 spectra is almost identical (6 eV). The 1 main line has an asymmetric shape with a shoulder on the higher side. Because of the absence of the core-valence multiplets in Co 1 spectra, the Co 1 main line is expected to be a single peak. Indeed, the cluster-model calculation yields a symmetric main line. On the other hand, the LDA+DMFT spectrum contains asymmetric main line, suggesting the nonlocal screening is the origin of the asymmetry of the main line. Then, in Co 2 spectra, we find the 2 main line is rather broad, in a clear contrast to the Ni 2 main line of NiO. The LDA+DMFT result well reproduces the broad shape of the main line as well as of the charge-transfer satellite, compared to the cluster-model result. The difference between the LDA+DMFT and cluster-model results suggests that the nonlocal screening from Co 3 bands plays a role in the formation of the broad asymmetric main line Hariki et al. (2017). However, the Co 2 main line in the cluster-model result has inner features due to rich 2-3 core-valence multiplets in the configuration. Thus a theoretical simulation is required to disentangle the local screening and nonlocal screening contributions in the Co 2 spectra Hariki et al. (2017).
C Fe2O3
-Fe2O3 is an insulating Fe3+ oxide with corundum structure and antiferromagnetic ordering below 950 K. Figure 3 shows Fe 1 and 2 XPS spectra, together with the calculated spectra by LDA+DMFT and cluster model. The Fe 1 spectrum shows three peaks: main line ( 7118.5 eV), the first satellite (S1 : 7128 eV) and the second satellite (S2 : 7135 eV). The energy splittings of the main line and satellites are rather large ( 9.5 eV for S1 and 17 eV for S2) compared to those in NiO and CoO ( 6 eV). The large splitting in Fe2O3 can be explained by the value of the effective hybridization de Groot and Kotani (2014); Uozumi et al. (1996, 1997),
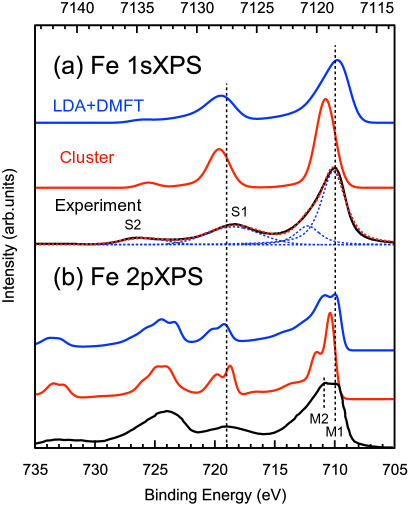
where () and () are the occupation of the () states and the (bare) hybridization intensity between ligand and the () orbitals 444For simplicity, octahedral symmetry is assumed and the effect of long-distance hopping (nonlocal screening) is not taken into account in the qualitative discussion.. The values in NiO, CoO and Fe2O3, computed for high-spin ground state in formal valence, are 2.97, 3.24, and 4.19 eV, respectively. Thus the different configurations (, , , here denotes a hole in nearest neighboring ligands) are split more in Fe2O3 as compared to NiO and CoO, yielding the large separations of the main line and satellites in Fe 1 XPS. Thus in Fe and earlier transition-metal oxides Uozumi et al. (1996, 1997); Bocquet et al. (1996), the hybridization strength between transition metal 3 and surrounding atoms can be estimated accurately by the satellite positions since the large magnifies its bare value. Both the LDA+DMFT and the cluster-model calculations reproduce the positions of the satellites reasonably well, reflecting the accuracy of hopping parameters obtained from the LDA calculation. However, in the Fe 2 spectrum, Fig. 3b, the second satellite S2 is not visible due to its overlap with the main line of the Fe 2 component ( 725 eV). Thus, thanks to the absence of spin-orbit coupling, 1 XPS complements the 2 XPS information about bonding.
The Fe 2 main line shows a double-peak shape, marked as M1 and M2 in the figure, that is well reproduced in the LDA+DMFT result. The difference in the LDA+DMFT and cluster-model results is attributed to the contribution of the nonlocal screening, the M2 intensity is enhanced relative to the M1 one. However, as seen in the cluster-model spectrum, Fig. 3b, the main line has a rich fine structure also due to the core-valence Coulomb multiplets, which makes determination of the nonlocal screening contribution a difficult task. On the contrary, the asymmetry of the Fe 1 XPS main line, observed in the experiment, Fig 3a, is solely due to nonlocal screening. As in CoO, the 1 main line of the cluster model consists of a single peak due to the absence of the core-valence multiplets, while that of the LDA+DMFT shows a clear asymmetry. Thus the shape of the 1 XPS main line provides an unambiguous signature of the nonlocal screening, while it is hidden in the complex structure of 2 XPS.
D FeTiO3
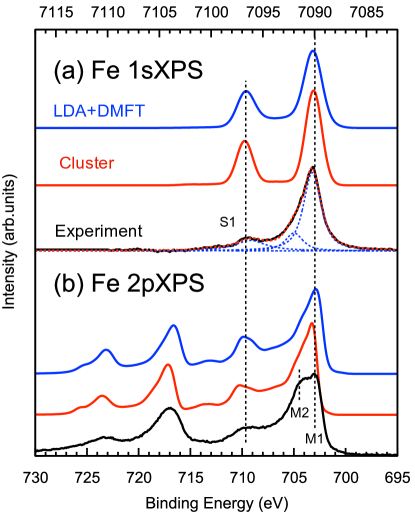
Figure 4 shows the experimental Fe 1 and 2 XPS spectra. In the Fe 1 spectrum, we observe a main line ( 7090 eV) and a CT satellite (S1 : 7097 eV). The energy splitting between the CT satellite (S1) and main line is 7 eV which is about 2.5 eV smaller compared to that in Fe2O3, see Fig. 3a. As found in Table. 1, the hopping amplitude between Fe and nearest-neighboring oxygen as well as other parameters does not differ so much in the two compounds. The large difference in the main-line – CT-satellite splitting comes from the value of the , 4.19 eV for Fe2O3 and 3.49 eV for FeTiO3 . The value in the divalent Fe system () is smaller than that in the trivalent Fe system () due to an additional electron in the orbital in the high-spin ground state, resulting in the observed smaller main-satellite splitting in FeTiO3. In FeTiO3, a higher- CT satellite (S2) is rather weak and not observed in the present data, which is due to little contribution of the configuration to the ground state. The position of S1 and the absence of S2 are well reproduced in the LDA+DMFT calculation.
We expect that the nonlocal screening plays a minor role in FeTiO3 compared to Fe2O3 since Ti ions, formally tetravalent configuration, cannot provide electrons to screen the x-ray excited Fe ion. Simulation of the Fe 2 XPS of Fe2O3, Fig. 3b, revealed that nonlocal screening amplifies the intensity of M2 relative to M1. This is confirmed by comparing the experimental data of Fe2O3 and FeTiO3. In FeTiO3, Fig. 4b with weaker nonlocal screening, a smaller ratio of M2 to M1 intensities than in Fe2O3 is observed. Indeed, the LDA+DMFT spectra of FeTiO3 do not differ much from the cluster-model calculation, though the relative intensity of M1 and M2 is still noticeably modified by NLS. The main line of Fe 1 XPS in FeTiO3 is rather sharp compared to that in Fe2O3, see the fitting analysis in Fig 4 and 3, indicating less nonlocal screening contribution. The intensity ratio of the low-energy peak () to the high-energy peak () in the main line is / = 3.92, 4.38 for Fe2O3 and FeTiO3, respectively. The smaller / for Fe2O3 supports that the nonlocal screening is more effective in Fe2O3.
V Discussion
All spectral features in the studied compounds are well reproduced by the LDA+DMFT approach. This is not so for the cluster model and the comparison of the two models provides information about the nonlocal screening effects. Despite rather large life-time broadening of the 1 spectra compared with the 2 counterparts, the charge-transfer satellites are clearly visible for the studied compounds. This holds also for charge-transfer satellites at higher binding energies, which are not obscured by the overlap of spin-orbit split edges as in the spectra. The charge-transfer satellites, usually well pronounced in the spectra of correlated insulators, thus provide information about covalent bonding in these compounds. Absence of the core-valence multiplets in 1 XPS directly reveals the effect of nonlocal screening reflected in the asymmetry of the 1 main line.
The shape of the 1 XPS spectra has implications for the interpretation of 1 (-edge) x-ray absorption spectroscopy (XAS). In -edge XAS, the electron excited from the 1 core-level to the broad 4 band is not bound to the excited transition-metal atom. The fact the 1 XPS spectra have multiple peaks implies that one X-ray photon energy creates a series of electrons with different kinetic energies. This is in contrast to the usual way to calculate -edge XAS, i.e. it is assumed that the X-ray photon creates a single electron kinetic energy. To take the spectral shape of the 1 XPS spectra into account, the -edge XAS spectra must be viewed as a convolution of the empty 4 density of state (as calculated from for example multiple scattering) and the 1 XPS spectrum. In other words, the detailed understanding of the -edge XAS spectral shape requires the inclusion of many-body response to the core-hole potential as measured with the 1 XPS spectral shape, where we note that this approach is similar in concept to the charge-transfer satellite method as applied earlier Bair and Goddard (1980); Collart et al. (2006); Tolentino et al. (1992). If the 1 XPS spectral shape can be described by a single peak, the related -edge XAS can be described from the multiple scattering of a single electron energy Wu et al. (2004), As shown here, charge-transfer satellites present a sizable contribution to the 1 XPS of late transition-metal oxides. Therefore a simultaneous analysis 1 XPS and 1 XAS is desirable for the detailed understanding of the 1 XAS spectral shape.
Finally, we discuss the theoretical description of nonlocal screening core-level XPS. In contrast to the real-space approach of the multi-site cluster model van Veenendaal and Sawatzky (1993) LDA+DMFT includes both local-screening and nonlocal-screening effects in the hybridization function of the Anderson impurity model. To see the connection between this description and the real-space one, Fig. 5a shows the distance dependence of the hybridization intensity in NiO. Starting from a single peak in the of the cluster model, which corresponds to the hybridization with nearest-neighboring oxygen atoms, acquires a band character by taking more distant atoms into account. We note that the truncated in panels (I)-(IV) and (V) is computed in non-interacting finite-size clusters and infinite lattice, respectively. The intensities around eV corresponds to the hybridization with Ni 3 bands. These intensities are rather weak compared to those arising from O 2 bands ( eV) due to a smaller amplitude of direct metal-metal hopping as well as indirect hopping, e.g., via a metal-ligand-metal path. The electronic correlation represented by DMFT self-energy modifies the dramatically and a gap opens at the Fermi energy. Figure 5b shows the calculated 1 XPS spectra by the Anderson impurity model with the truncated hybridization intensities . By taking surrounding Ni ions into account, a new peak develops in the low-binding-energy side of the main line. This accompanies a noticeable shift of the local-screening peak ( eV) because of the following reason. In the cluster model, the main line is composed of mainly configuration. By including the charge transfer from surrounding Ni ions, configuration contributes the main line (here, denotes a hole on the neighbor Ni ion). In the impurity picture, though there is no coupling between and configurations, indirect coupling via (unscreened) configuration (i.e. ) gives rise to effective repulsion between the two screened configurations. However we find a qualitative difference in the main-line shape between the experimental data and the spectra in (I)-(V). The LDA+DMFT result in the paramagnetic phase, see (VI), shows double peaks in the main line although their splitting of is narrow. The LDA+DMFT result in the antiferromagnetic phase, see Fig. 1b, reproduces the double-peak feature qualitatively. The in LDA, in principle, includes hybridization with all valence states in the non-interacting lattice, indicating the importance to include the correlated Ni 3 band and the magnetic ordering properly to describe the XPS spectra.
VI Conclusions
We have studied both experimentally and theoretically the 1 and 2 hard x-ray photoemission spectra (XPS) in a series of late transition metal oxides: Fe2O3, FeTiO3, CoO and NiO. Despite the large core-hole life-time broadening, the 1 XPS benefits from the absence of core-valence multiplets and spin-orbit coupling effects in the spectra, which allows observation of high-energy satellites as well as the main-line asymmetry. These XPS features can be interpreted in terms of material specific metal-ligand covalency (satellites) and nonlocal screening (main-line asymmetry). The 1 XPS is thus complementary to 2 XPS that has more complex spectra. Using LDA+DMFT approach we were able to reproduce the and XPS spectra of the studied materials, while the deviations from the cluster model allowed us to quantify the role of nonlocal screening. Based on the present 1 XPS results, we have pointed out the importance of the 1 XPS to interpret the 1 (-edge) x-ray absorption spectra.
Acknowledgements.
The authors thank T. Uozumi, P. S. Miedema, A. Sotnikov and J. Fernández Afonso for fruitful discussions, and Ties Haarman for providing the fitting code. We thank R.-P. Wang for supporting the fitting analysis. Dimanond Light Source, Canadian Light Source, ESRF and BESSY II are acknowledged for the allocation of synchrotron radiation beamtimes at the I09, SXRMB, ID16, and KMC-1 beamlines, respectively. A. H., M.W. and J. K. are supported by the European Research Council (ERC) under the European Union’s Horizon 2020 research and innovation programme (grant agreement No. 646807-EXMAG). M. G. and F. M. F. de G. are supported by an European Research Council (ERC) grant XRAyonACTIVE (No. 340279). AR acknowledges the support from Imperial College London for her Imperial College Research Fellowship. The computational calculations were performed at the Vienna Scientific Cluster (VSC).References
- Imada et al. (1998) M. Imada, A. Fujimori, and Y. Tokura, Rev. Mod. Phys. 70, 1039 (1998).
- Khomskii (2014) D. I. Khomskii, Transition Metal Compounds (Cambridge University Press, 2014).
- Kobayashi (2009) K. Kobayashi, Nucl. Instrum. Methods. Phys. Res. A. 601, 32 (2009).
- Taguchi et al. (2013) M. Taguchi, Y. Takata, and A. Chainani, J. Electron. Spectrosc. Relat. Phenom. 190, 242 (2013).
- Taguchi and Panaccione (2016) M. Taguchi and G. Panaccione, “Depth-dependence of electron screening, charge carriers and correlation: Theory and experiments,” in Hard X-ray Photoelectron Spectroscopy (HAXPES), edited by J. C. Woicik (Springer International Publishing, Cham, 2016) pp. 197–216.
- de Groot and Kotani (2014) F. de Groot and A. Kotani, Core Level Spectroscopy of Solids (CRC Press, 2014).
- van Veenendaal and Sawatzky (1993) M. A. van Veenendaal and G. A. Sawatzky, Phys. Rev. Lett. 70, 2459 (1993).
- van Veenendaal (2006) M. van Veenendaal, Phys. Rev. B 74, 085118 (2006).
- Hariki et al. (2017) A. Hariki, T. Uozumi, and J. Kuneš, Phys. Rev. B 96, 045111 (2017).
- Horiba et al. (2004) K. Horiba, M. Taguchi, A. Chainani, Y. Takata, E. Ikenaga, D. Miwa, Y. Nishino, K. Tamasaku, M. Awaji, A. Takeuchi, M. Yabashi, H. Namatame, M. Taniguchi, H. Kumigashira, M. Oshima, M. Lippmaa, M. Kawasaki, H. Koinuma, K. Kobayashi, T. Ishikawa, and S. Shin, Phys. Rev. Lett. 93, 236401 (2004).
- Taguchi et al. (2008) M. Taguchi, M. Matsunami, Y. Ishida, R. Eguchi, A. Chainani, Y. Takata, M. Yabashi, K. Tamasaku, Y. Nishino, T. Ishikawa, Y. Senba, H. Ohashi, and S. Shin, Phys. Rev. Lett. 100, 206401 (2008).
- Eguchi et al. (2008) R. Eguchi, M. Taguchi, M. Matsunami, K. Horiba, K. Yamamoto, Y. Ishida, A. Chainani, Y. Takata, M. Yabashi, D. Miwa, Y. Nishino, K. Tamasaku, T. Ishikawa, Y. Senba, H. Ohashi, Y. Muraoka, Z. Hiroi, and S. Shin, Phys. Rev. B 78, 075115 (2008).
- Obara et al. (2010) M. Obara, A. Sekiyama, S. Imada, J. Yamaguchi, T. Miyamachi, T. Balashov, W. Wulfhekel, M. Yabashi, K. Tamasaku, A. Higashiya, T. Ishikawa, K. Fujiwara, H. Takagi, and S. Suga, Phys. Rev. B 81, 113107 (2010).
- Kamakura et al. (2004) N. Kamakura, M. Taguchi, A. Chainani, Y. Takata, K. Horiba, K. Yamamoto, K. Tamasaku, Y. Nishino, D. Miwa, E. Ikenaga, M. Awaji, A. Takeuchi, H. Ohashi, Y. Senba, H. Namatame, M. Taniguchi, T. Ishikawa, K. Kobayashi, and S. Shin, Europhys Lett. 68, 557 (2004).
- Hariki et al. (2013a) A. Hariki, Y. Ichinozuka, and T. Uozumi, J. Phys. Soc. Jpn. 82, 043710 (2013a).
- Taguchi et al. (2005) M. Taguchi, A. Chainani, K. Horiba, Y. Takata, M. Yabashi, K. Tamasaku, Y. Nishino, D. Miwa, T. Ishikawa, T. Takeuchi, K. Yamamoto, M. Matsunami, S. Shin, T. Yokoya, E. Ikenaga, K. Kobayashi, T. Mochiku, K. Hirata, J. Hori, K. Ishii, F. Nakamura, and T. Suzuki, Phys. Rev. Lett. 95, 177002 (2005).
- Chang et al. (2018) C. F. Chang, T. C. Koethe, Z. Hu, J. Weinen, S. Agrestini, L. Zhao, J. Gegner, H. Ott, G. Panaccione, H. Wu, M. W. Haverkort, H. Roth, A. C. Komarek, F. Offi, G. Monaco, Y.-F. Liao, K.-D. Tsuei, H.-J. Lin, C. T. Chen, A. Tanaka, and L. H. Tjeng, Phys. Rev. X 8, 021004 (2018).
- Note (1) The unscreened final states can be described by taking the local core-valence and valence-valence interaction into account, that is encoded in standard impurity-model approaches.
- Miedema et al. (2015) P. Miedema, F. Borgatti, F. Offi, G. Panaccione, and F. de Groot, J. Electron. Spectrosc. Relat. Phenom. 203, 8 (2015).
- Rubio-Zuazo et al. (2018) J. Rubio-Zuazo, A. Chainani, M. Taguchi, D. Malterre, A. Serrano, and G. R. Castro, Phys. Rev. B 97, 235148 (2018).
- Bocquet et al. (1992) A. E. Bocquet, T. Mizokawa, T. Saitoh, H. Namatame, and A. Fujimori, Phys. Rev. B 46, 3771 (1992).
- Haverkort et al. (2012) M. W. Haverkort, M. Zwierzycki, and O. K. Andersen, Phys. Rev. B 85, 165113 (2012).
- Metzner and Vollhardt (1989) W. Metzner and D. Vollhardt, Phys. Rev. Lett. 62, 324 (1989).
- Georges et al. (1996) A. Georges, G. Kotliar, W. Krauth, and M. J. Rozenberg, Rev. Mod. Phys. 68, 13 (1996).
- Hariki et al. (2013b) A. Hariki, Y. Ichinozuka, and T. Uozumi, J. Phys. Soc. Jpn. 82, 023709 (2013b).
- Hariki et al. (2015) A. Hariki, A. Yamanaka, and T. Uozumi, J. Phys. Soc. Jpn. 84, 073706 (2015).
- Hariki et al. (2016) A. Hariki, A. Yamanaka, and T. Uozumi, EPL (Europhysics Letters) 114, 27003 (2016).
- Haverkort et al. (2014) M. W. Haverkort, G. Sangiovanni, P. Hansmann, A. Toschi, Y. Lu, and S. Macke, EPL (Europhysics Letters) 108, 57004 (2014).
- Kim et al. (2004) H.-D. Kim, H.-J. Noh, K. H. Kim, and S.-J. Oh, Phys. Rev. Lett. 93, 126404 (2004).
- Hariki et al. (2018) A. Hariki, M. Winder, and J. Kuneš, Phys. Rev. Lett. 121, 126403 (2018).
- Lüder et al. (2017) J. Lüder, J. Schött, B. Brena, M. W. Haverkort, P. Thunström, O. Eriksson, B. Sanyal, I. Di Marco, and Y. O. Kvashnin, Phys. Rev. B 96, 245131 (2017).
- Kolorenč et al. (2015) J. c. v. Kolorenč, A. B. Shick, and A. I. Lichtenstein, Phys. Rev. B 92, 085125 (2015).
- Kolorenč (2018) J. Kolorenč, Physica B: Condensed Matter 536, 695 (2018).
- PTanuma et al. (1994) S. PTanuma, C. J. Powell, and D. R. Penn, Surface and Interface Analysis 21, 165 (1994), https://onlinelibrary.wiley.com/doi/pdf/10.1002/sia.740210302 .
- Calandra et al. (2012) M. Calandra, J. P. Rueff, C. Gougoussis, D. Céolin, M. Gorgoi, S. Benedetti, P. Torelli, A. Shukla, D. Chandesris, and C. Brouder, Phys. Rev. B 86, 165102 (2012).
- Shirley (1972) D. A. Shirley, Phys. Rev. B 5, 4709 (1972).
- (37) P. Blaha, K. Schwarz, G. Madsen, D. Kvasnicka, and J. Luitz, WIEN2k, An Augmented Plane Wave + Local Orbitals Program for Calculating Crystal Properties (Karlheinz Schwarz, Techn. Universitat Wien, Austria, 2001), ISBN 3-9501031-1-2.
- Mostofi et al. (2014) A. A. Mostofi, J. R. Yates, G. Pizzi, Y.-S. Lee, I. Souza, D. Vanderbilt, and N. Marzari, Comput. Phys. Commun. 185, 2309 (2014).
- Kuneš et al. (2010) J. Kuneš, R. Arita, P. Wissgott, A. Toschi, H. Ikeda, and K. Held, Comput. Phys. Commun. 181, 1888 (2010).
- Pavarini et al. (2011) E. Pavarini, E. Koch, A. Lichtenstein, and D. E. Vollhardt, The LDA+DMFT approach to strongly correlated materials, Schriften des Forschungszentrums Jülich: Modeling and Simulation, Vol. 1 (Forschungszentrum Jülich GmbH, 2011).
- Karolak et al. (2010) M. Karolak, G. Ulm, T. Wehling, V. Mazurenko, A. Poteryaev, and A. Lichtenstein, J. Electron. Spectrosc. Relat. Phenom. 181, 11 (2010).
- Note (2) In the LDA+DMFT calculation, the self-energy depends on the spin in the AF phase.
- Kotliar et al. (2006) G. Kotliar, S. Y. Savrasov, K. Haule, V. S. Oudovenko, O. Parcollet, and C. A. Marianetti, Rev. Mod. Phys. 78, 865 (2006).
- Werner et al. (2006) P. Werner, A. Comanac, L. de’ Medici, M. Troyer, and A. J. Millis, Phys. Rev. Lett. 97, 076405 (2006).
- Gull et al. (2011) E. Gull, A. J. Millis, A. I. Lichtenstein, A. N. Rubtsov, M. Troyer, and P. Werner, Rev. Mod. Phys. 83, 349 (2011).
- Boehnke et al. (2011) L. Boehnke, H. Hafermann, M. Ferrero, F. Lechermann, and O. Parcollet, Phys. Rev. B 84, 075145 (2011).
- Hafermann et al. (2012) H. Hafermann, K. R. Patton, and P. Werner, Phys. Rev. B 85, 205106 (2012).
- Wang et al. (2009) X. Wang, E. Gull, L. de’ Medici, M. Capone, and A. J. Millis, Phys. Rev. B 80, 045101 (2009).
- Jarrell and Gubernatis (1996) M. Jarrell and J. Gubernatis, Phys. Rep. 269, 133 (1996).
- Stavitski and de Groot (2010) E. Stavitski and F. M. de Groot, Micron 41, 687 (2010).
- Matsubara et al. (2005) M. Matsubara, T. Uozumi, A. Kotani, and J. Claude Parlebas, J. Phys. Soc. Jpn. 74, 2052 (2005).
- Sugar (1972) J. Sugar, Phys. Rev. B 5, 1785 (1972).
- Tanaka and Jo (1992) A. Tanaka and T. Jo, J. Phys. Soc. Jpn. 61, 2040 (1992).
- de Groot et al. (1990) F. M. F. de Groot, J. C. Fuggle, B. T. Thole, and G. A. Sawatzky, Phys. Rev. B 42, 5459 (1990).
- (55) R. D. Cowan, The Theory of Atomic Structure and Spectra (University of California Press, Berkeley, 1981), ISBN 0520038215.
- Ginley and Butler (1977) D. S. Ginley and M. A. Butler, Journal of Applied Physics 48, 2019 (1977).
- Note (3) In the present study, we neglect the small off-diagonal elements of .
- Uozumi et al. (1996) T. Uozumi, K. Okada, A. Kotani, Y. Tezuka, and S. Shin, J. Phys. Soc. Jpn. 65, 1150 (1996).
- Uozumi et al. (1997) T. Uozumi, K. Okada, A. Kotani, R. Zimmermann, P. Steiner, S. Hüfner, Y. Tezuka, and S. Shin, J. Electron. Spectrosc. Relat. Phenom. 83, 9 (1997).
- Note (4) For simplicity, octahedral symmetry is assumed and the effect of long-distance hopping (nonlocal screening) is not taken into account in the qualitative discussion.
- Bocquet et al. (1996) A. E. Bocquet, T. Mizokawa, K. Morikawa, A. Fujimori, S. R. Barman, K. Maiti, D. D. Sarma, Y. Tokura, and M. Onoda, Phys. Rev. B 53, 1161 (1996).
- Bair and Goddard (1980) R. A. Bair and W. A. Goddard, Phys. Rev. B 22, 2767 (1980).
- Collart et al. (2006) E. Collart, A. Shukla, J.-P. Rueff, P. Leininger, H. Ishii, I. Jarrige, Y. Q. Cai, S.-W. Cheong, and G. Dhalenne, Phys. Rev. Lett. 96, 157004 (2006).
- Tolentino et al. (1992) H. Tolentino, M. Medarde, A. Fontaine, F. Baudelet, E. Dartyge, D. Guay, and G. Tourillon, Phys. Rev. B 45, 8091 (1992).
- Wu et al. (2004) Z. Y. Wu, D. C. Xian, T. D. Hu, Y. N. Xie, Y. Tao, C. R. Natoli, E. Paris, and A. Marcelli, Phys. Rev. B 70, 033104 (2004).