Structural Transition Kinetics and Activated Behavior in the Superconducting Vortex Lattice
Abstract
Using small-angle neutron scattering, we investigated the behavior of a metastable vortex lattice state in MgB2 as it is driven towards equilibrium by an AC magnetic field. This shows an activated behavior, where the AC field amplitude and cycle count are equivalent to, respectively, an effective “temperature” and “time”. The activation barrier increases as the metastable state is suppressed, corresponding to an aging of the vortex lattice. Furthermore, we find a cross-over from a partial to a complete suppression of metastable domains depending on the AC field amplitude, which may empirically be described by a single free parameter. This represents a novel kind of collective vortex behavior, most likely governed by the nucleation and growth of equilibrium vortex lattice domains.
Structural phase transformations are ubiquitous in solids, exhibiting common features independent of the microscopic properties of a particular material. It is natural to expect that this commonality extends to vortex matter in type-II superconductors. Vortices are of great fundamental interest Huebener (2001); Blatter et al. (1994); Giamarchi and Le Doussal (1995), exhibiting similarities with skyrmions Bauer and Pfleiderer (2010); Nagaosa and Tokura (2013); soft matter systems such as liquid crystals, colloids and granular materials Nagel (2017); and glasses Lubchenko and Wolynes (2007). Each vortex carries one quantum of magnetic flux, and vortex matter thus constitutes an ideal, mono-disperse system. As such, it presents a conceptually simple two-dimensional model system to examine fundamental problems such as structure formation and transformation at the mesoscopic scale, metastable states, and non-equilibrium kinetics.
The presence of metastable non-equilibrium vortex lattice (VL) phases in superconducting MgB2 is well established Das et al. (2012). The metastability is not due to vortex pinning, but represents a novel kind of collective vortex behavior, most likely due to the presence of VL domain boundaries Rastovski et al. (2013). Similar field/temperature history dependent metastability has also recently been reported in connection with skyrmion lattice transitions Makino et al. (2017); Nakajima et al. (2017); Bannenberg et al. (2017). More broadly, domain nucleation and growth governs the behavior of a wide range of physical systems, and one may expect similarities between the VL and e.g. martensitic phase transitions Wang et al. (2017) or domain switching in ferroelectrics Shin et al. (2007). However, the kinetics of structural VL phase transformations has remained largely unexplored both experimentally and theoretically Deutsch and Shapiro (2010); Durkin et al. .
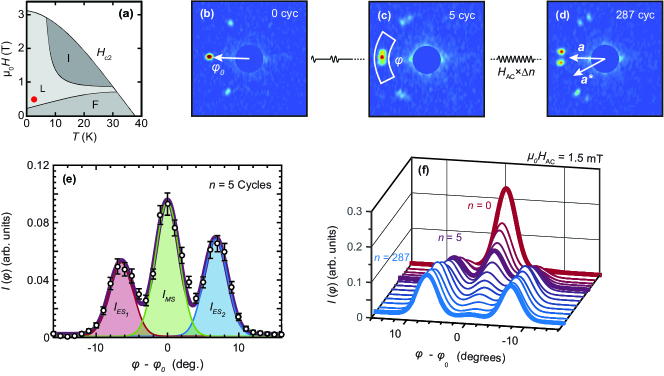
Here we report the results of small-angle neutron scattering (SANS) measurements, using AC magnetic fields of varying amplitude to gradually drive the VL from the metastable state (MS) to the equilibrium state (ES). The equilibrium VL phase diagram for the hexagonal superconductor MgB2, shown in Fig. 1(a), is composed of three hexagonal configurations denoted F, L and I Das et al. (2012); Hirano et al. (2013). In both the F [Fig. 1(b)] and I phases a single global orientational order is observed in the VL diffraction patterns, indicated by six Bragg peaks aligned with respectively the and direction within the crystalline basal plane. In the intermediate L phase [Fig. 1(d)], the VL rotates continuously from the to the orientation, where the presence of both clockwise and counterclockwise domain rotations leads to 12 Bragg peaks. Cooling or heating across the F-L or L-I phase transitions leaves the VL in a metastable state, as thermal excitations are insufficient to drive the system to equilibrium Das et al. (2012).
Measurements were performed on the GP-SANS beam line at the High Flux Isotope Reactor at Oak Ridge National Laboratory, and the D33 beam line at Institut Laue-Langevin. The final data presented here was collected at D33 Eskildsen et al. (2016), but consistent results were found at both facilities. The SANS measurements were performed in a conventional VL setup, with both the incident neutrons and the magnetic field parallel to the neutron beam Mühlbauer et al. . We used the same 200 g single crystal of MgB2 ( K, T) as in prior studies Karpinski et al. (2003); Das et al. (2012); Rastovski et al. (2013). However, VL metastability was confirmed in other crystals of MgB2 Das et al. (2012), and recently also in samples from a different source Louden et al. . Further details concerning the SANS experiment are given in the Supplemental Material SM .
A typical SANS measurement sequence is illustrated in Fig. 1, including representative VL diffraction patterns obtained at various stages along the transition. All measurements were performed at 2.6 K with 0.5 T applied parallel to the crystal axis. Prior to each measurement sequence, a pristine MS VL was prepared as follows. First, an equilibrium VL was obtained in the F phase ( K), by performing a damped oscillation of the DC magnetic field with an initial amplitude of 50 mT Das et al. (2012). As the VL density is directly proportional to the applied field, this leads to a breathing motion where vortices are pushed into and out of the sample. In superconductors with low pinning, this results in a well-ordered, equilibrium VL configuration Levett et al. (2002). In the present case of MgB2, this is confirmed by the sharp Bragg peaks evident in Fig. 1(b)-(d) and discussed in more detail in the Supplemental Material SM . Following the damped field oscillation the ES VL was cooled to 2.6 K across the F-L phase boundary to obtain a MS.
We used a stop-motion technique, alternating between imaging the VL by SANS and using a bespoke coil to apply a controlled number () of 250 Hz AC field cycles with amplitudes () between 0.5 and 1.5 mT parallel to the DC field used to create the VL. The small AC field, roughly two orders of magnitude less than the damped oscillation used to prepare the pristine MS, causes the VL to evolve gradually towards the ES and allows for a detailed study of the relaxation process. The pristine MS VL [Fig. 1(b)], imaged before the application of any AC cycles, shows a single F phase Bragg peak along the direction. After application of 5 AC cycles [Fig. 1(c)], the coexistence of both MS and ES () Bragg peaks are observed. Following a total of 287 cycles [Fig. 1(d)], only peaks corresponding to the equilibrium L phase are seen clearly. To make efficient use of the neutron beam time measurements were performed at a single angular setting, with only peaks at the left side of the detector satisfying the Bragg condition.
For a quantitative analysis, we consider the azimuthal intensity distribution , fitted by a three-peak Gaussian as shown in Fig. 1(e) SM . Here each peak corresponds to the scattering contribution from one of the three possible VL domain orientations. Fits for the entire MS to ES measurement sequence are shown in Fig. 1(f). As the number of applied AC cycles is increased, the central Bragg peak associated with the MS F phase gradually loses intensity, and outer ES L phase peaks emerge. At the end of the measurement sequence, the L phase is achieved within a majority of the sample, with only a small remnant intensity at . We note that the MS to ES transition proceeds in a discontinuous manner, with VL domains nucleating at one of the two equilibrium orientations and subsequently growing at the expense of the metastable domains. This is in striking contrast to the continuous transition observed for the equilibrium VL, where domains gradually rotate away from as a function of magnetic field and/or temperature Das et al. (2012).
The integrated intensity of the Bragg peaks obtained from the fits, is proportional to the number of vortices within each of the corresponding VL domain orientations. Thus, the volume fraction of the sample remaining in the MS can be determined by dividing the intensity of the F phase () peak with the total scattered intensity:
| (1) |
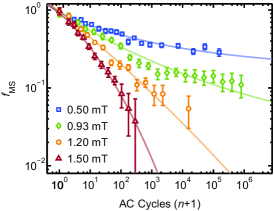
Figure 2 shows the metastable volume fraction versus the number of applied cycles for the different AC field amplitudes used in this work. With increasing , fewer AC cycles are required to suppress . Moreover, the curvature of , plotted on a log-log scale, changes from positive ( mT) to negative ( mT).
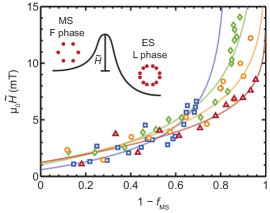
The presence of long lived metastable phases in MgB2 cannot be understood based on the single domain free energy Das et al. (2012). Rather, the presence of additional energy barriers are required to prevent the individual VL domains from rotating to the equilibrium orientation, illustrated in the inset to Fig. 3. The absence of any thermally driven relaxation towards the ES within experimental time scales is consistent with the small Ginzburg number for MgB2 Klein et al. (2010). This also implies that the properties of the initial MS VL prepared before each measurement sequence will not depend on the F phase temperature or the cooling rate. It is also important to note that transient behavior of the MS to ES transition sets these results apart from conventional vortex dynamics focusing on the current carrying capabilities of superconductors, with the latter focusing on (non-equilibrium) steady states Blatter et al. (1994).
The vortices move in response to the AC field, and it is natural to analyze the SANS data using an activated behavior. In this context the AC amplitude and cycle count take the role of, respectively, the effective “temperature” and “time”. Thus, the decay rate of the metastable volume fraction is given by
| (2) |
where is the activation field representing the barrier between metastable and equilibrium VL domain orientations. The proportionality to accounts for the amount of metastable VL volume available for ES domain nucleation and/or growth.
Figure 3 shows the activation field obtained directly from the data in Fig. 2. Each value of was determined from two adjacent values of by . Within the scatter of the data, collapses onto a single curve for , suggesting a near universal behavior consistent with an activated transition. Surprisingly, the activation field increases as the metastable volume fraction decreases. The change of with “time” (), is equivalent to an aging of the VL Henkel and Pleimling (2010). For the activation field for the different values of begins to diverge.
To parameterize the MS to ES transition, the metastable volume fraction was fitted by
| (3) |
This functional form is motivated by the saturation of observed for and mT. For , it corresponds to a stretched exponential function frequently used to model relaxation phenomena Klafter and Shlesinger (1986). As seen in Fig. 2, the fits provide an excellent description of the data for all AC field amplitudes. From these, the activation field curves shown in Fig. 3 may be directly calculated by
| (4) |
where
| (5) |
and . When and are both negative, is the saturation value of as . The metastable VL states are due to the non-zero value of , which prevents a spontaneous onset of the MS to ES transition.
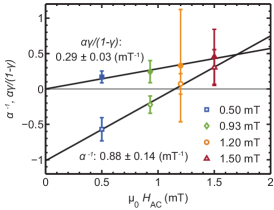
The cross-over from positive to negative curvature in Fig. 2 is directly reflected in the evolution of , as shown in Fig. 4. Here we find a linear dependence on the AC amplitude and a sign change, yielding a cross-over field 1.2 0.3 mT. In addition, (also shown) is found to be directly proportional to the AC field amplitude. Finally, since for all values of , for all fits SM . Consequently, the MS to ES transition is determined by a single parameter, which depends only on . Further theoretical studies of VL kinetics, including the effect of domain boundaries, are required to explain this empirical result. One possible cause for the observed cross-over is a change in the relative magnitude of the activation barriers for the nucleation and growth of the ES VL domains Liu et al. (2004).
Due to the many similarities between vortices and skyrmions, the kinetic properties reported here for the VL may also occur for metastable skyrmion lattice phases Makino et al. (2017); Nakajima et al. (2017); Bannenberg et al. (2017). Of particular relevance is the possibility of inducing rotational transitions in the skyrmion lattice, either thermally Pöllath et al. (2017) or by the application of AC magnetic fields White et al. (2014). We also note the resemblance of the MgB2 VL to structural martensitic phase transitions such as the tetragonal-to-orthorhombic transition in cuprate superconductors Beyers et al. (1987); Chen et al. (1987) and the -to- transition in iron Kalantar et al. (2005); Wang et al. (2017). In these systems, there are two equal energy pathways from the initial to the final structure. The final configuration is a periodic twin-boundary lattice rather than the lowest energy configuration of a single global domain, with the interface between the initial phase and the twinned phases providing the necessary stabilizing force Barsch et al. (1987). An increasing activation energy, such as the one reported here for the VL, has also been found for isothermal martensitic phase transformations in maraging steel San Martin et al. (2010).
Finally, glasses are the quintessential example of a supercooled, metastable configuration observed in conjunction with a thermally driven transition. The metastable VL states in MgB2 show many parallels to supercooled liquids and other structural glasses, such as an activated transition between states resulting from a complicated energy landscape and a behavior that is governed by domains/domain walls Lubchenko and Wolynes (2007); Nussinov (2017). The slowing kinetics (aging) and the diverging activation barrier in Fig. 3 provides further support for this analogy, which could be explored further by measuring flux creep in response to transport currents below the vortex de-pinning threshold.
In summary, we have studied the metastable to equilibrium state transition kinetics for the vortex lattice in MgB2 under the influence of an AC magnetic field. The kinetics display an activated behavior, with the AC field amplitude and cycle count acting as respectively an effective “temperature” and “time”. The activation barrier increases gradually as the metastable state is suppressed, indicating an aging of the vortex lattice. The transition towards the ES shows a cross-over between partial and complete suppression of metastable domains as the AC field amplitude is increased. Empirically, we find that the MS to ES transition can be described by a single parameter which is determined by the AC amplitude.
Further studies to provide real space information about VL dislocations, grain boundaries and domain formation, either experimentally (e.g. by STM) or by non-equilibrium molecular dynamics simulations Pöllath et al. (2017); Olszewski et al. (2018), would be a valuable complement to our SANS results and interpretation. This would also allow us to connect our observations to results in other classes of materials, such as the recent study of grain boundary kinetics in two-dimensional triangular colloidal crystals Lavergne et al. (2018).
We are grateful to J. Karpinski for providing the MgB2 single crystal used for this work. We acknowledge useful discussions with G. Blatter, B. Janko, K. Newman, Z. Nussinov, M. Pleimlimg, and U. C. Täuber, and assistance with the SANS experiments from J. Archer. This work was supported by the U.S. Department of Energy, Office of Basic Energy Sciences, under Award No. DE-SC0005051. A portion of this research used resources at the High Flux Isotope Reactor, a DOE Office of Science User Facility operated by the Oak Ridge National Laboratory.
References
- Huebener (2001) R. P. Huebener, Magnetic Flux Structures in Superconductors, 2nd ed. (Springer, 2001).
- Blatter et al. (1994) G. Blatter, M. V. Feigel’man, V. B. Geshkenbein, A. I. Larkin, and V. M. Vinokur, Rev. Mod. Phys. 66, 1125 (1994).
- Giamarchi and Le Doussal (1995) T. Giamarchi and P. Le Doussal, Phys. Rev. B 52, 1242 (1995).
- Bauer and Pfleiderer (2010) A. Bauer and C. Pfleiderer, in Topological Structures in Ferroic Materials, edited by J. Seidel (Springer, 2010) pp. 1–28.
- Nagaosa and Tokura (2013) N. Nagaosa and Y. Tokura, Nat. Nanotechnol. 8, 899 (2013).
- Nagel (2017) S. R. Nagel, Rev. Mod. Phys. 89, 025002 (2017).
- Lubchenko and Wolynes (2007) V. Lubchenko and P. G. Wolynes, Annu. Rev. Phys. Chem. 58, 235 (2007).
- Das et al. (2012) P. Das, C. Rastovski, T. R. O’Brien, K. J. Schlesinger, C. D. Dewhurst, L. DeBeer-Schmitt, N. D. Zhigadlo, J. Karpinski, and M. R. Eskildsen, Phys. Rev. Lett. 108, 167001 (2012).
- Rastovski et al. (2013) C. Rastovski, K. J. Schlesinger, W. J. Gannon, C. D. Dewhurst, L. DeBeer-Schmitt, N. D. Zhigadlo, J. Karpinski, and M. R. Eskildsen, Phys. Rev. Lett. 111, 107002 (2013).
- Makino et al. (2017) K. Makino, J. D. Reim, D. Higashi, D. Okuyama, T. J. Sato, Y. Nambu, E. P. Gilbert, N. Booth, S. Seki, and Y. Tokura, Phys. Rev. B 95, 134412 (2017).
- Nakajima et al. (2017) T. Nakajima, H. Oike, A. Kikkawa, E. P. Gilbert, N. Booth, K. Kakurai, Y. Taguchi, Y. Tokura, F. Kagawa, and T. Arima, Sci. Adv. 3, e1602562 (2017).
- Bannenberg et al. (2017) L. J. Bannenberg, F. Qian, R. M. Dalgliesh, N. Martin, G. Chaboussant, M. Schmidt, D. L. Schlagel, T. A. Lograsso, H. Wilhelm, and C. Pappas, Phys. Rev. B 96, 184416 (2017).
- Wang et al. (2017) K. Wang, J. Chen, X. Zhang, and W. Zhu, J. Appl. Phys. 122, 105107 (2017).
- Shin et al. (2007) Y.-H. Shin, I. Grinberg, I.-W. Chen, and A. M. Rappe, Nature 449, 881 (2007).
- Deutsch and Shapiro (2010) E. Deutsch and B. Y. Shapiro, Supercond. Sci. Technol. 23, 125004 (2010).
- (16) M. Durkin, I. Mondragon-Shem, T. L. Hughes, and N. Mason, arXiv:1708.03082 .
- Hirano et al. (2013) T. Hirano, K. Takamori, M. Ichioka, and K. Machida, J. Phys. Soc. Japan 82, 063708 (2013).
- Eskildsen et al. (2016) M. R. Eskildsen, J. Archer, E. De Waard, C. Dewhurst, D. Honecker, and J. White, Institut Laue-Langevin (ILL) doi: 10.5291/ILL-DATA.5-42-420 (2016).
- (19) S. Mühlbauer, D. Honecker, E. A. Périgo, F. Bergner, S. Disch, A. Heinemann, S. Erokhin, D. Berkov, C. Leighton, M. R. Eskildsen, and A. Michels, to appear in Rev. Mod. Phys .
- Karpinski et al. (2003) J. Karpinski, M. Angst, J. Jun, S. M. Kazakov, R. Puzniak, A. Wisniewski, J. Roos, H. Keller, A. Perucchi, L. Degiorgi, M. R. Eskildsen, P. Bordet, L. Vinnikov, and A. Mironov, Supercond. Sci. Technol. 16, 213 (2003).
- (21) E. R. Louden, S. Manni, M. R. Eskildsen, J. Barker, L. DeBeer-Schmitt, C. D. Dewhurst, and P. C. Canfield, unpublished .
- (22) Supplemental Material.
- Levett et al. (2002) S. J. Levett, C. D. Dewhurst, and D. M. Paul, Phys. Rev. B 66, 014515 (2002).
- Klein et al. (2010) T. Klein, R. Marlaud, C. Marcenat, H. Cercellier, M. Konczykowski, C. J. van der Beek, V. Mosser, H. S. Lee, and S. I. Lee, Phys. Rev. Lett. 105, 047001 (2010).
- Henkel and Pleimling (2010) M. Henkel and M. Pleimling, Non-Equilibrium Phase Transitions, Volume 2: Ageing and Dynamical Scaling Far from Equilibrium (Springer, 2010).
- Klafter and Shlesinger (1986) J. Klafter and M. F. Shlesinger, Proc. Natl. Acad. Sci. U.S.A. 83, 848 (1986).
- Liu et al. (2004) F. Liu, F. Sommer, and E. J. Mittemeijer, J. Mater. Sci. 39, 1621 (2004).
- Pöllath et al. (2017) S. Pöllath, J. Wild, L. Heinen, T. N. G. Meier, M. Kronseder, L. Tutsch, A. Bauer, H. Berger, C. Pfleiderer, J. Zweck, A. Rosch, and C. H. Back, Phys. Rev. Lett. 118, 207205 (2017).
- White et al. (2014) J. S. White, K. Prša, P. Huang, A. A. Omrani, I. Živković, M. Bartkowiak, H. Berger, A. Magrez, J. L. Gavilano, G. Nagy, J. Zang, and H. M. Rønnow, Phys. Rev. Lett. 113, 107203 (2014).
- Beyers et al. (1987) R. Beyers, G. Lim, E. M. Engler, R. J. Savoy, T. M. Shaw, T. R. Dinger, W. J. Gallagher, and R. L. Sandstrom, Appl. Phys. Lett. 50, 1918 (1987).
- Chen et al. (1987) C. H. Chen, D. J. Werder, S. H. Liou, J. R. Kwo, and M. Hong, Phys. Rev. B 35, 8767 (1987).
- Kalantar et al. (2005) D. H. Kalantar, J. F. Belak, G. W. Collins, J. D. Colvin, H. M. Davies, J. H. Eggert, T. C. Germann, J. Hawreliak, B. L. Holian, K. Kadau, P. S. Lomdahl, H. E. Lorenzana, M. A. Meyers, K. Rosolankova, M. S. Schneider, J. Sheppard, J. S. Stölken, and J. S. Wark, Phys. Rev. Lett. 95, 075502 (2005).
- Barsch et al. (1987) G. R. Barsch, B. Horovitz, and J. A. Krumhansl, Phys. Rev. Lett. 59, 1251 (1987).
- San Martin et al. (2010) D. San Martin, N. H. van Dijk, E. Jiménez-Melero, E. Kampert, U. Zeitler, and S. van der Zwaag, Mater. Sci. Eng. A 527, 5241 (2010).
- Nussinov (2017) Z. Nussinov, Phil. Mag. 97, 1509 (2017).
- Olszewski et al. (2018) M. W. Olszewski, M. R. Eskildsen, C. Reichhardt, and C. J. O. Reichhardt, New J. Phys. 20, 023005 (2018).
- Lavergne et al. (2018) F. A. Lavergne, A. Curran, D. G. A. L. Aarts, and R. P. A. Dullens, Proc. Natl. Acad. Sci. U.S.A. 115, 6922 (2018).