An Interactive, Graphical
CPU Scheduling Simulator
for Teaching Operating Systems
Abstract
We present a graphical simulation tool for visually and interactively exploring the processing of various events handled by an operating system when running a program. Our graphical simulator is available for use on the web and locally by both instructors and students for purposes of pedagogy. Instructors can use it for live demonstrations of course concepts in class, while students can use it outside of class to explore the concepts. The graphical simulation tool is implemented using the React library for the fancy ui elements of the Node.js framework and is available as a single page web application at https://cpudemo.azurewebsites.net. Assigning the development of the underling text-based simulation engine, on which the graphical simulator runs, to students as a course project is also an effective approach to teach students the concepts. The goals of this paper are to showcase the demonstrative capabilities of the tool for instruction, share student experiences in developing the engine underlying the simulation, and to inspire its use by other educators.
Keywords:
Node.js; operating systems pedagogy; process scheduling; React library; semaphore processing.
1 Introduction
We present a graphical simulation tool for visually and interactively exploring the processing of a variety of events handled by an operating system when running a program [1]. Our tool graphically demonstrates a host of concepts of preemptive, multi-tasking operating systems, including scheduling algorithms, i/o processing, interrupts, context switches, task structures (i.e., process control blocks), and semaphore processing [2].

Our graphical tool was designed to run on top of a solution to a text-based course programming project—here after referred to as the underlying simulation engine—in which students design and implement a system that simulates some of the job and cpu scheduling, and semaphore processing of a time-shared operating system (os). The complete project specification for the underlying simulation engine is available at http://perugini.cps.udayton.edu/teaching/courses/Fall2015/cps356/projects/p2.html.111A specification for the underlying simulation engine without system semaphores is available at http://perugini.cps.udayton.edu/teaching/courses/Fall2019/cps356/#midterm. The architectural view of the underling simulation engine, which also serves to convey some of the project/system requirements, is shown in Figure 1. While processes from the second-level ready queue receive a larger quantum than those from the first-level ready queue (300 versus 100), processes on the first-level ready queue always have priority over processes on the second-level ready queue. In Figure 1, notice that once a process from the first-level ready queue has received a full quantum it is promoted to the second-level ready queue. However, if a process from the second-level ready queue requires i/o, it is demoted back to the first-level ready queue once it receives that i/o. Students are familiar with the concepts of job and processing scheduling, non-preemptive and preemptive scheduling algorithms, as well as semaphores prior to working on this project. See http://perugini.cps.udayton.edu/teaching/courses/cps346/lecture_notes/scheduling.html (scheduling) and http://perugini.cps.udayton.edu/teaching/courses/cps346/lecture_notes/semaphores.html (semaphores) for more information.
While demonstrating os concepts using physical computer hardware and real operating systems is effective, a software simulation is less expensive to develop and more easily configurable. For instance, users of our tool have control over both the time-based events and the parameters of the system (e.g., quantum size and main memory constraints) that are less easily controllable at the user level in a real computing system. Moreover, a visual simulation graphically reveals the internal processing of and event handling within an os from which the user is typically shielded. The ability to step through the handling of events (e.g., new process creation, process termination, i/o completion, a context switch) enabled by our tool in user-defined steps of cpu time is formative in students’ conceptualization, comprehension, and visualization of these complex processes at work within an os.
The graphical simulation tool is implemented using the React library for the fancy ui elements of the Node.js framework and is available as a web application at https://cpudemo.azurewebsites.net/. Our graphical simulator is available for use on the web as well as locally by both instructors and students for purposes of pedagogy. Instructors can use it to for live demonstrations of course concepts in class, while students can use it outside of class to explore the concepts. Assigning the development of the underling text-based simulation engine, on which the graphical simulator runs, to students as a course project is also an effective approach to teach students the concepts—more on this below.
2 Simulation Details
The top of the left-most column of the tool, shown in Figure 2, contains a list of incoming external events in the current session. Below the incoming external event list is a list of jobs rejected by the system because each requires more memory than the total system memory. At the bottom of the left-most column of the tool is the job scheduling queue (in secondary memory), which lists all jobs that are waiting for main memory to become available before they can be moved to the ready queue. The middle columns of the tool contain the multi-level, fifo ready queue, the i/o wait queue, and the semaphore wait queues. The right-most column of the tool contains a block representing the cpu, and a list of the completed processes. Above the cpu, the available system memory is shown.
The user can step through events in multiple ways. The top of the tool shows the current simulation time, which the user can modify at any time with values between 0 and 30,000. Alternatively, the user can use the slider bar handle to advance or subtract up to 250 units of simulation time at once. Upon changing the time with the slider bar, the handle resets to the middle position and the user can again advance or subtract up to 250 units of time. There are also controls to allow the user to step forward to the next or backward to the previous simulation event. Finally, there is a button labeled ‘Complete Run’ to fully run the simulator and produce the output (i.e., a variety of turnaround and wait time statistics) of the underlying text-based simulation engine in one stroke.
There are seven events in this simulator: four external events (i.e., given in the incoming external event list) and three internal events222There are really eight events because there is a display simulator status external event which while relevant in the text-based interface to the underlying simulation engine is not applicable to the graphical interface presented here.. The four external events are a new job arrival, an i/o request, a semaphore wait and a semaphore signal. The three internal events are process termination, quantum expiration, and i/o completion. If an external and internal event collide (i.e., occur at the same time), the internal event is processed first. The events are automatically processed in the background and the event navigation buttons allow a user to see every change that occurs in the simulation. At any point, the user may click the button labeled ‘Reset Run’ to return the simulation time to 0.
2.1 Customization: Tuning the Simulation Parameters
There are several ways in which a user can customize the simulation. The button labeled ‘Settings’ opens a dialog window, shown in Figure 3, with several simulation variables that can be tuned. The user can set the quantum for each level of the fifo ready queue. Setting the quantum of a particular level of the ready queue to 0, sets the scheduling algorithm to be ‘first-come, first-served’ (fcfs)—a non-preemptive algorithm—for that level. The user can also select a simulation scenario (i.e., a sequence of incoming external events) from a drop-down menu of canned event scenarios. Alternatively, a user can upload their own simulation scenario as text file. Creating and importing such custom sequences of simulation events is helpful for demonstrating specific scenarios, especially event collisions. The user can also change the current values of any of the semaphores and set the maximum memory available to the simulation. Jobs that require more memory than the system maximum are rejected and placed in the list of jobs rejected by the system. When a job is rejected by the system for any reason, an alert is displayed in the tool. There is a toggle available for disabling or enabling these alerts. Finally, another toggle is available that will simplify the tool layout by hiding the semaphore queues and enlarging the other queues. The simplified layout is shown in Figure 4.
2.2 Example Simulation Scenario
Figure 2 shows the system before any events occur. In Figure 5, 100 units of time have elapsed and the first event occurs—a new job arrival—identified by the letter ‘a’ in the first column of the incoming external events list (see Figure 2). Note that the job id, and runtime and memory requirements are also provided in the incoming external events list. The new job immediately moves into the job scheduling queue, which triggers the job scheduling algorithm. Since job 1 requires 20 units of memory and 512 units are available, job 1 is immediately loaded into the first level of the ready queue. Since the cpu is idle at this point, the arrival of a process in the ready queue triggers the cpu scheduling algorithm, which moves process 1 from the ready queue and onto the cpu with a quantum of 100 units of time. While this simulation does not currently factor in the time required for the overhead of a cpu context switch, process 1 does not run until the next clock cycle of the cpu. A summary of time stamp 100 is: the first job arrived and was instantaneously loaded onto the cpu (through the job queue and first-level ready queue). At time 101, shown in Figure 6, process 1 runs for 1 unit of the 78 required units of time before completion and has a remaining quantum of 99 clock cycles. Since the remaining quantum for process 1 is 99 units of time, the process would finish without time-slicing, but may require i/o or a semaphore in the interim. The incoming external events list in Figure 6 shows that the next incoming external event—another new job arrival—occurs at simulation time 120.
Clicking the button labeled ‘Next Event’ to the right of the simulation time automatically advances the time to the next event. At this point, the next event is the next incoming external event as opposed to an internal event. At time 119, process 1 has run for a total of 19 units of time, and requires 59 additional units of time until completion. During the next unit of time, shown in Figure 7, a new job arrives. It is moved into the job queue, which triggers the job scheduling algorithm. Since job 2 requires 60 units of memory, and there are 492 units available, job 2 is immediately loaded into the first level of the ready queue. Since the cpu is busy with process 1 at this point in time, process 2 must wait in the ready queue until the cpu is available.
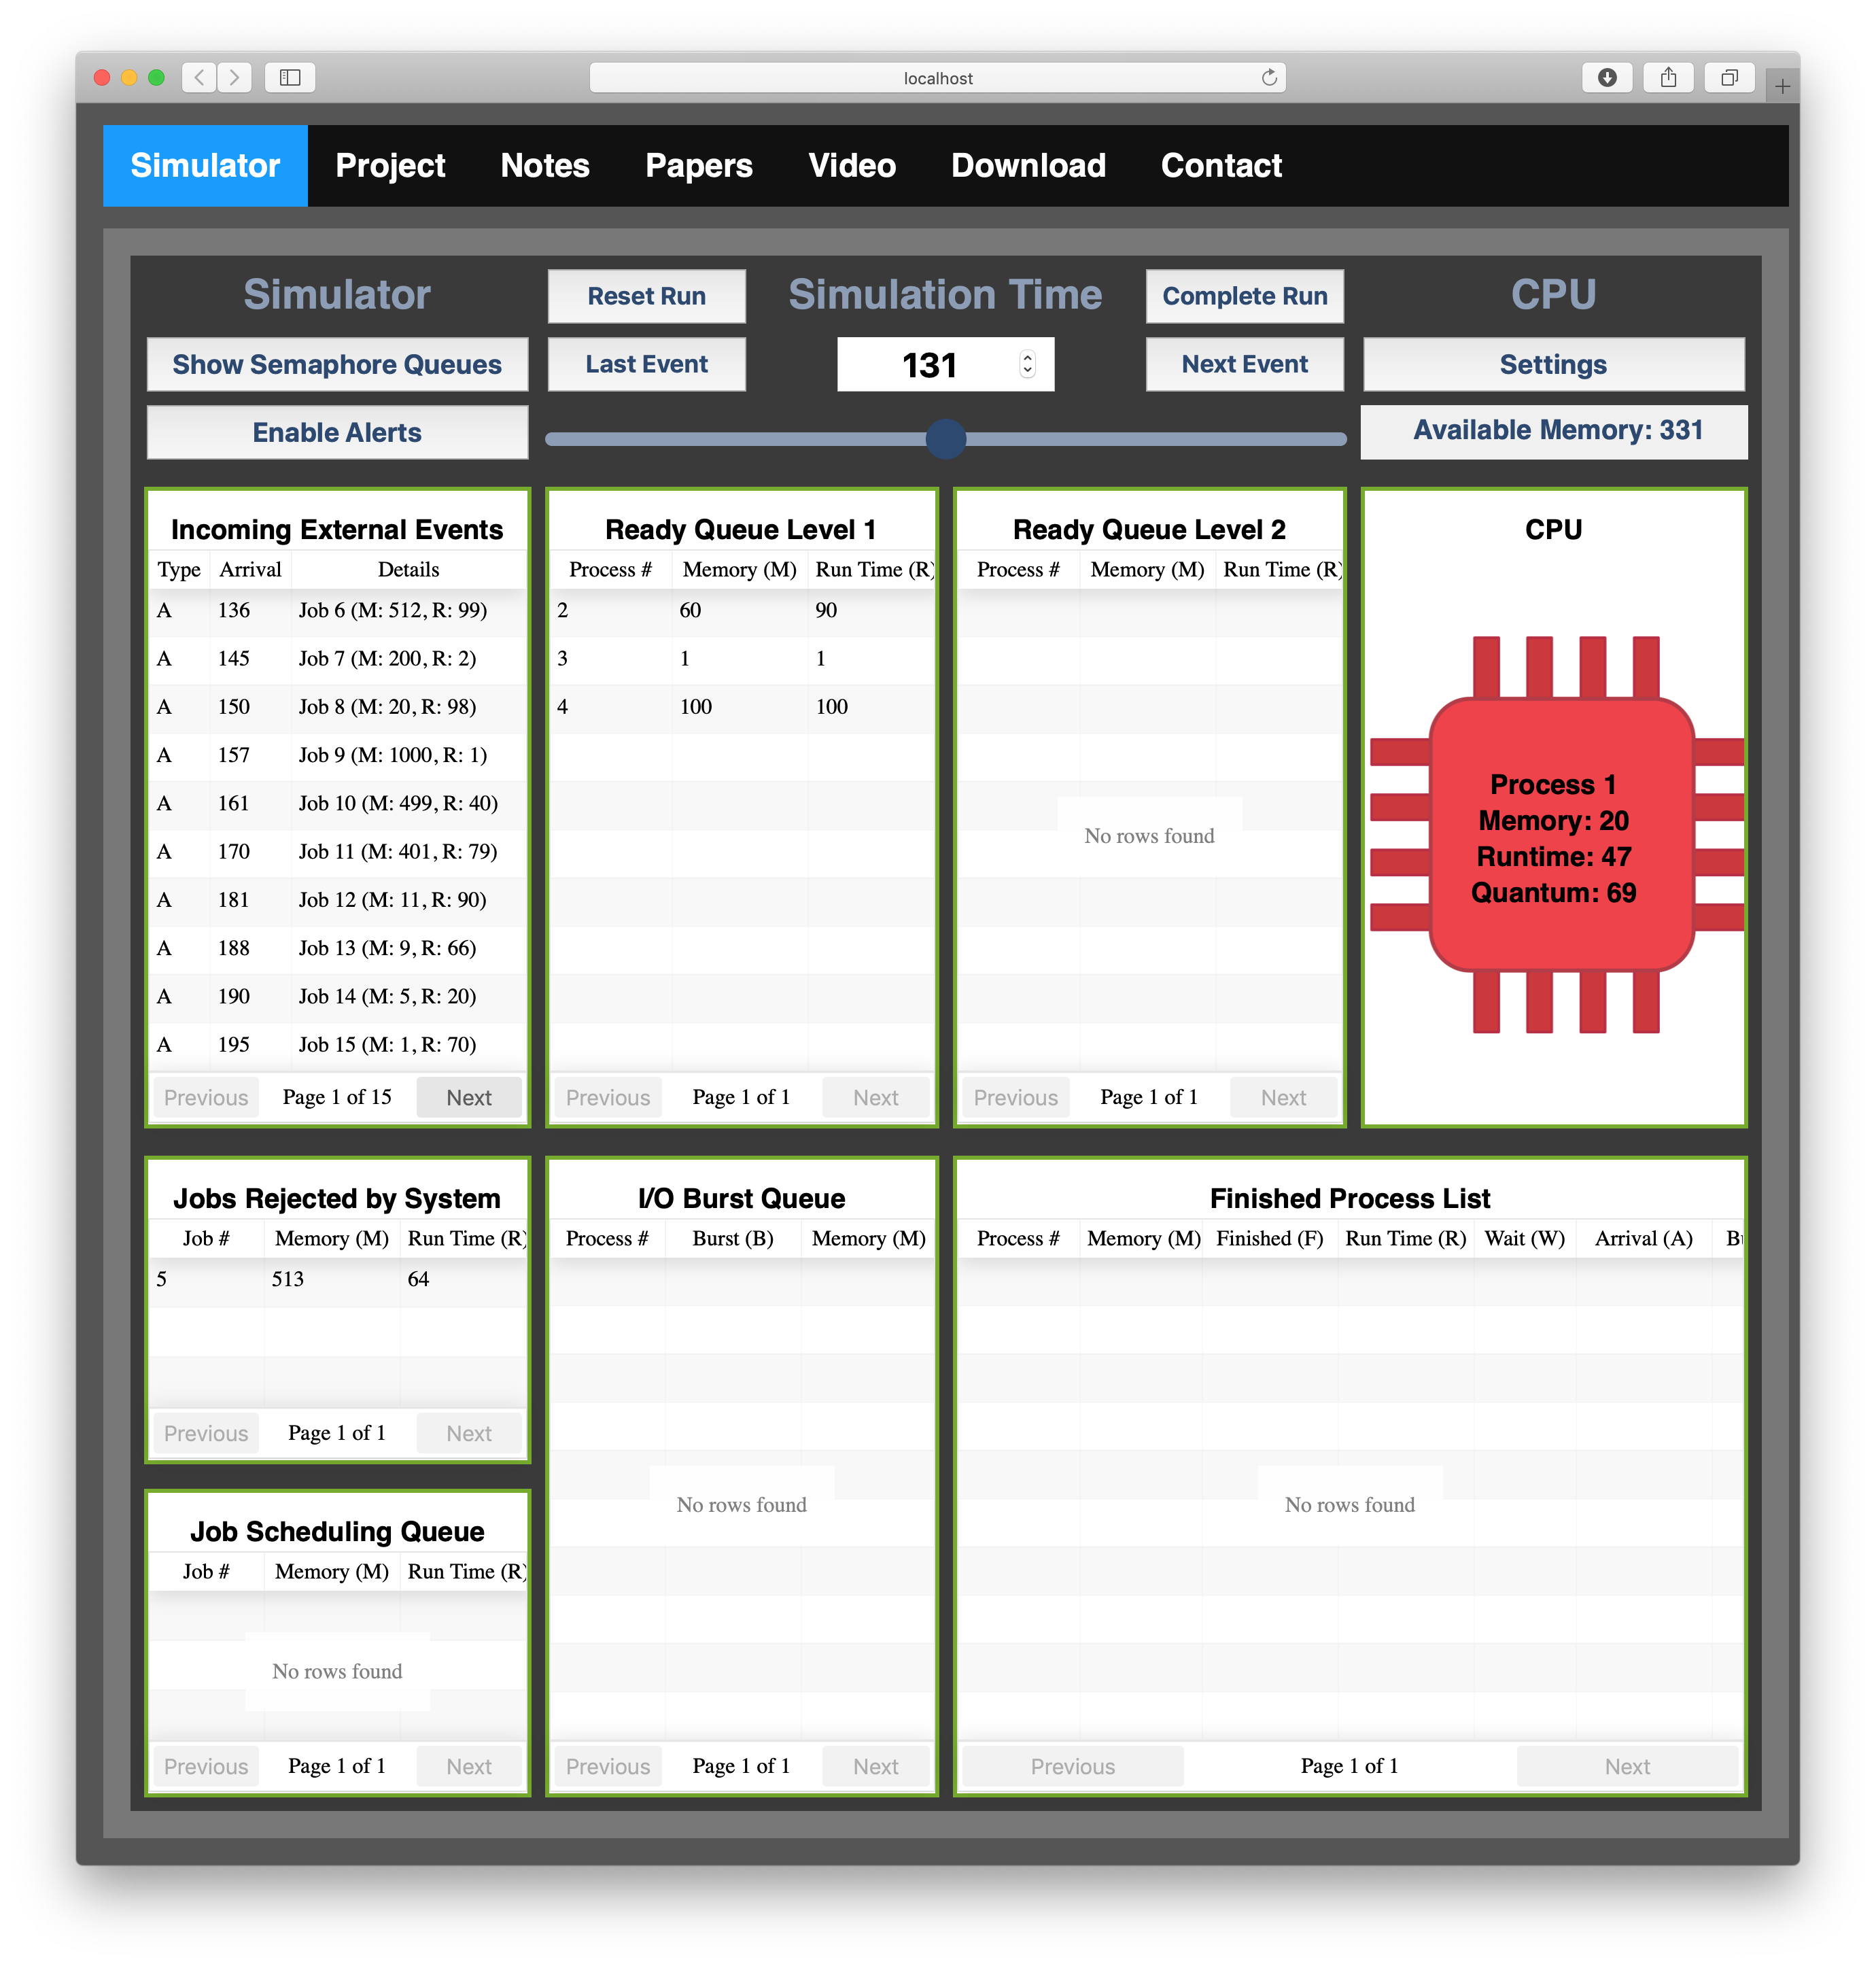
Clicking the ‘Next Event’ button twice more brings the simulation to time 130, shown in Figure 8, where two new jobs have been loaded into the ready queue. At time 131, there is an incoming external event for the arrival of job 5. However, job 5 requires 513 units of memory, which is greater than the main memory capacity of the system (i.e., 512 units of total memory that the simulation supports). In this simulation, since there is not enough memory to accommodate job 5, it can never run and, thus, is rejected with the alert popup message shown in Figure 9. This presents an opportunity to mention to students that in a virtual memory management scheme—a forth-coming topic—this job would be runnable, even though it exceeds the total amount of system memory. To disable alerts, a user can toggle the button labeled ‘Disable Alerts’ above the incoming external events list (see Figure 8). After closing the alert, the simulation time is 131, shown in Figure 10, where the rejected job 5 is in the list of jobs rejected by the system. At time 136, job 6, which requires exactly 512 units of memory, arrives. While this job enters the job queue (which is in secondary memory), it will not be permitted to enter the ready queue (which is in main memory) until all processes in main memory have fully completed (i.e., terminated). At that point, the full 512 units of memory are free and available for job 6.
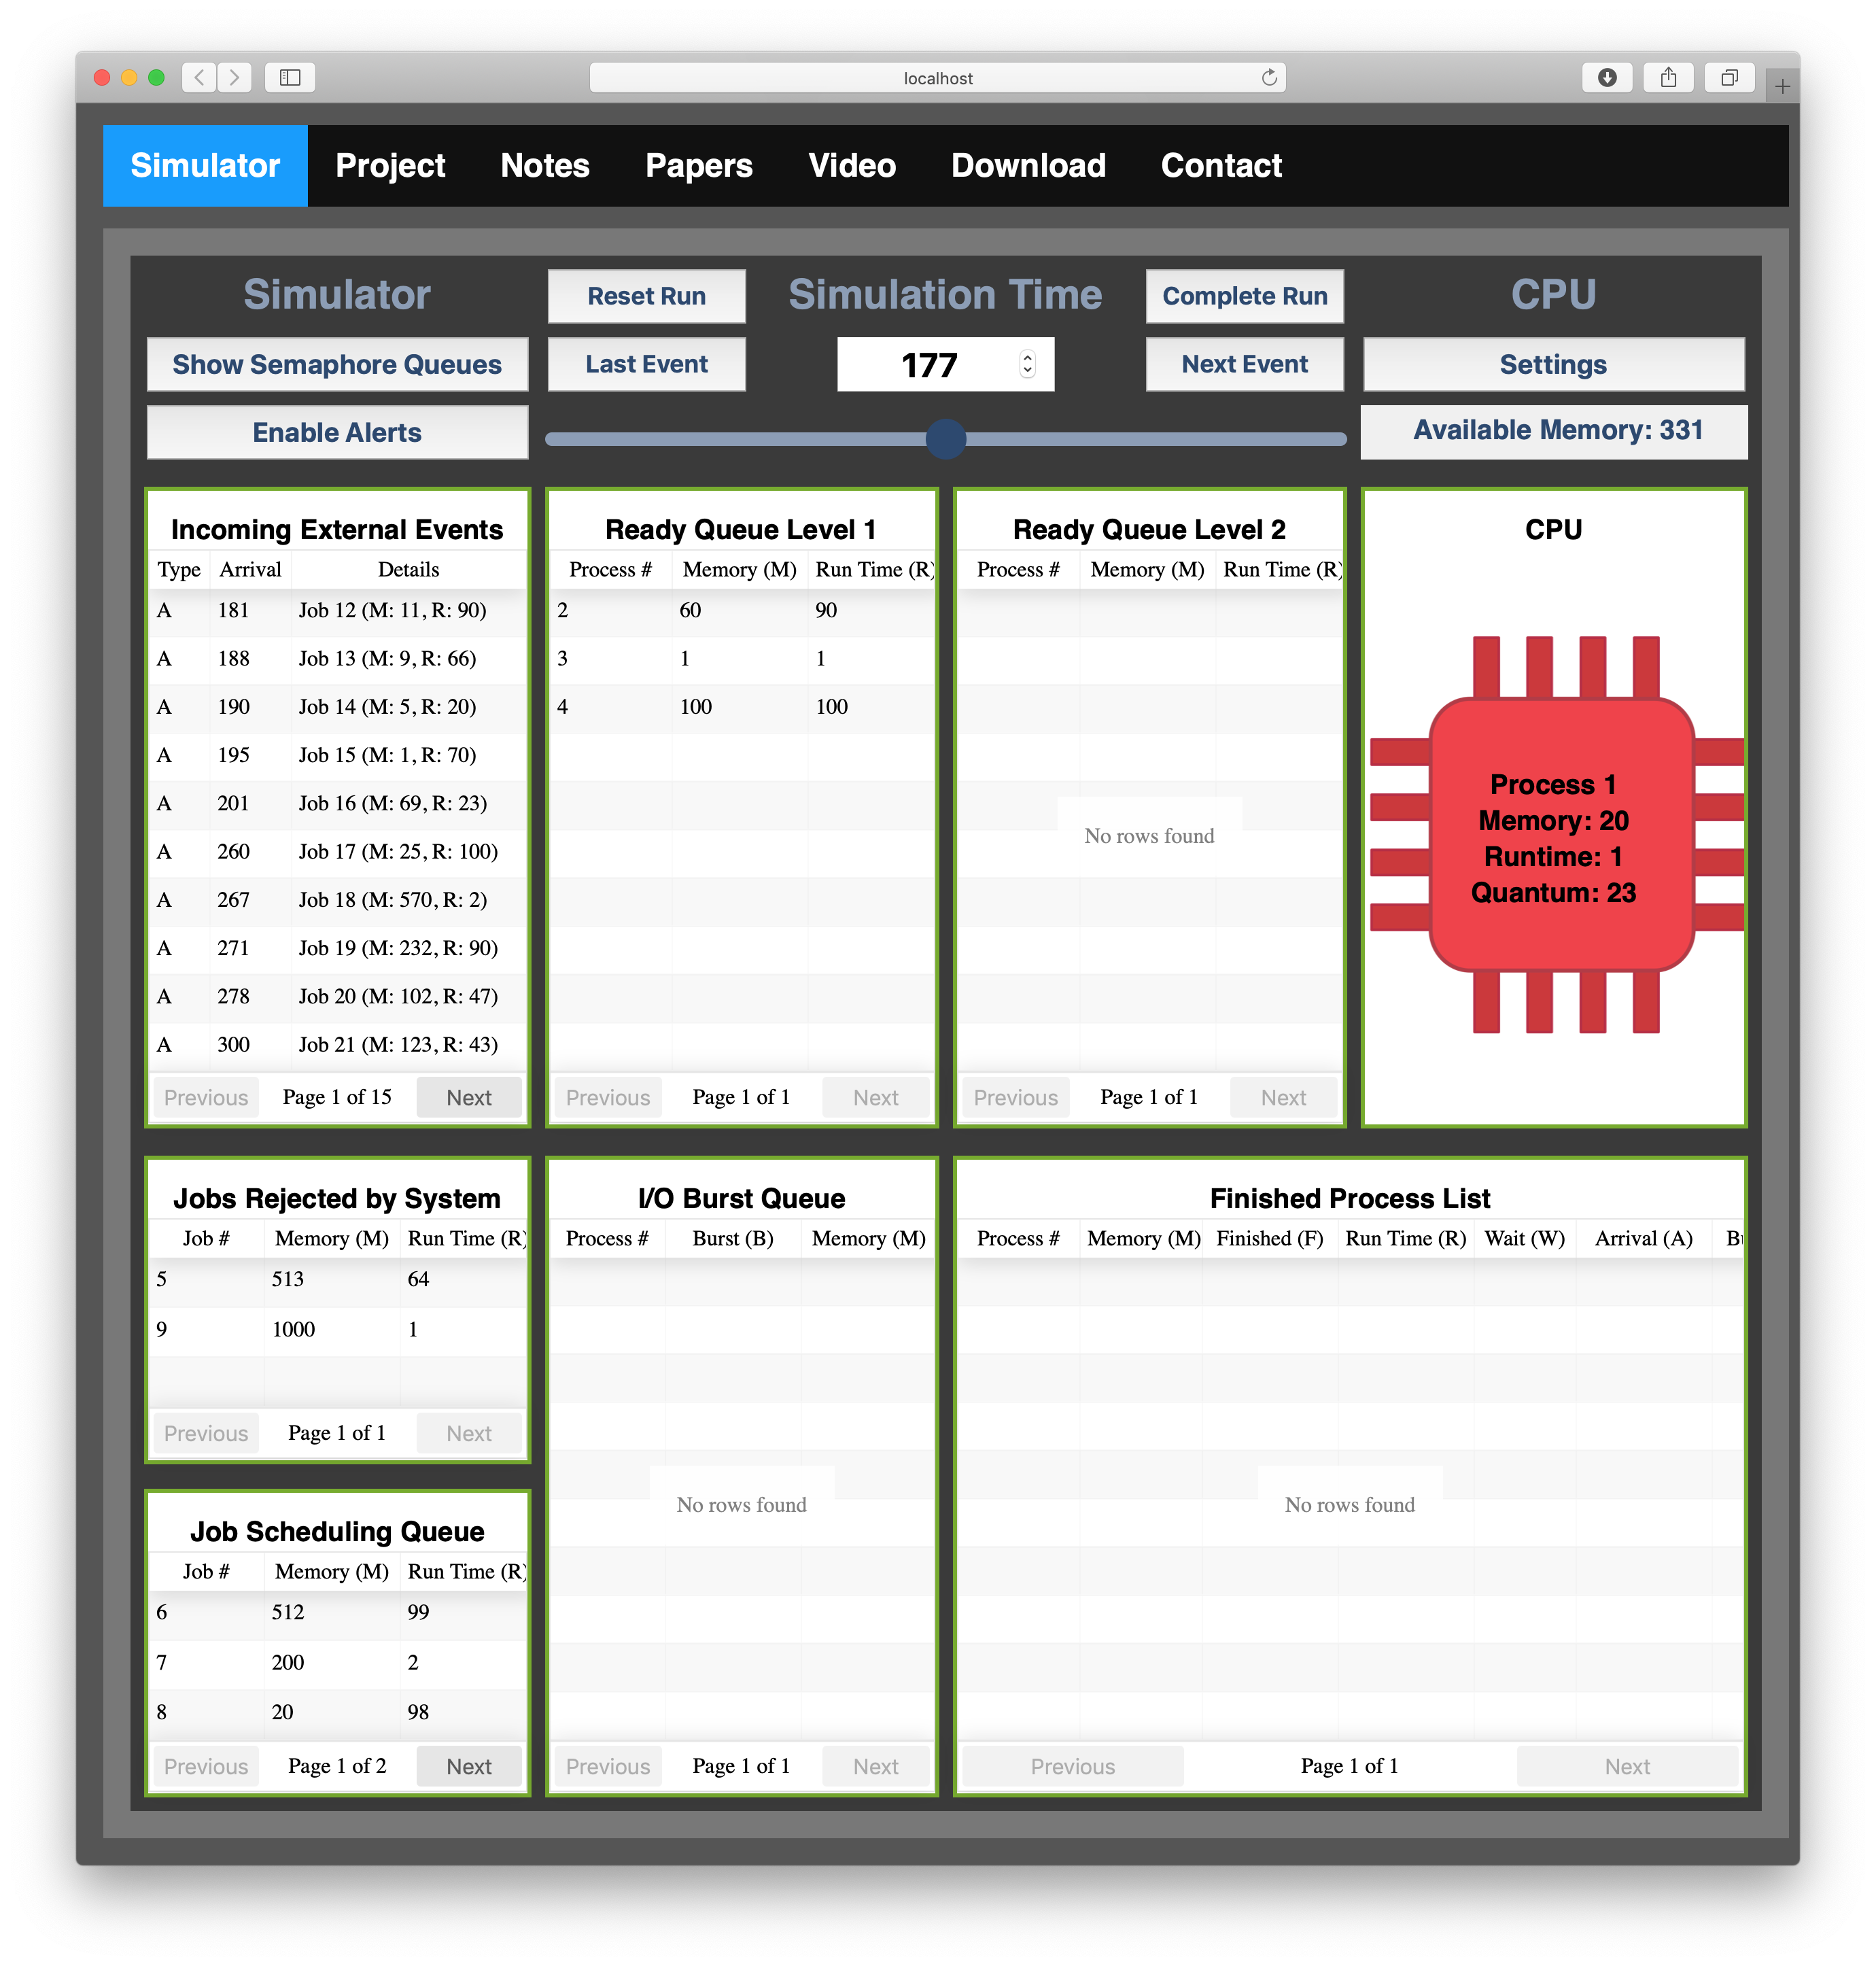
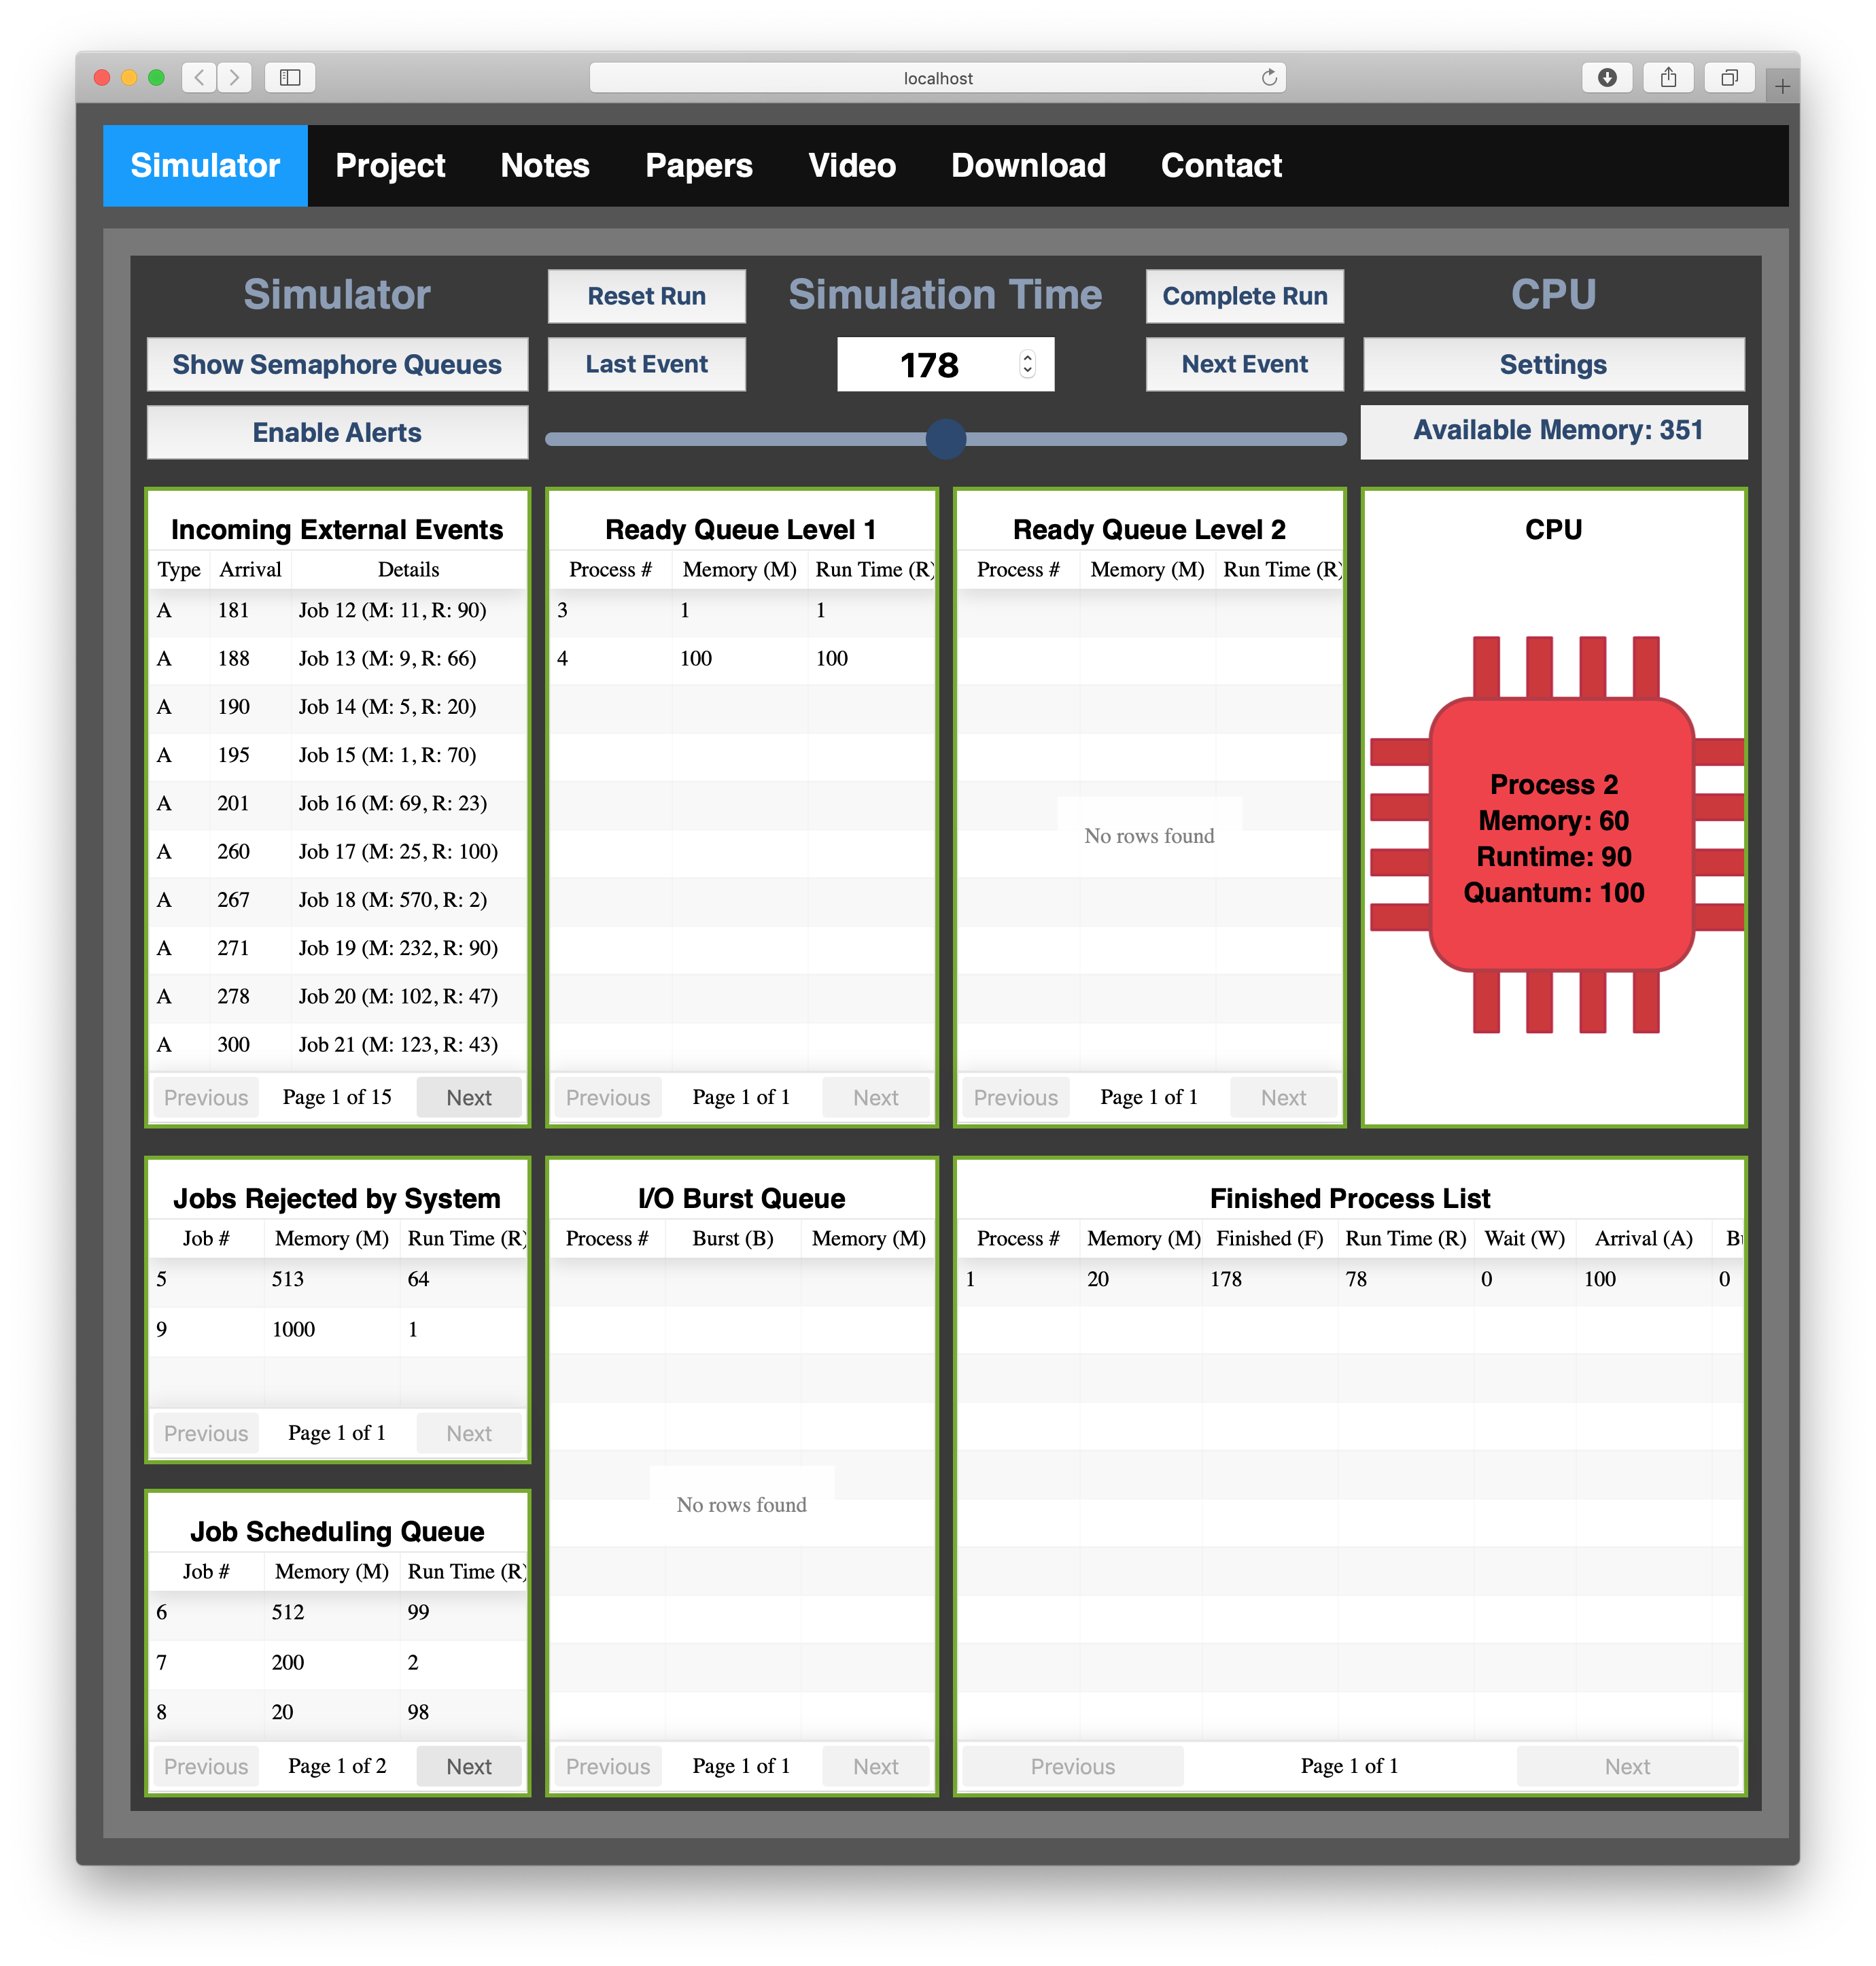
In Figure 11, the simulation time is now 177 and process 1 requires only 1 unit of time before its completion. Figure 12 shows the result of running the simulation for 1 more unit of time after the button ‘Next Event’ is clicked. Note that process 1 has moved to the finished process list, and process 2 has been loaded onto the cpu and requires 90 units of time to complete.
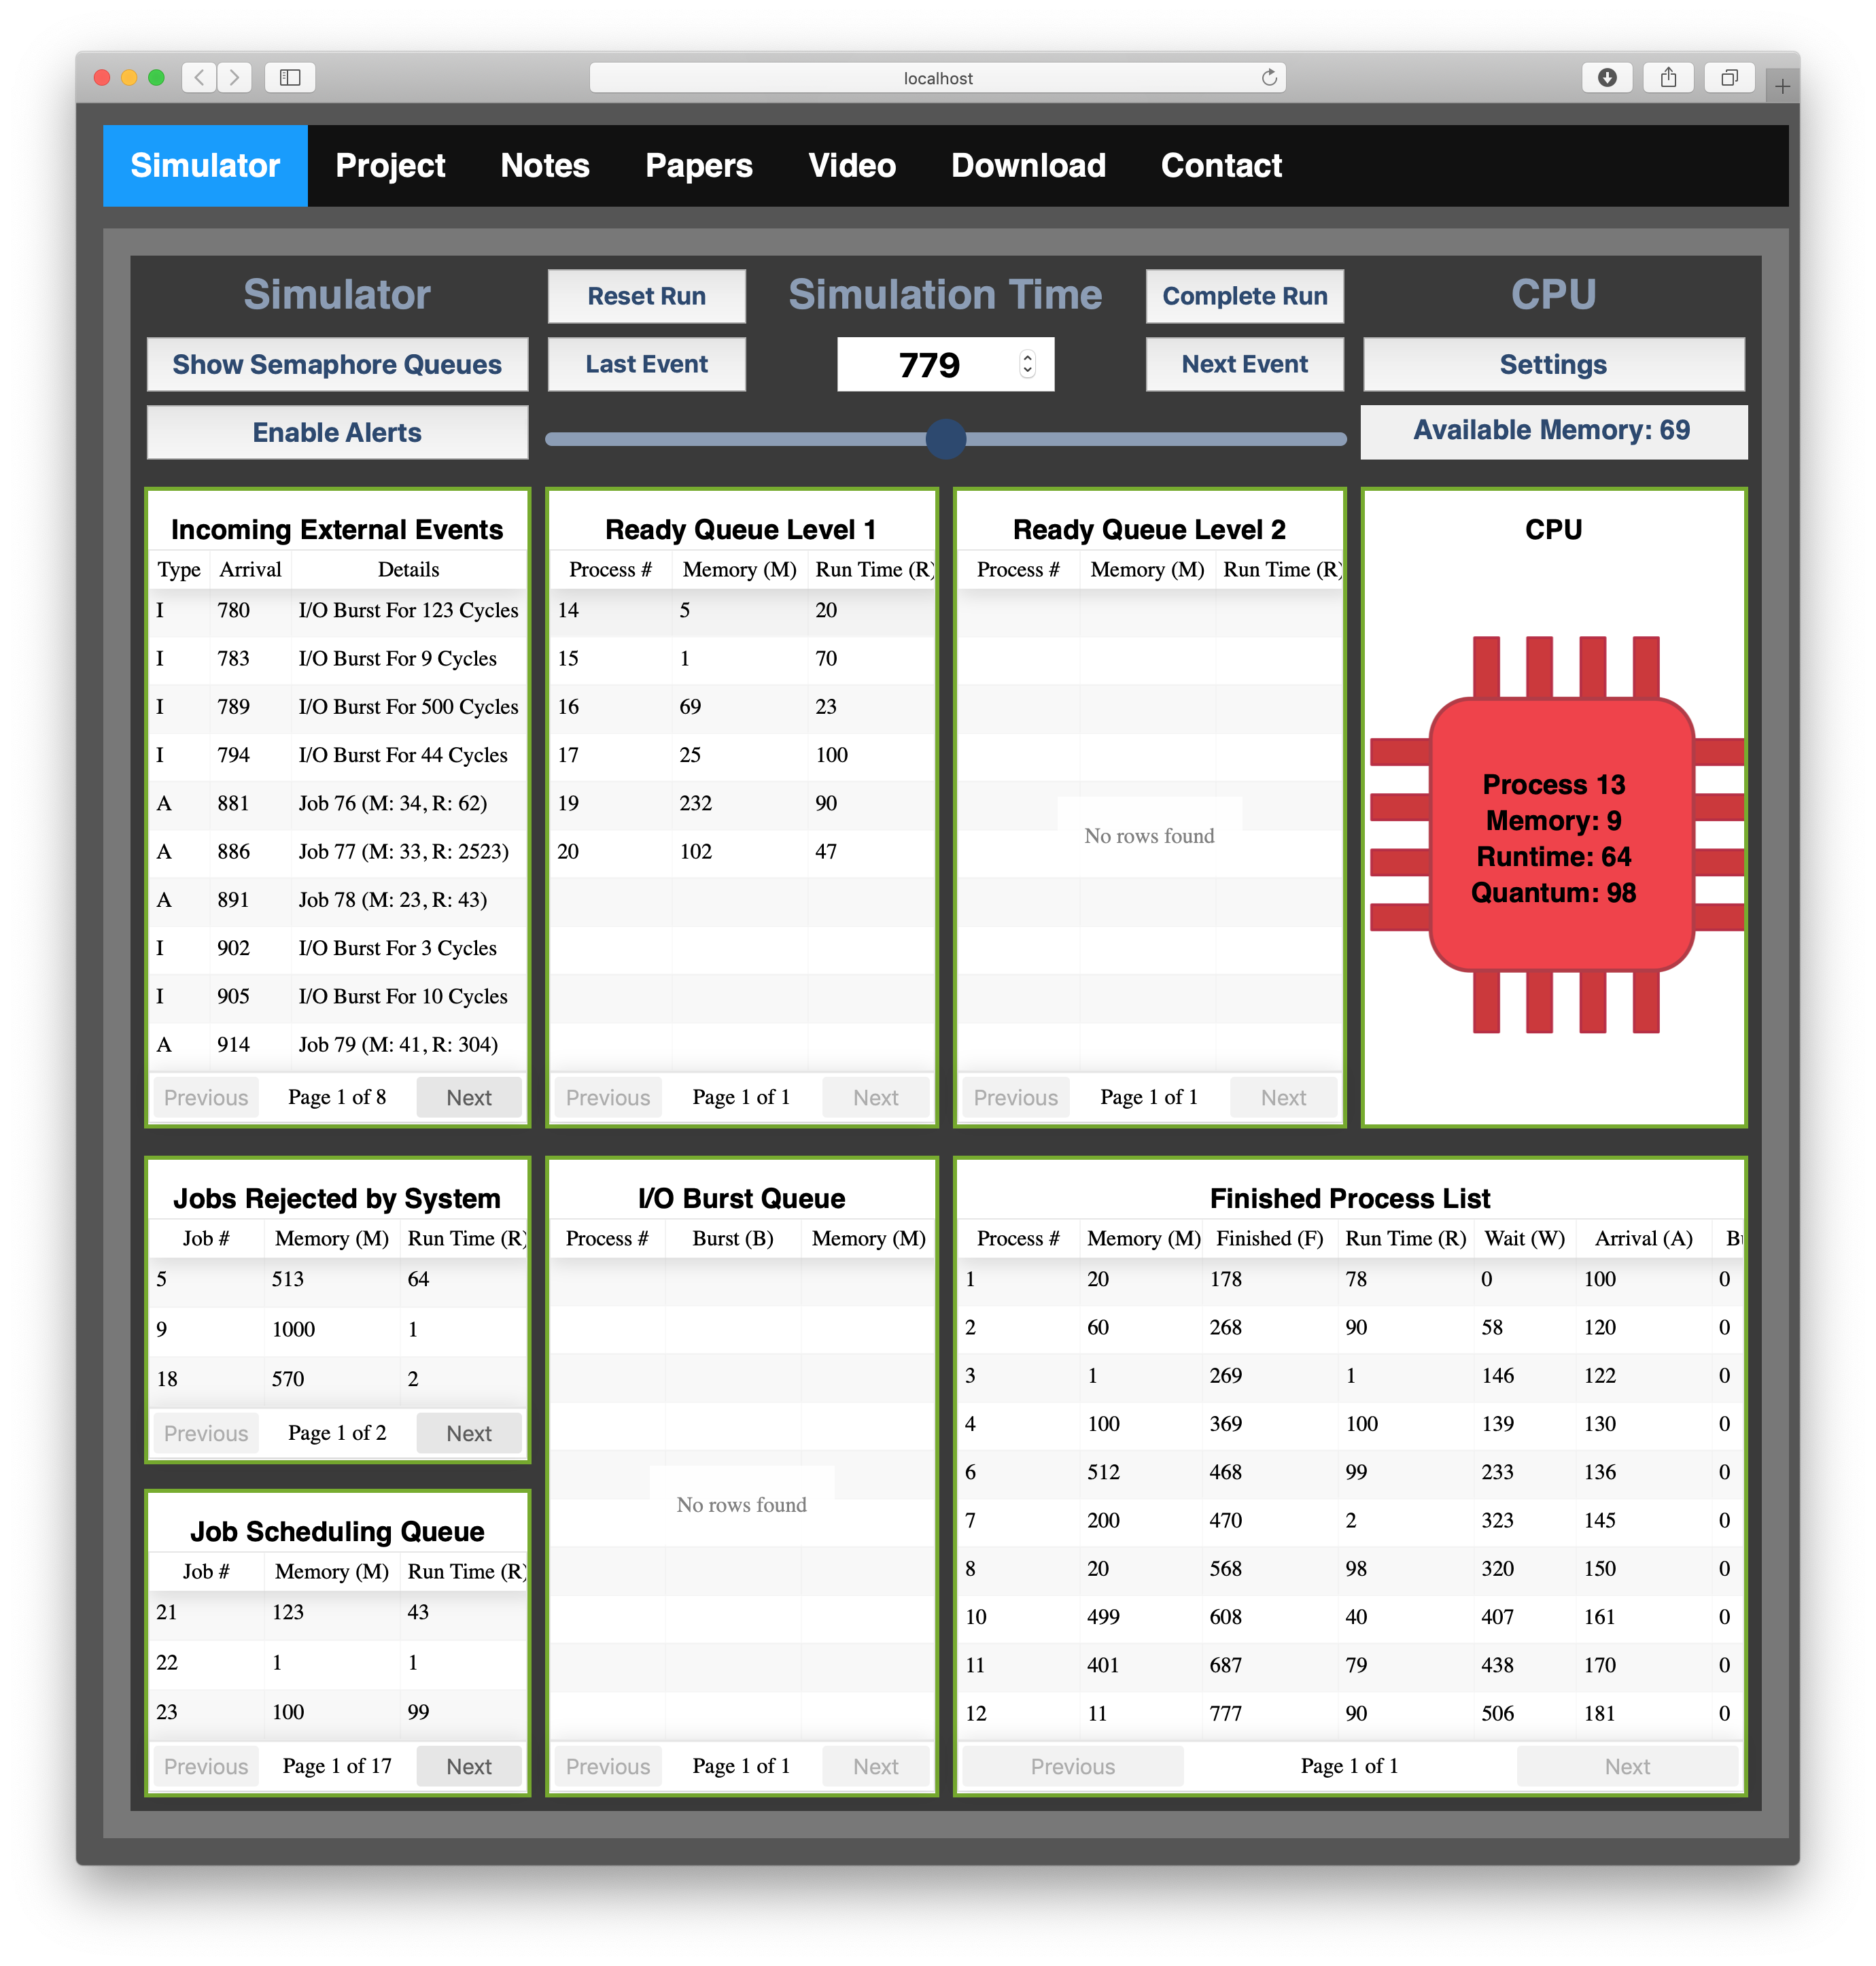
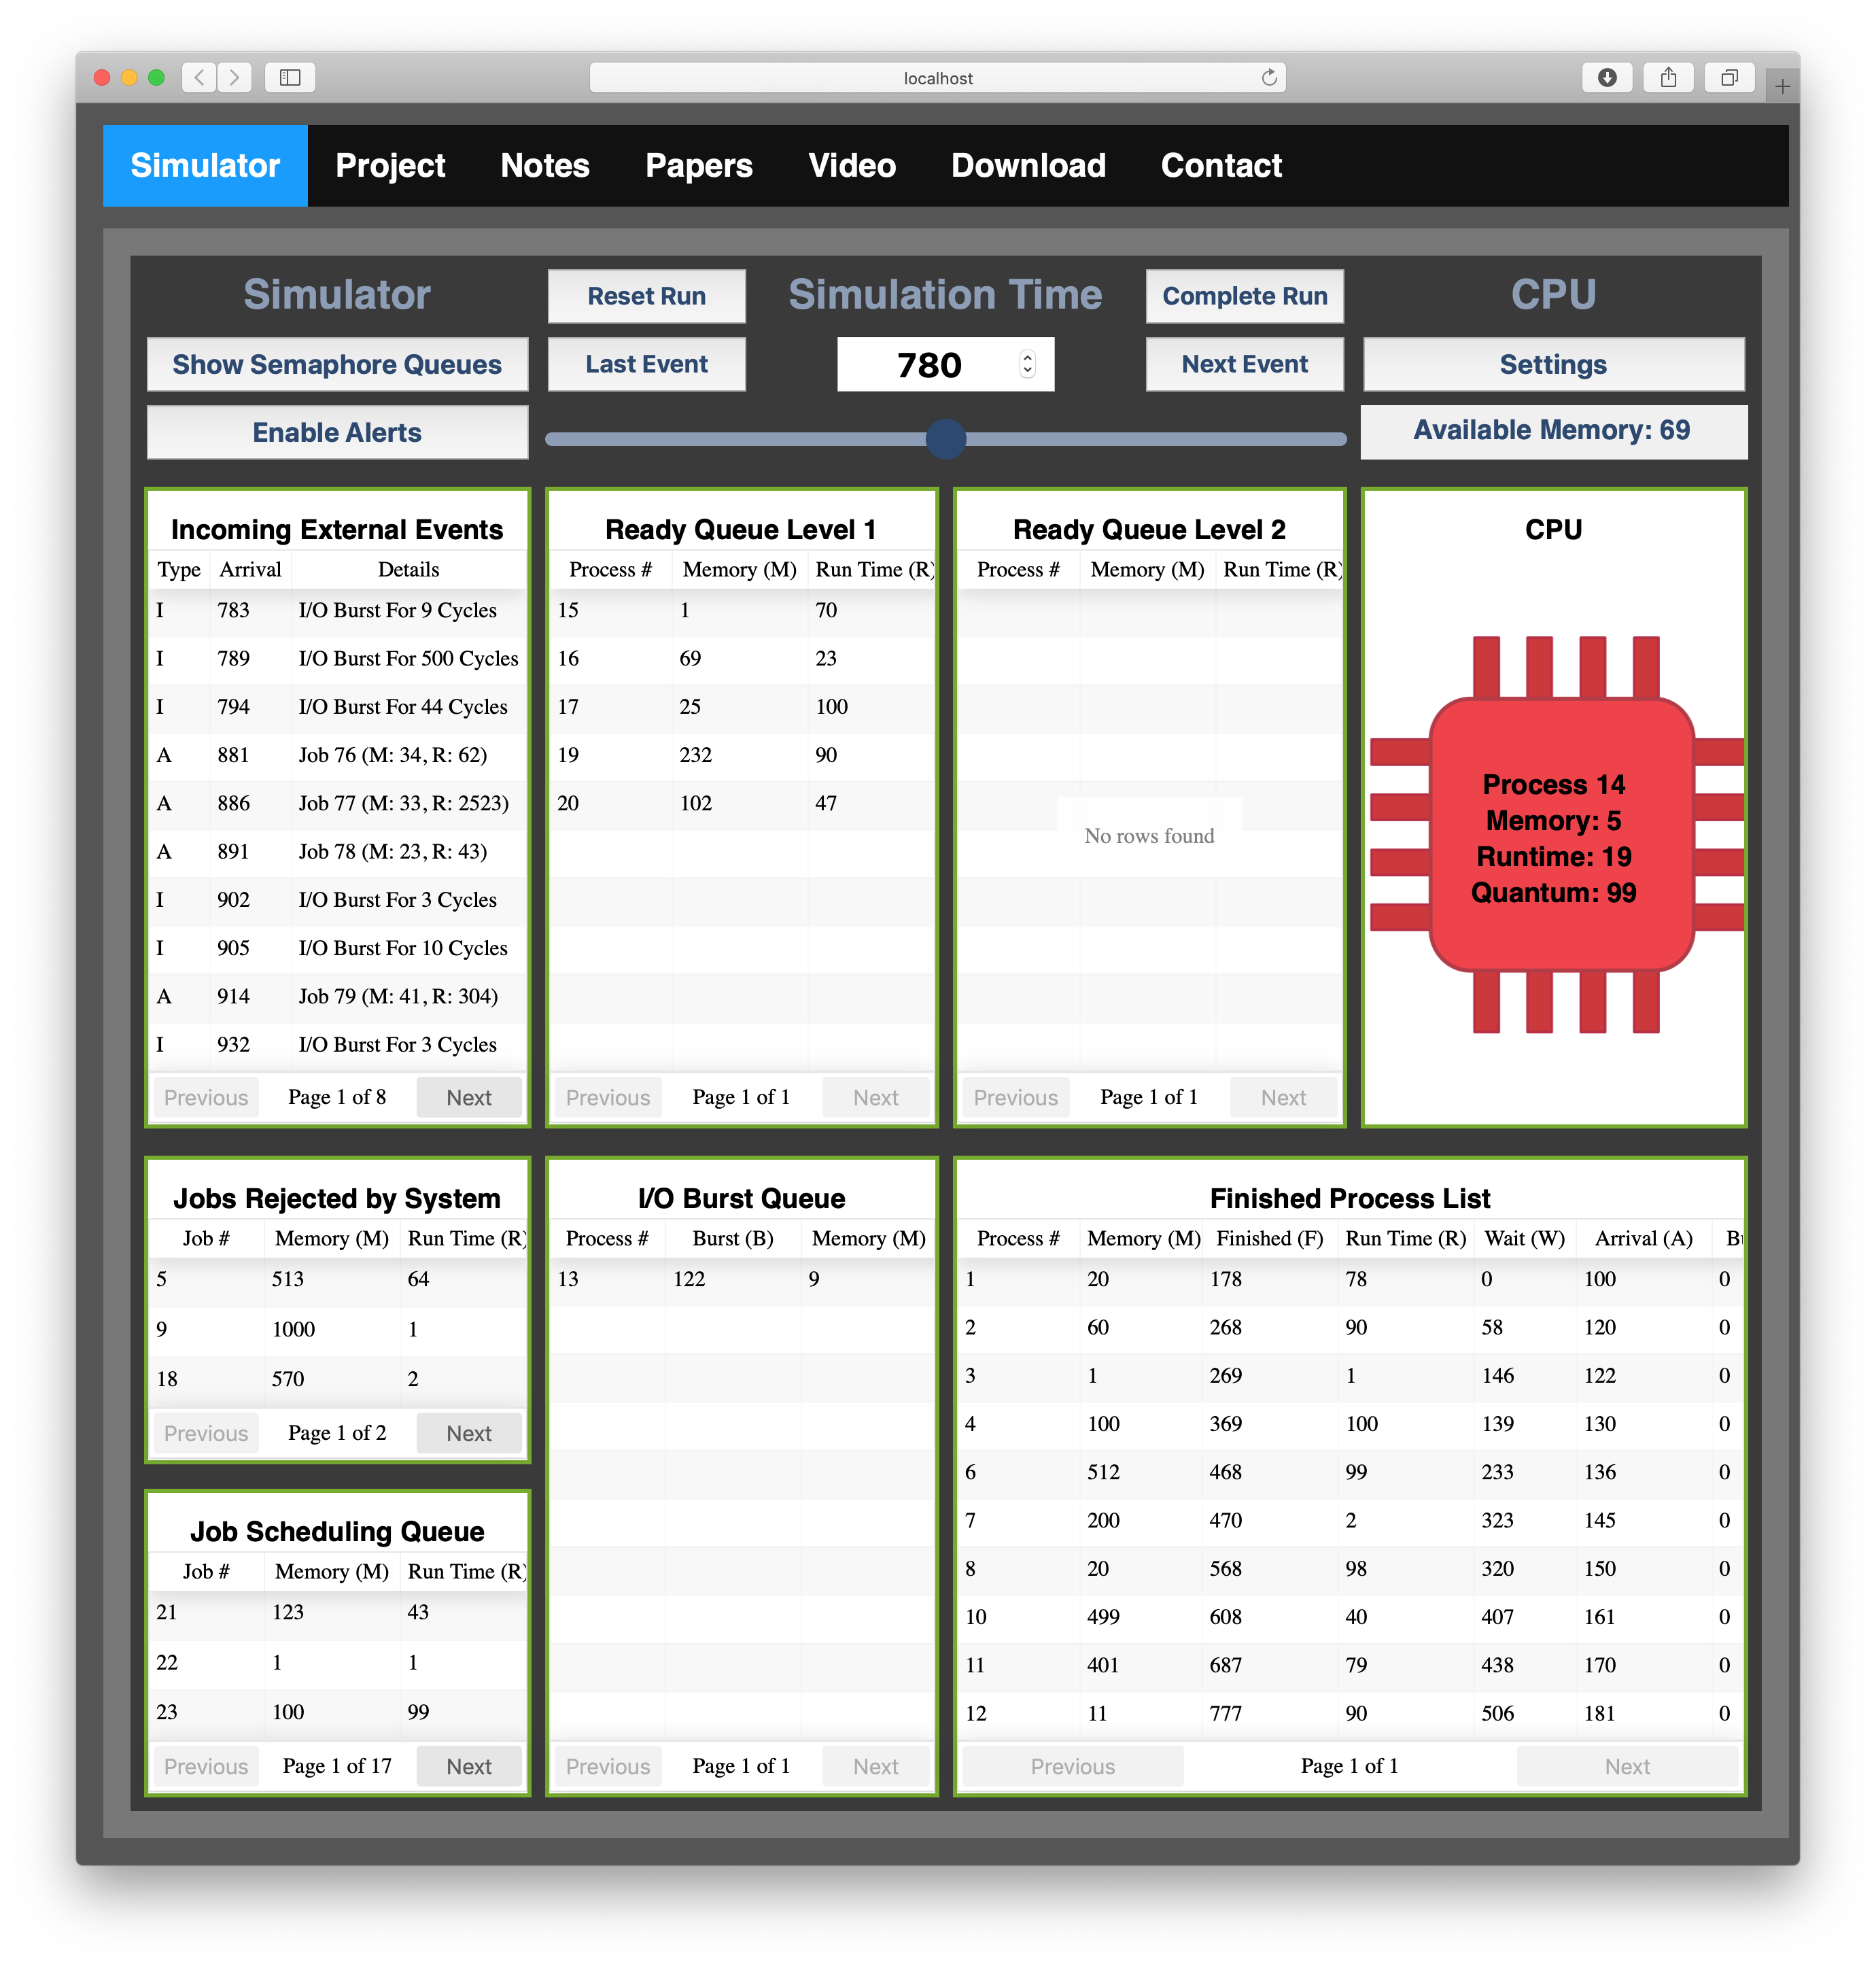
Moving forward to time 779, shown in Figure 13, we see that several processes have finished, several are in the first level of the ready queue, and many jobs are waiting in the job scheduling queue. In the incoming external events list, we see that the next event, identified with the symbol ‘i,’ occurs at time 780 and is a request for i/o by the process on the cpu—in this case, process 13. At time 780, shown in Figure 14, process 13 leaves the cpu and is moved to the i/o wait queue for the specified i/o burst. Once the i/o burst is complete, the process is moved back to the first level of the ready queue. Many other additional i/o events occur over the next few time steps.
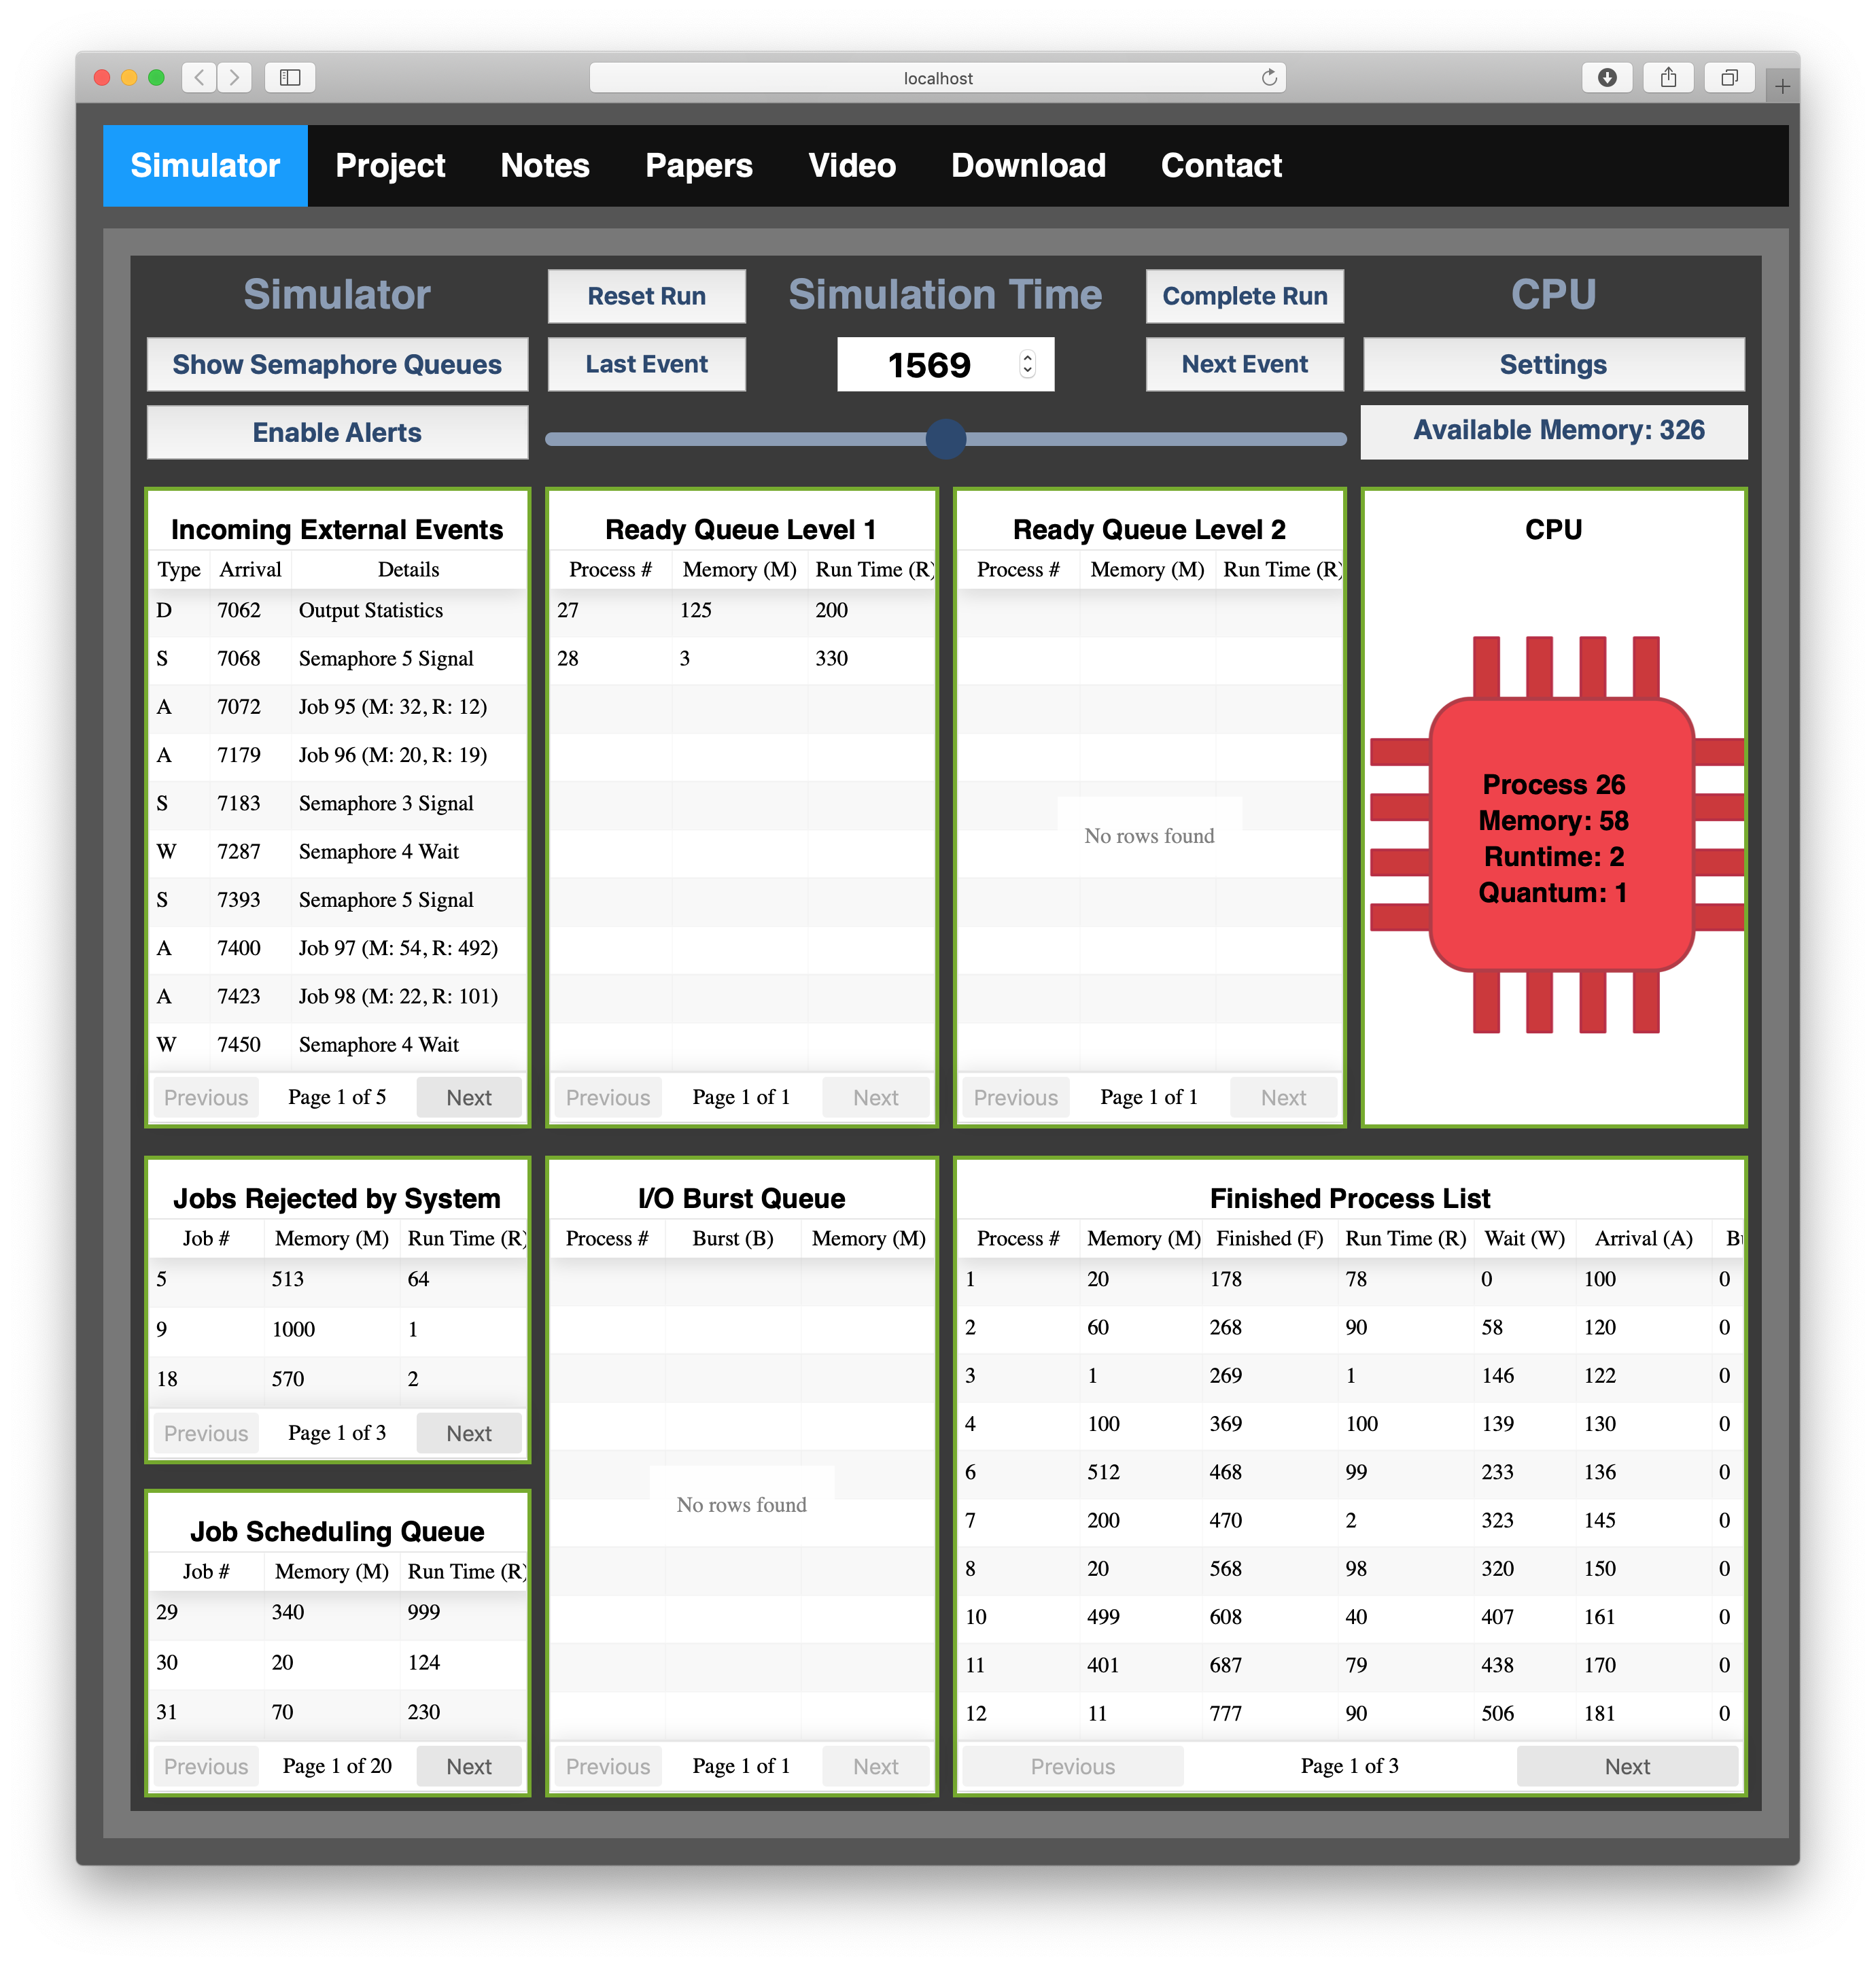
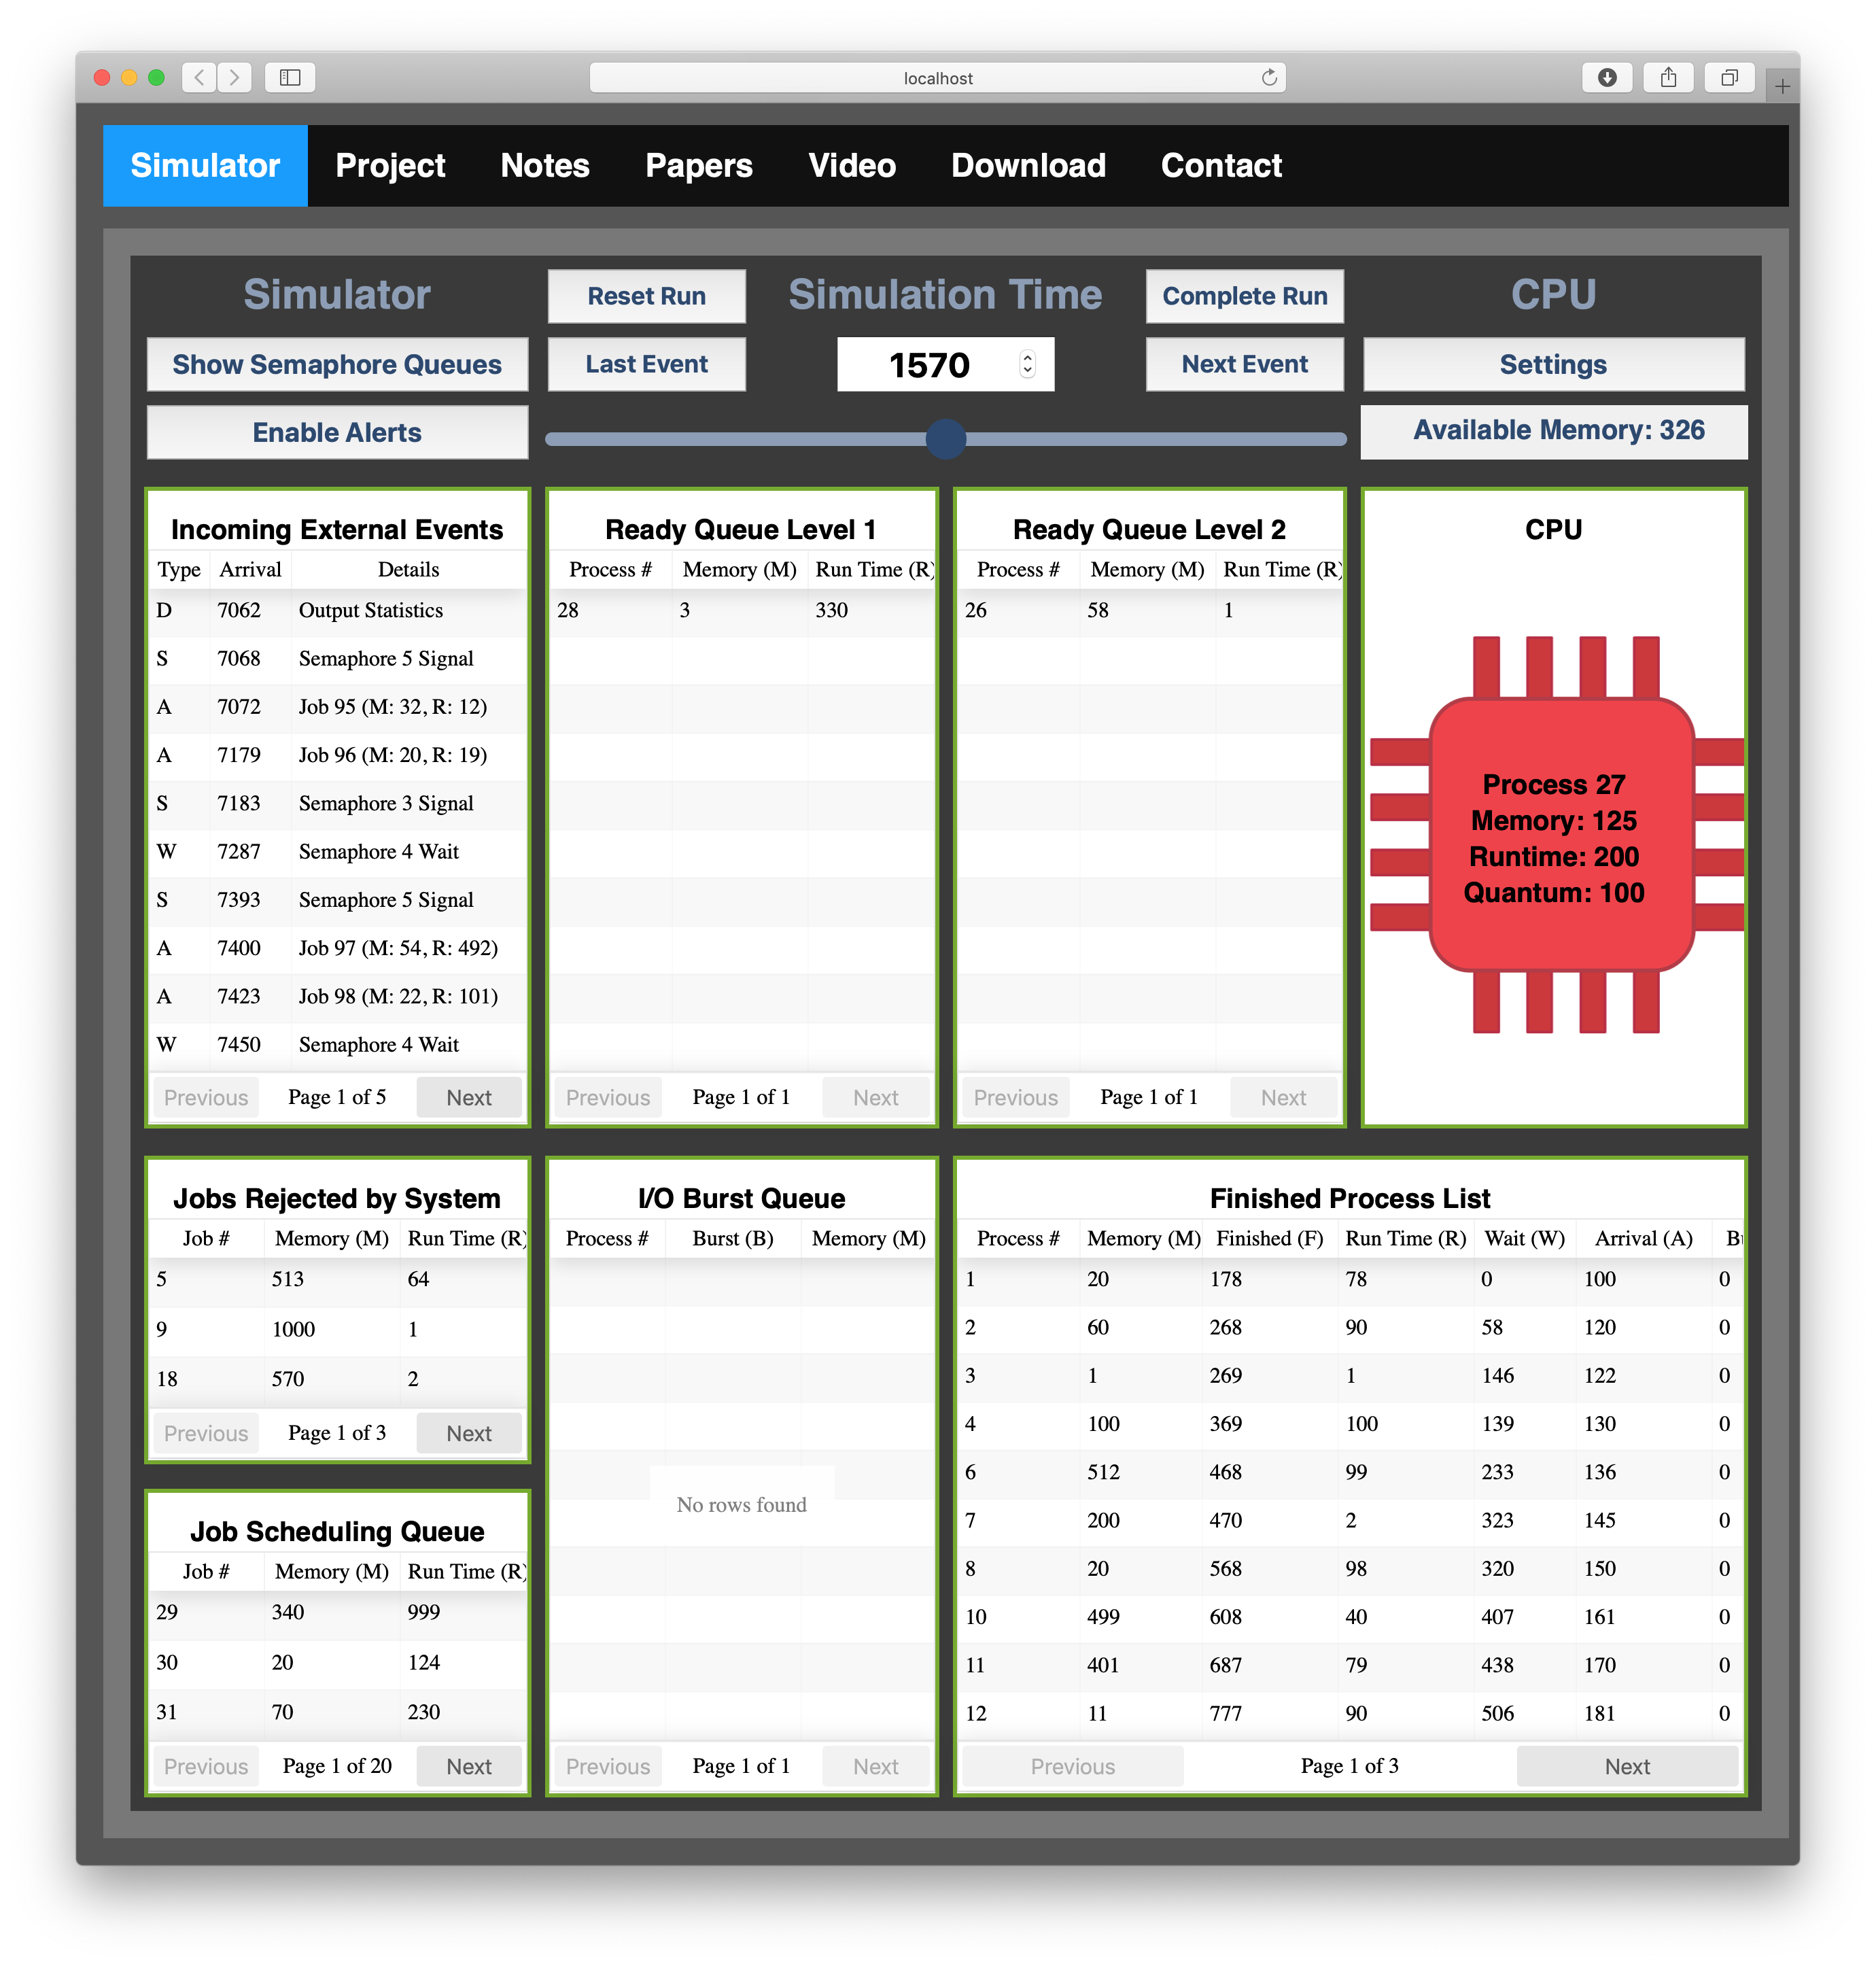
Up to this point, the allotted quantum of 100 units has been sufficient for each process to finish before a quantum expiration. Thus, the second level ready queue is yet used. At time 1,569, shown in Figure 15, process 26 requires 2 units of time before completion, but its remaining quantum is only 1 unit of time. In Figure 16, process 26 is moved to the second level of the ready queue at time 1,570, and will not get back on the cpu again until the first level of the queue is empty since processes on the first level of the ready queue have priority over processes on the second level of the queue. While process 26 requires only 1 more unit of time to complete, it must now wait (potentially indefinitely leading to starvation due to the priority policy between the levels of the ready queue) for more time on the cpu. Students often raise questions about the efficiency of such a scheduling scheme. We use this opportunity to discuss the tradeoffs of scheduling algorithms and address potential solutions to starvation such as aging.
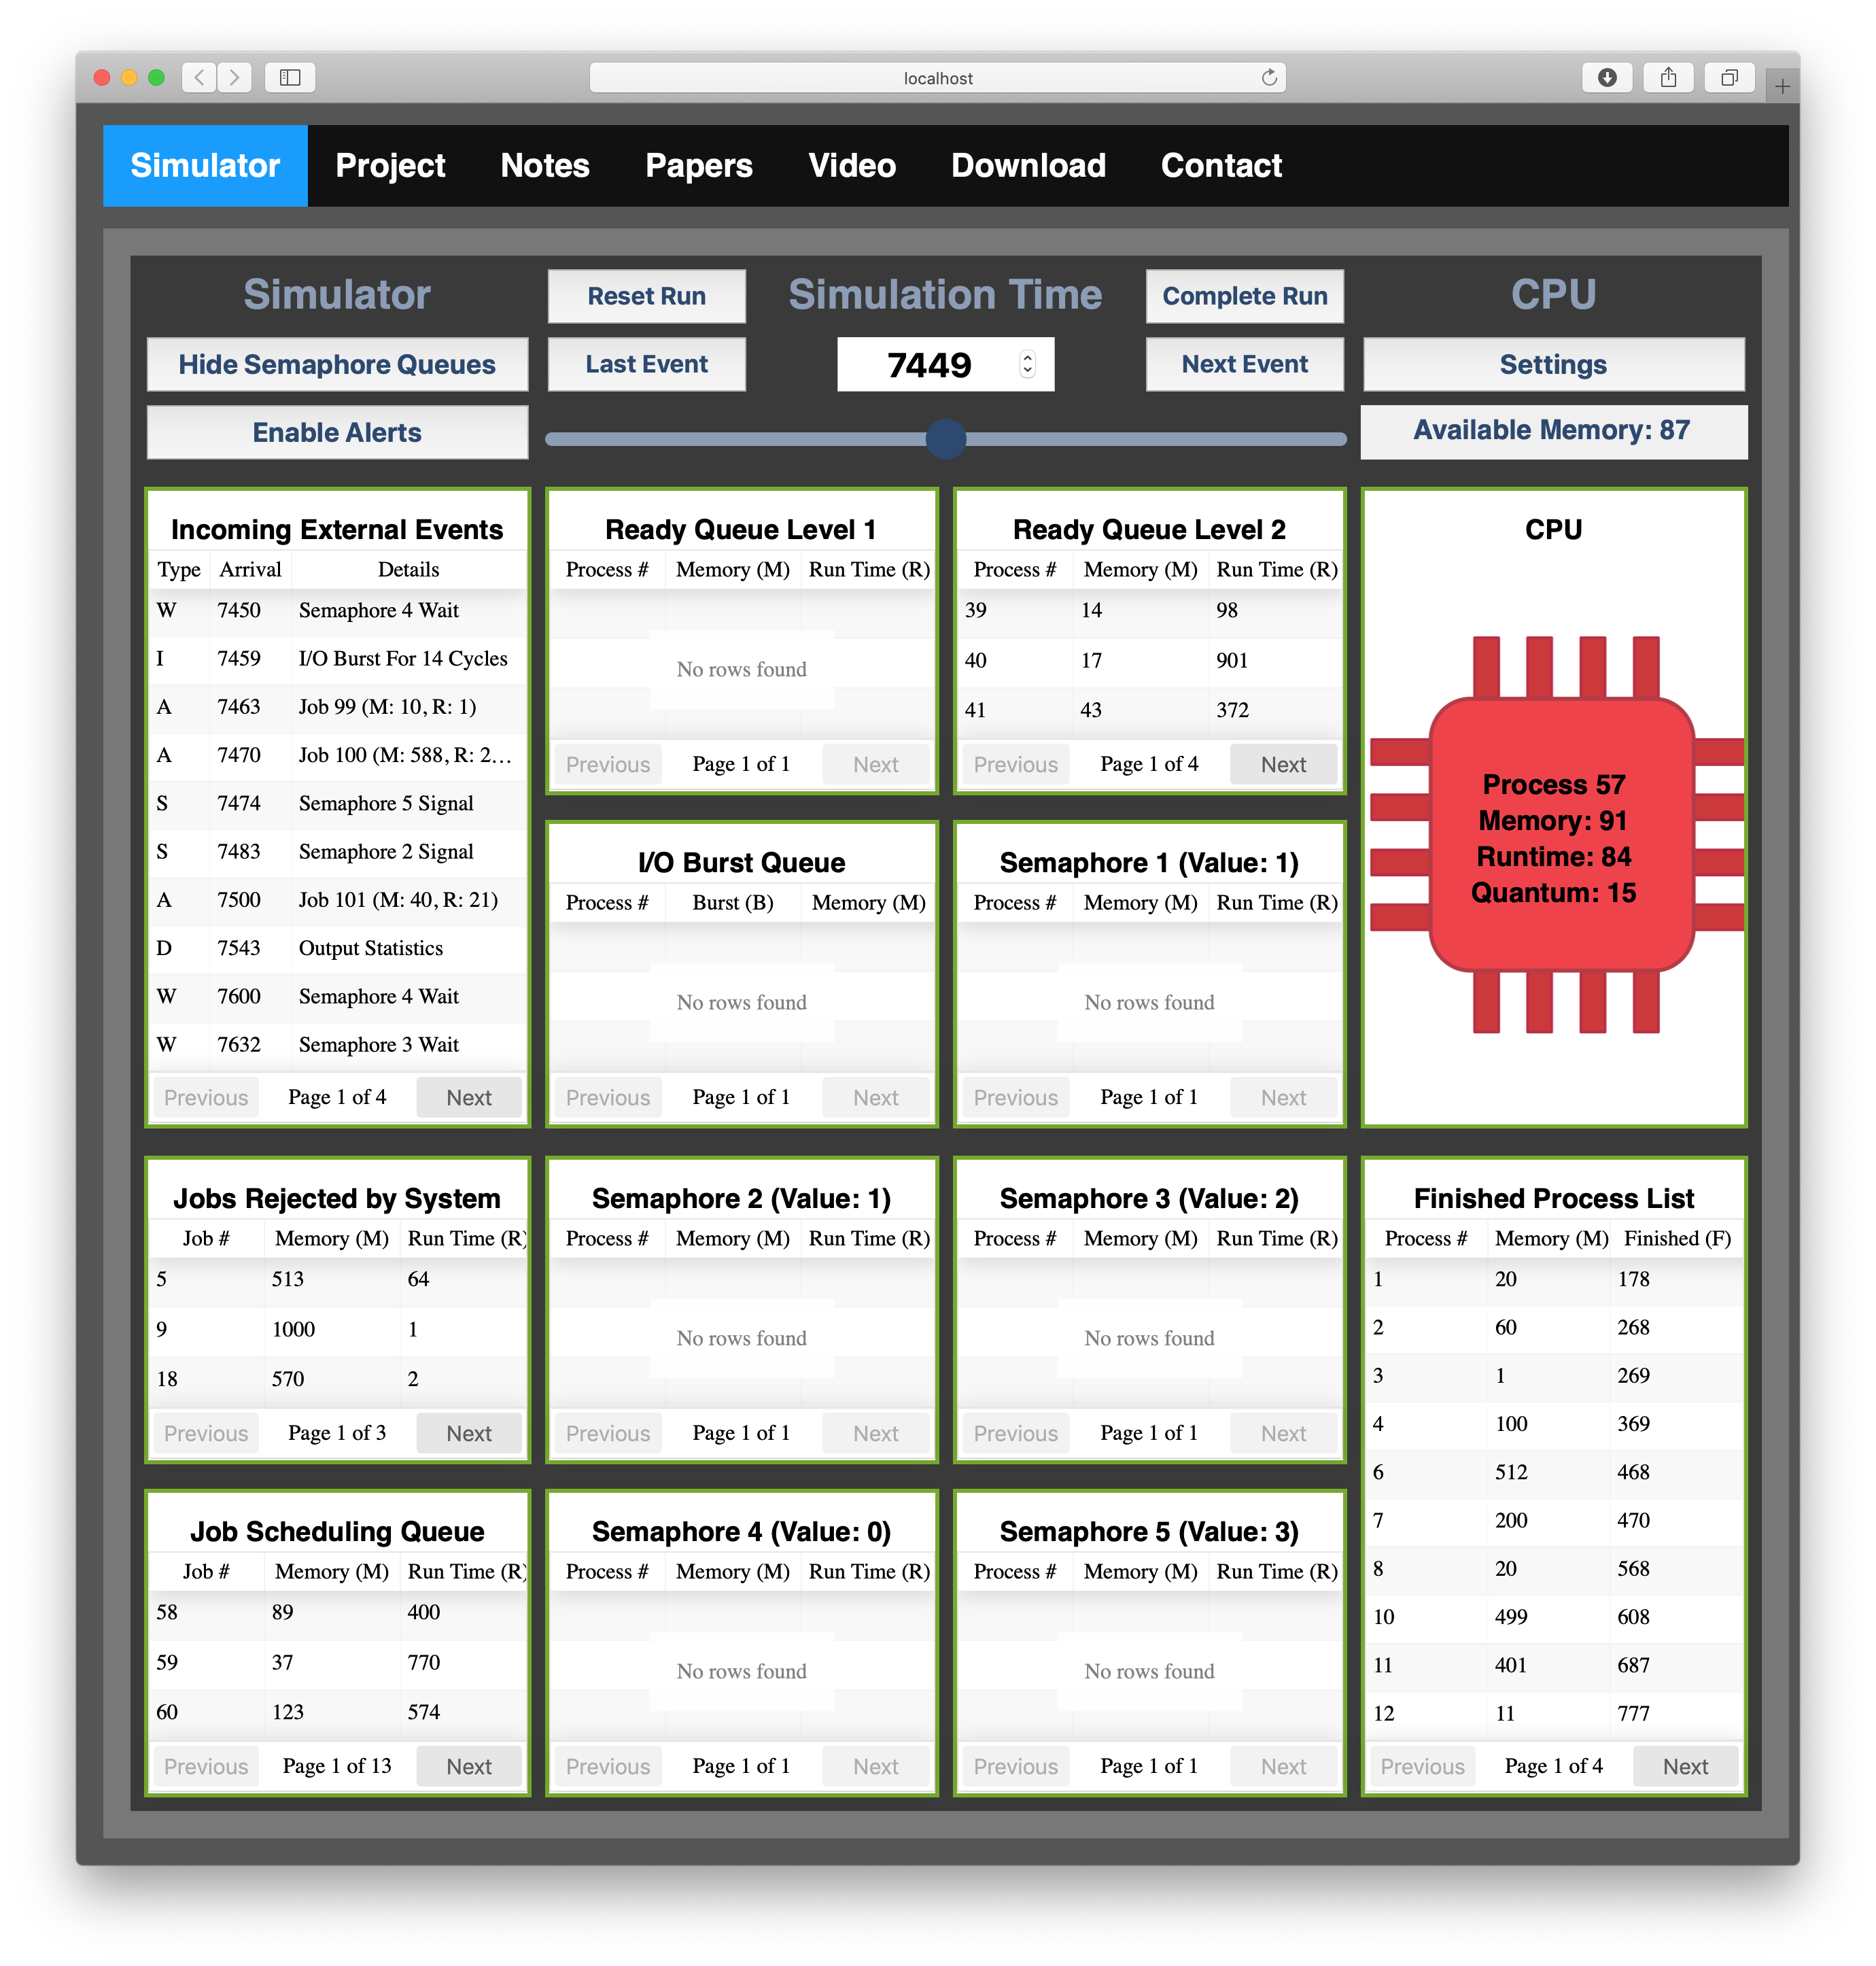
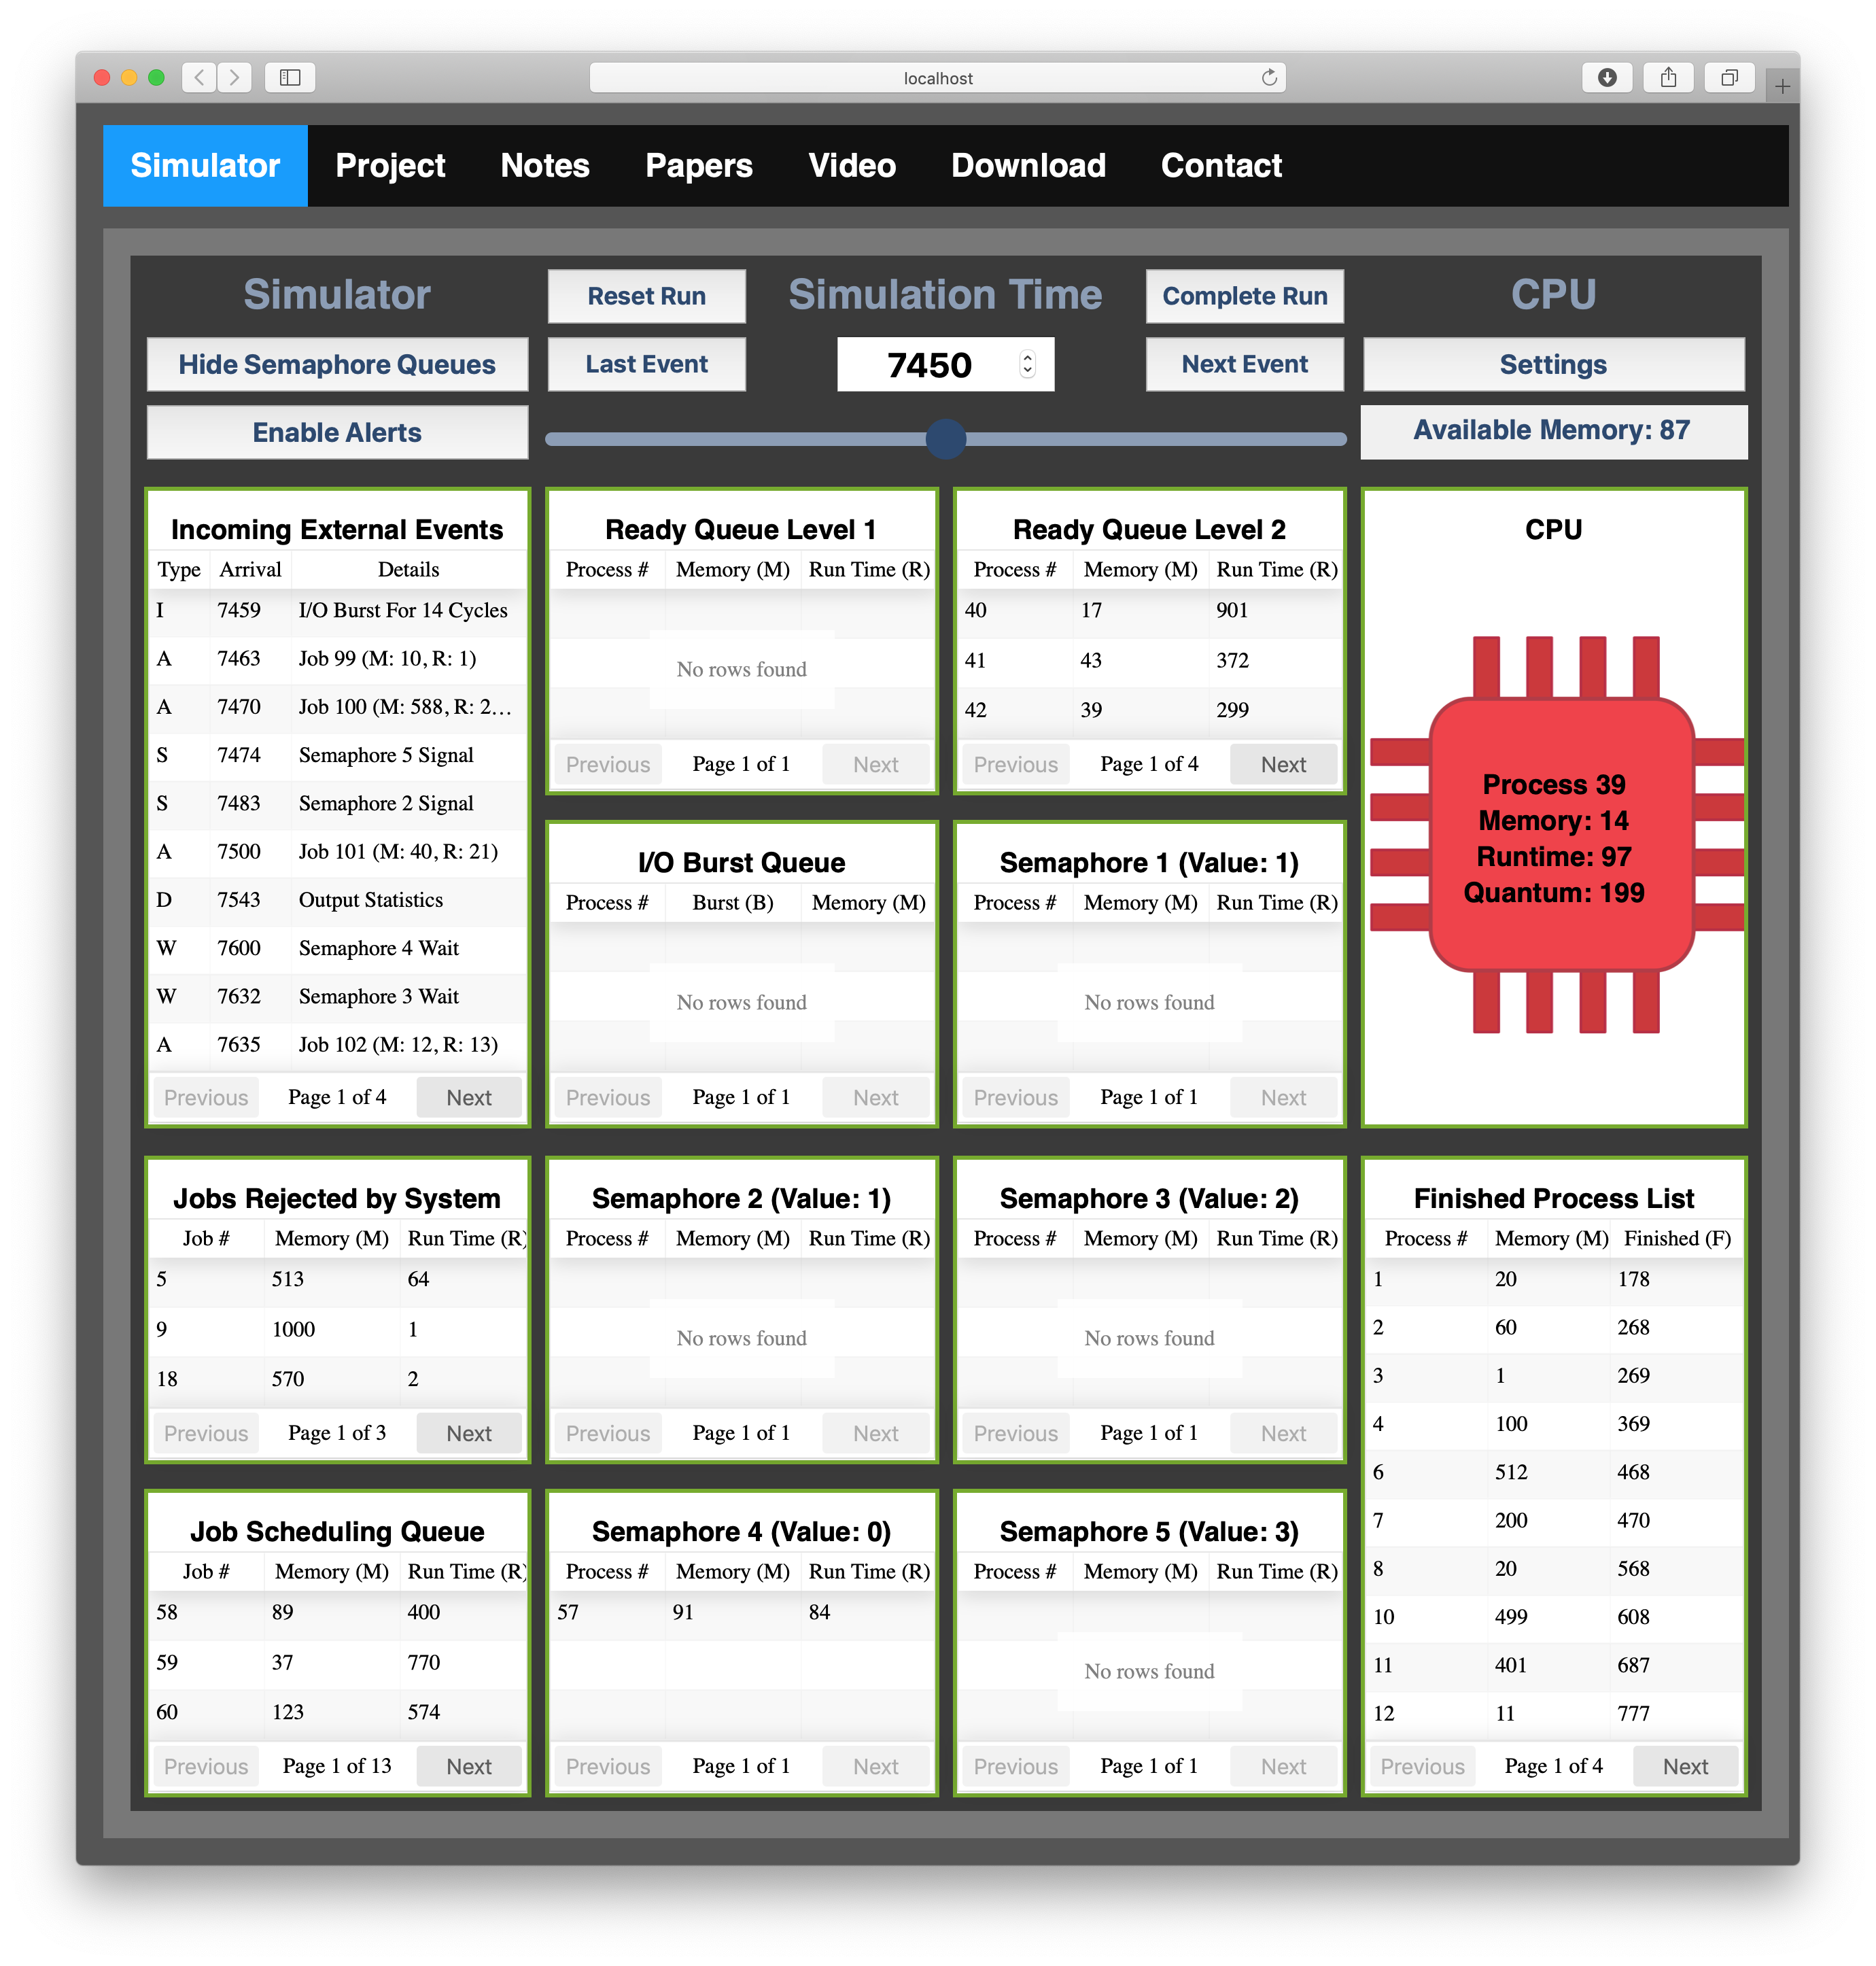
We now demonstrate the use of the system semaphores. We can toggle the button labeled ‘Show Semaphore Queues’ to restore the semaphore queues to the display. The first semaphore event is a signal which is identified by the ‘s’ symbol in the incoming external events list. This signal occurs at time 7,068 and signals semaphore 5 (see Figure 16). The availability of a semaphore is tracked next to the semaphore labels in the semaphore wait queues (see Figure 17). When a semaphore wait event, identified with a ‘w’ symbol, occurs, it causes the process on the cpu to acquire or wait on the identified semaphore. If that semaphore is available, its value is decremented, the process acquires the semaphore, and, thus, remains on the cpu. If is that semaphore is unavailable (i.e., has a value of 0), the process on the cpu must block and, thus, is moved to the particular semaphore wait queue until the semaphore is available (through a subsequent signal). At time 7,449, shown in Figure 17, the simulation is 1 unit of time away from an incoming external event requiring process 57 on the cpu to acquire semaphore 4. Since the value of semaphore 4 is 0, process 57 blocks, leaves the cpu, and must wait in the wait queue for semaphore 4 at time 7,450 (see Figure 18). For additional sample simulation scenarios, see a YouTube video of a text-based demonstration of the underlying simulation engine available at https://youtu.be/eRU8h-5aMOs.
3 A Related Tool
A similar, albeit non-graphical, cpu scheduling simulator is available at http://classque.cs.utsa.edu/classes/cs3733s2015/notes/ps/index.html as a Java applet: appletviewer http://classque.cs.utsa.edu/classes/cs3733/scheduling2/index.html. This tool allows the user to explore a variety of cpu scheduling algorithms (e.g., fcfs, sjf, psjf, and rr). The user chooses an algorithm, sets a quantum, and inputs an arrival time, cpu burst time, and i/o burst time for each process in a set of user-defined processes. The tool then produces a text-based Gantt chart. When a change is made to any of these inputs, the Gantt chart is updated. There are some key differences between this tool and our tool with implications on student learning. While our tool, like this tool, does permit the user to dynamically tune the quantum, unlike this tool, our tool does not permit the user to select the scheduling algorithm—the round-robin (rr) scheduling algorithm is fixed in our tool. However, and more importantly, unlike this tool, our tool i) simulates and displays the variety of queues involved in cpu scheduling and i/o and semaphore processing, ii) supports the user in stepping through the simulation at user-defined increments of time, and iii) allows the user to dynamically tune more simulation parameters than just quantum. In short, unlike our tool, this related tool does not capture the transitions from one unit of time to the next. (It also has an upper bound on how many processes can be simulated before the textual Gantt chart becomes unreadable. Also, the Java web applet is not secure and is blocked by most modern web browsers by default.)
Our tool allows users to interactively step through the simulation by any increment of time and observe both the state and location of all processes. Rather than displaying only the state of processes, our tool also illustrates the queues in which each process resides throughout its lifecycle. For example, in our tool, users can monitor a process as it is loaded into memory, inserting into the ready queue, granted access to the cpu, preempted to a semaphore or i/o wait queue, time sliced and moved to the second-level ready queue, and eventually completed and flushed out of the system onto the list of finished processes. Moreover, our tool supports the dynamic tuning of many of the simulation parameters. For instance, users can inject or edit incoming events at any time (e.g., altering the semaphore signals at any increment of time along the simulation timeline). The ability to step backwards also allows users a convenient way to explore multiple scenarios from a given point in time. This level of interaction supported by our tool provides ample scope for students to explore cpu scheduling in a variety of user-created scenarios. Lastly, unlike this tool, our tool also involves memory usage and multi-level feedback queues.
4 Student Feedback and Discussion
4.1 Student Comments
Students across a wide range of offerings of the os course have found the project to develop the underlying simulation engine helpful for discerning and acquiring an appreciation of the difficulty in the copious event processing an os must handle. It also gives them a feel for the operations management nature of an os. The following is a sample of anonymous student feedback from a course evaluation.
The project really nailed in the main concepts of operating systems in general.
The project was also an interactive and engaging experience that demonstrated and explained concepts we were working on in class.
I found that the project really helped me learn how an operating system scheduler worked.
Also I found the project to be really fun, I actually enjoyed working on it.
…mostly the project that we did halfway through the semester was very beneficial to my learning looking back at it.
Another use of our tool is as an aid to students working on conceptual, pencil-and-paper process scheduling exercises (such as those in [2][Chapter 5]), particularly for verifying the correctness of their work. In addition to its use for exploring the demonstrated concepts, we have discovered an unintended use of this graphical tool—students can use it as a tool to debug their underlying simulation engine. Observing the operation of their underlying simulation graphically helps students identify bugs in their implementation more quickly than wading through pages of textual dumps of their system queues, e.g., to identify a process that went awry.
Approximately three hundred and twenty students have completed the underlying simulation engine project since the Fall 2009 semester. Students are permitted to use any programming language of their choice for implementation. Students have primarily used Java (210) and C++ (95)—the languages used in our introductory sequence.333We switched from C++ to Java in Fall 2014, but C++ was phased out progressively over the span of a few semesters in the three-course sequence. Students have also used Python (12), C♯ (2), and Perl (1). Two students re-implemented their projects—one in Scheme and one in Elixir. (The Elixir program was multi-threaded—see below.)
There are multiple extensions to the underlying simulation engine that can be assigned to students as follow-on projects. For instance, students can implement a memory management scheme (e.g., paging) to the organization of the ready queues and/or simulate a multi-core processor. Also, note that the underlying simulation engine is a single-threaded program, albeit one that simulates multiple concurrent processes. Once students implement the single-threaded implementation, a possible segue into the topics of concurrency and synchronization is to re-design/implement the simulator in a multi-threaded fashion using an event-based concurrency model such as the Actor model of concurrency in, e.g., Elixir. One student did this for extra credit.
4.2 Download and Install Locally
The entire simulation tool can be downloaded and run locally. The tool requires Node.js version 10 or 11 and npm version 6 to be installed. A production build of the tool can be downloaded from https://cpudemo.azurewebsites.net/#/download. Complete up-to-date instructions are also available with the download.
4.3 Future Work
We plan multiple enhancements to the graphical overly intended to make the tool more flexible to facilitate its use by other educators. For instance, we plan to compute and display a variety of performance metrics at the completion of the simulation (e.g., average turnaround time and average job scheduling wait time). We would also like to support other scheduling algorithms (e.g., sjf, psjf). We also plan to redesign the event queue so that it is editable enabling an instructor to dynamically alter the simulation scenario. Recall, that multiple canned sequences of incoming external events are currently available that demonstrate many of the aspects of the simulation. Ultimately, we plan to decouple our graphical visualization from the underlying text-based simulator. This will allow an instructor to overlay our visualization on top of any operating system for which the instructor’s students are simulating. This will afford the instructor the freedom to customize the design requirements and parameters of the particular operating system the students are simulating while still being able to make use of the visualization for purposes of any of its pedagogical purposes. Moreover, this decoupling will enable students make use of the graphical overlay as a tool to debug their underlying simulation engine. Observing the operation of their underlying simulation graphically will help students identify bugs in their implementation more quickly than wading through pages of textual dumps of their systems queues (e.g., to identify a process that went awry).
This software simulation/demonstration is part of a NSF-funded project whose goal is to foster innovation, in both content and delivery, in teaching os through the development of a contemporary model for an os course that aims to resolve issues of misalignment between existing os courses and employee professional skills and knowledge requirements.
 |
 |
 |
 |
 |
 |
 |
 |
 |
 |
 |
 |
 |
 |
 |
 |
 |
Acknowledgments
This material is based upon work supported by the National Science Foundation under Grant Numbers 1712406 and 1712404. Any opinions, findings, and conclusions or recommendations expressed in this material are those of the author(s) and do not necessarily reflect the views of the National Science Foundation. The source of the underlying simulation engine is a course project designed by John A. Lewis in which students design and implement a program that simulates some of the job and cpu scheduling, and semaphore processing of a time-shared operating system.
References
- [1] J.W. Buck and S. Perugini. An interactive, graphical simulator for teaching operating systems. In Proceedings of the 50th ACM Technical Symposium on Computer Science Education (SIGCSE), page 1290, New York, NY, 2019. ACM Press. Demonstration; DOI: http://doi.acm.org/10.1145/3287324.3293756.
- [2] A. Silberschatz, P.B. Galvin, and G. Gagne. Operating system concepts. John Wiley and Sons, Inc., Hoboken, NJ, tenth edition, 2018.