Ion-crystal demonstration of structural phase transition induced solely by temperature
Abstract
We demonstrate for the first time a linear-zigzag phase transition induced solely by temperature of the 40Ca+ ion crystals in a surface-electrode trap. In contrast to the previously observed counterparts based on change of the mechanical equilibrium conditions of the ions, our presented structural phase transition occurs due to controllable influence of thermal fluctuation. The ions’ temperature is well controlled by tuning the cooling laser and the experimental observation could be fully understood by classical Langevin equation in addition to the effects from thermal fluctuation. Our experimental investigation indicates the fantastic role of thermal fluctuation played in the thermodynamic process at atomic level, which might bridge the thermodynamics from the macroscopic domain to the quantum regime.
With advances of laser cooling techniques, observing thermodynamic process in few microscopic particles in cryogenic situation is currently available. In contrast to the conventional thermodynamics applied in macroscopic systems, microscopic thermodynamics has displayed marvellous differences, ranging from violation of the basic thermodynamic laws to the redefinition of thermodynamic quantities. Quantum thermodynamics is a typical development in this aspect parrondo .
In the present Letter, we demonstrate an experiment relevant to configurational variation of cold ion crystals confined in an electromagnetic potential, which belongs to cryogenic phase transition regarding self-organized matter crystal2 ; crystal3 ; crystal4 . The critical behavior in such phase transitions occurred usually due to variation of characteristic parameters of the systems, which could be fully explained by classical physics review1 . These observations, including complex changes of the crystalline configuration config1 ; config2 ; config3 ; config6 ; config7 ; config8 , reflect the roles of nonlinearity and long-range order played in many-body physics. Understanding these characteristics is one of the indispensable prerequisites to the control of dynamics of the complex system at the microscopic level.
Dynamics of microscopic particles is usually subject to thermal fluctuation, which is generally regarded as a detrimental effect. But here we achieve a temperature-induced structural phase transition (SPT) in an ion-crystal system, in which thermal fluctuation could act positively. The SPT is a transformation between the linear structure to the zigzag, belonging to the configurational variation mentioned above config1 ; config2 ; config3 ; config6 ; config7 ; config8 , which was conventionally achieved by changing mechanical equilibrium conditions of the ions. However, the crystalline configuration in our case varies due to controllable change of thermal fluctuation experienced by the ions. Since this fluctuation effect is very feeble and hard to precisely control, generating such a SPT has never been explored before. In fact, this fluctuation effect has also been neglected in previously theoretical studies focusing only on mechanical effects in the laser-ion interaction and Coulomb repulsion, and thus the experimental investigations in this aspect were based on the change of mechanical conditions, such as the trapping potential, e.g., our previous observation sr-6-21547 . Actually, the thermal fluctuation (even quantum fluctuation) effect, although very weak, is another possible factor which could vary the structures of the ion crystals, as predicted in prl-105-265703 . Since this fluctuation effect can be reflected by the ions’ temperature, the associated SPT is called temperature-driven SPT, which, in terms of the calculation in prl-105-265703 , occurs at the ions’ temperature ranging from 1 mK to tens of mK.
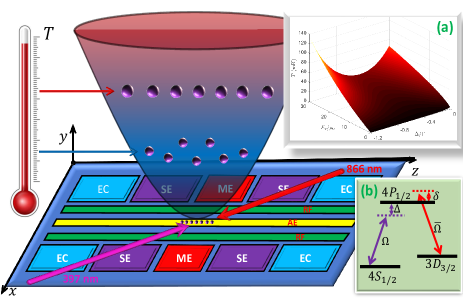
Specifically, our observation focuses on the linear-zigzag variation of seven laser-cooled 40Ca+ ions, due to temperature change, in a surface-electrode trap, as sketched in Fig. 1. The trap is a 500-m scale planar trap with five electrodes made of copper on a vacuum-compatible printed circuit board substrate. The details of the trap potential could be found in sr-6-21547 . One particular point worths mentioning here is the strong asymmetry in the trap, where the potential well in the -axis is much steeper than in both - and -axes, leading to the ion crystals distributed only in the plane. So the anisotropic parameter , with () being the trap frequency in ()-axis, is an important quantity, whose variation over the transition point drives the system to across from one phase to the other sr-6-21547 . In our case here, under the condition of , the ion crystals behave as one (line) or two (zigzag)-dimensional configurations in plane with the thickness less than 2 m along -axis. As a result, our observation is along -axis, which could obtain a full information about the structural changes of the ion crystals.
For our purpose, the key point of our implementation is the capability to controllably adjust the ions’ temperature, which is relevant to the friction due to the cooling laser in this work. As defined in SM , the friction coefficient produced by the cooling laser is given by
| (1) |
where and are, respectively, the Rabi frequency and the linewidth regarding the excited state , and is the wave number of the 397-nm cooling laser which irradiates the ions with respect to -axis by . , and in Eq. (1), as defined in SM , are functions of the detunings and . In our trap system, the bath heating comes from thermal electron noise in the resistance of the electrodes in addition to some anomalous heating heating , the former of which is usually called Johnson noise and the latter is still of unclear mechanism. For convenience of the treatment below, we resort all these noise to the bath heating strength , and thus the ions’ temperature after the Doppler cooling can be written as SM ,
| (2) |
where the first term represents the heating effect due to photon scattering with the detuning-dependent defined in SM and the second term is regarding the bath heating. Based on above equations, we find that the temperature can be fully controlled by the detuning for a certain bath heating strength, as plotted in Inset (a) of Fig. 1.
Experimentally, to ensure a high-quality demonstration of this temperature-induced SPT, we have tried to stabilize the frequencies of both the 397-nm and 866-nm lasers by locking them to an optical cavity (linewidth of 3 MHz) made of a material with ultra-low expansion, and also employing the Pound-Drever-Hall technique. The incident directions of both the lasers are nearly parallel to the trap surface to minimize the scattering light due to the laser beams striking the surface of the trap, where the 866-nm laser with a small angle of with respect to the plane provides a small component of cooling effect in the -axis. The powers of 397-nm and 866-nm lasers are, respectively, W and W, which yield . Besides, to minimize the influence from the rf heating, we have tried, by adjusting the compensation voltage , to keep the ion crystals initially close to the rf potential null, which is along the -axis and above the trap surface by 910 m. Moreover, our experiment gets started from the critical region of the SPT, which is obtained by checking a wide range of the parameters in advance by sweeping , as clarified later.
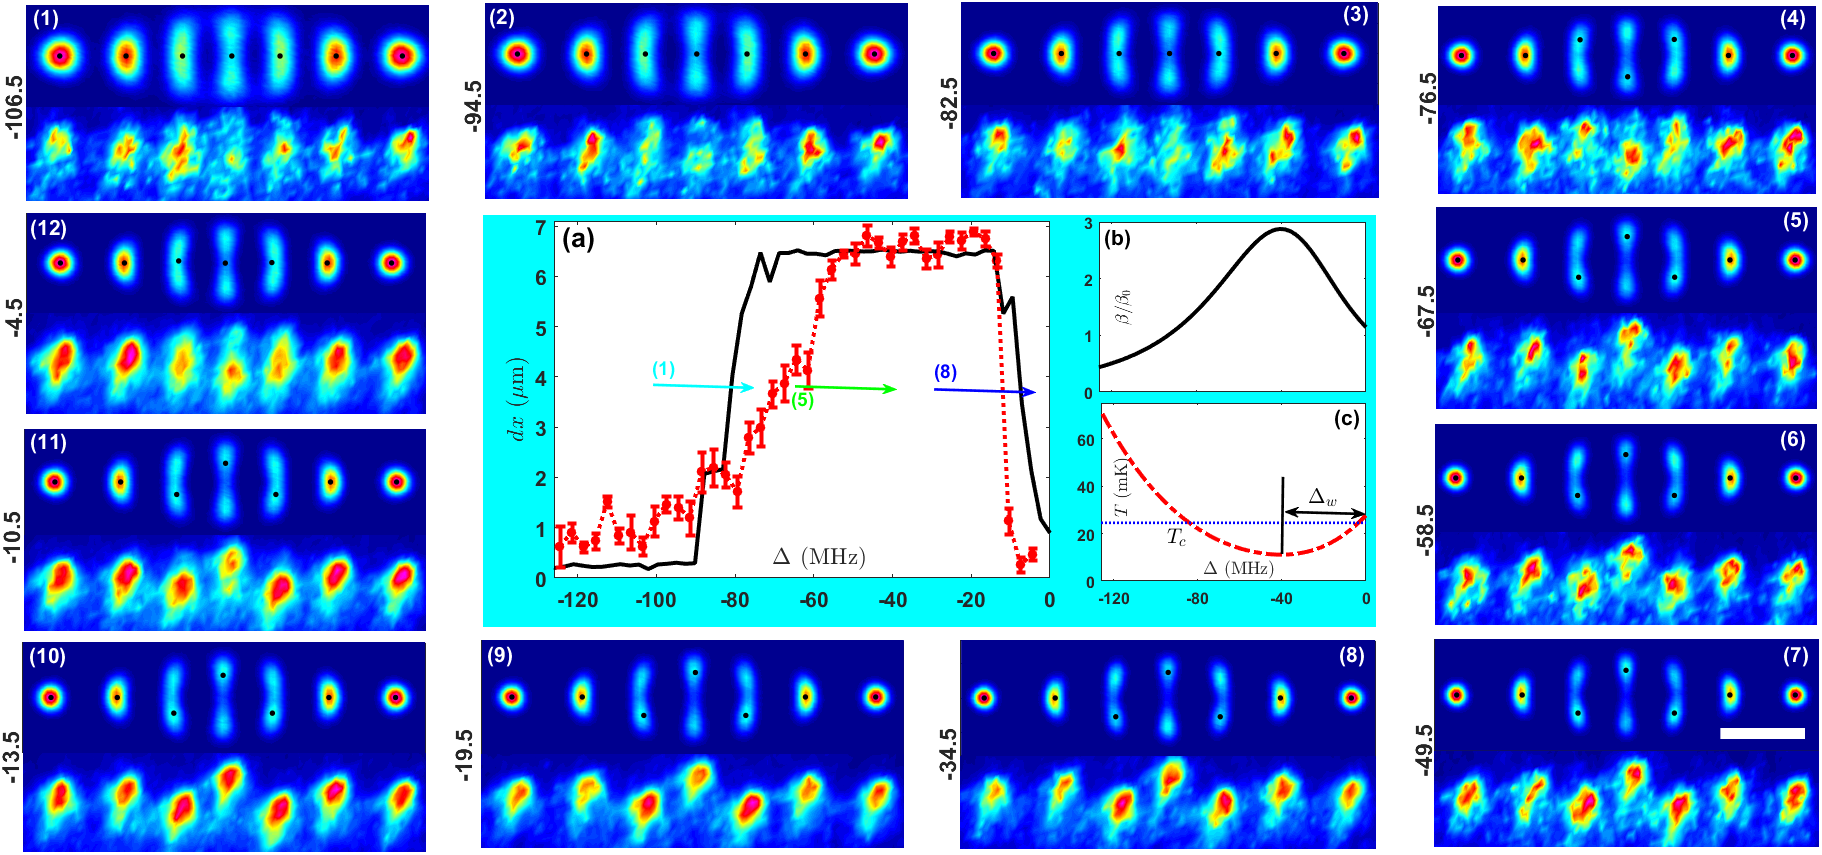
In the experiment, we confine seven ions in the surface-electrode trap by Doppler cooling, and then exactly raise the trapping potential to 3.205, which is accomplished by adiabatically increasing the voltage on the ME electrodes. We sweep the detuning of the 397-nm laser from MHz to MHz, during which the ion crystals experience a weak-strong-weak variation of the cooling efficiency, inducing a structural change from the linear to the zigzag and then back to the linear, as shown in Fig. 2. The resolution blurring of the ions’ images in our observation is due to both thermal effect of the ions resulted from the finite temperature (10 mK 65 mK) and the stray field noise. Nevertheless, considering the center of each ion, we could still identify the configurations of the ion crystals by means of a skillful treatment SM .
Figure 2 indicates the observed configuration changes of the ion crystals in good agreement with the simulated results by the Langevin equation SM . To characterize the structural changes, we employ the center-to-center distance of two outermost ions in -axis as the order parameter, which is very sensitive to the temperature change. As shown in Fig. 2(a), we find an abrupt raising in the curves of with respect to around MHz and an abrupt falling around MHz, implying, respectively, the SPTs from the linear to the zigzag and back to the linear. Based on the analytical results in SM , we may fully understand the phase transitions induced by the variations of the friction coefficient and the ions’ temperature, see Fig. 2(b,c). The critical temperature is mK for both the abrupt raising and falling. The strongest friction of the cooling laser and the lowest temperature of the ion crystals appear at MHz, implying that the zigzag structure occurs at lower temperature than the linear chain. This is also reflected in the observation that the ions in the zigzag phase present clearer pictures even though those ions deviated from -axis should suffer more serious rf heating. Considering all these associated factors, we deem that the laser cooling is dominant in this phase transition process.
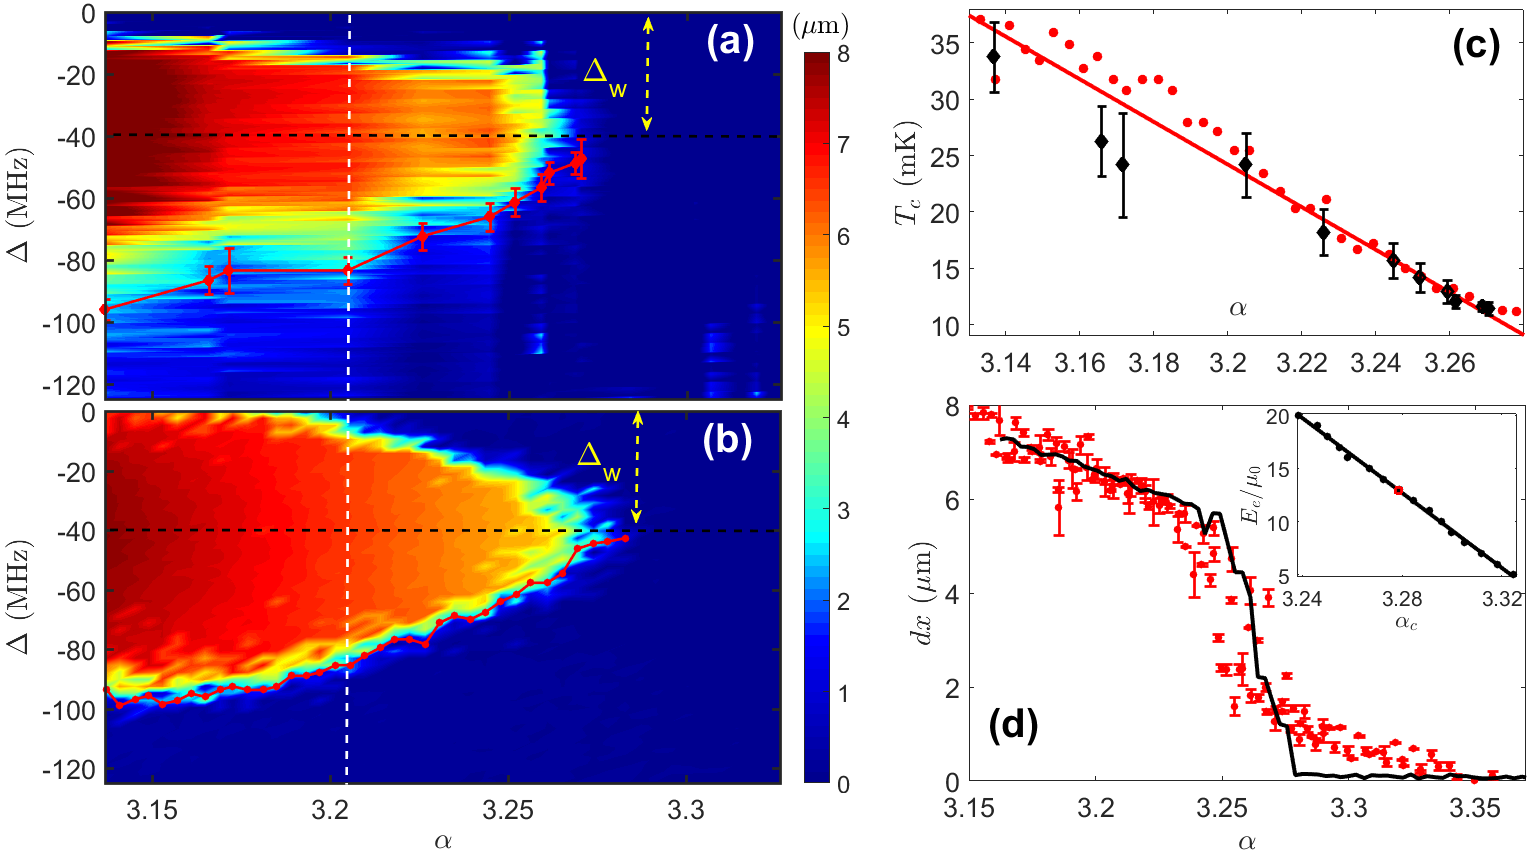
To give a more complete impression on this topic, we should fully characterize the scaling behavior at different transition points, which is also the prerequisite of understanding the present experiment. To this end, we have explored a wide range of and for the critical behavior of the phase transition (Fig. 3). Although the strong bath heating makes the observation of the critical region blurry and deviated somewhat from numerical simulation, the experimentally obtained phase diagram could be in principle explained by numerical results from molecular dynamics method based on Langevin equation SM . For example, we present particularly the comparison between experimental observation and theoretical simulation for the critical region of the abrupt raising (See the red dots in Fig. 3(a,b)), which means that the anisotropic parameter determines the critical detunings. In fact, also determines the corresponding critical temperature, as plotted in Fig. 3(c). As predicted in prl-105-265703 , the SPT occurs due to condensation of phonons into the soft mode - the lowest frequency collective motional mode of the ion crystals, which produces a linear scaling law between the critical temperature and the anisotropic parameter . Our observation in Fig. 3(c) shows that the soft mode exists in the zigzag configuration, conforming to the previous prediction prl-105-265703 ; PRB77-064111 . As happened in finite temperature, the critical behavior is strongly sensitive to the thermal effects, which lead to anharmonic coupling between different phonon modes. The higher temperature of the ions brings about more complicated phonon coupling, implying more challenge to identify the phase transition critical behaviour. Thus, in Fig. 3(c), there are larger errors and deviation observed at the higher temperature.
Besides, we should also measure the bath heating strength before implementing the phase transition. The theoretical study SM has shown a linear relation of the phase transition point with , implying that can be measured by experimentally observing the position of critical point (Inset of Fig. 3(d)). In Fig. 3(d), we choose MHz and find the transition point 3.279(4), which gives . As such, temperature in our experiment can be indirectly detected based on Eq. (2), for which we have proposed an effective method to obtain by measuring in a linear relation SM . Due to short lifetime of the , there was no experimental means to directly detect the Rabi frequency regarding the cooling laser. But with our method, we obtain MHz by measuring MHz in Fig. 3, and thus is obtained.
As final remarks, we mention following important points. The discrepancy between the experimental values and the simulated results indicates the imperfection in our operations with respect to the ideal consideration. The main source of errors is the heating of the thermal bath of the ions, which keeps bringing in thermal noise and leads to measurement imprecision. Besides, frequency instability of the lasers also contributes error, but the detrimental influence from the rf heating is negligible. In above figures, part of the influence due to bath heating on the measurement is resorted to the error bars as statistical errors, and others yield the experimental values deviated from the simulated results. Moreover, to avoid the complexity due to the dark resonance in our case NJP17-045004 ; SM , we have to keep the 866-nm laser slightly blue-detuned throughout the experiment, which is practically accomplished by sweeping the 866-nm laser to the point that the cooling starts weakening. This makes sure that the temperature of the ions is strictly controlled by tuning the frequency of the 397-nm laser.
In conclusion, we have scrutinized the thermal fluctuation effect in a microscopic thermodynamic process by witnessing, for the first time, a temperature-induced phase transition at atomic level, i.e., a linear-zigzag pattern change in ion crystals under controllable influence of thermal fluctuation. Different from the temperature-relevant cloud-order phase transitions in ion traps as observed previously in order1 ; order2 ; order3 , the trapped ions in our case have just changed the crystalline conformation throughout the experimental process. More importantly, our observation of bidirectional changes between the linear and zigzag structures undoubtedly indicates that thermal fluctuation could play an essential role, even a positive role, in microscopic thermodynamics, which could never been understood in the conventional thermodynamics regarding the macroscopic systems. As such, the trapped-ion system in conformation variation provides a good research platform for reconsidering thermodynamic quantities and thermodynamic processes subject to the fluctuation theory flu1 ; flu2 . On the other hand, with further cooling of the ion crystals down to zero temperature, the SPT under consideration can straightforwardly be mapped into a quantum phase transition of Ising model subject to a transverse field Shimshoni ; Schmied ; Bermudez . In this sense, a phase transition from the classical to the quantum would be able to happen RMP84-1655 ; PRB89-214408 , and thus more observations of fascinating quantum behavior under quantum fluctuation would be expected.
This work was supported by National Key RD Program of China under grant No. 2017YFA0304503, by National Natural Science Foundation of China under Grant Nos. 11835011, 11804375, 11734018, 11674360 and 91421111, and by the Strategic Priority Research Program of the Chinese Academy of Sciences under Grant No. XDB21010100.
References
- (1) J. M. R. Parrondo, J. M. Horowitz and T. Sagawa, ”Thermodynamics of information,” Nat. Phys. 11, 131 (2015).
- (2) D. J. Wineland, J. C. Bergquist, W. M. Itano, J. J. Bollinger and C. H. Manney, ”Atomic-ion Coulomb clusters in an ion trap,” Phys. Rev. Lett. 59, 2935 (1987).
- (3) W. M. Itano, J. J. Bollinger, J. N. Tan, B. Jelenković, X.-P. Huang, D. J. Wineland, ”Bragg diffraction from crystallized ion plasmas,” Science 279, 686 (1998).
- (4) M. Drewsen, C. Brodersen, L. Hornekaer, J. S. Hangst, and J. P. Schiffer, ”Large ion crystals in a linear Paul trap,” Phys. Rev. Lett. 81, 2878 (1998).
- (5) D. H. E. Dubin and T. M. O. Neil, ”Trapped nonneutral plasmas, liquids, and crystals (the thermal equilibrium states),” Rev. Mod. Phys. 71, 87 (1999).
- (6) J. P. Schiffer, ”Phase transitions in anisotropically confined ionic crystals,” Phys. Rev. Lett. 70, 818 (1993).
- (7) D. H. E. Dubin, ”Theory of structural phase transitions in a trapped Coulomb crystal,” Phys. Rev. Lett. 71, 2753 (1993).
- (8) D. G. Enzer, M. M. Schauer, J. J. Gomez, M. S. Gulley, M. H. Holzscheiter, P. G. Kwiat, S. K. Lamoreaux, C. G. Peterson, V. D. Sandberg, D. Tupa, A. G. White, R. J. Hughes, and D. F. V. James, ”Observation of power-law scaling for phase transitions in linear trapped ion crystals,” Phys. Rev. Lett. 85, 2466 (2000).
- (9) L. Hornekr, N. Kjrgaard, A. M. Thommesen, and M. Drewsen, ”Structural properties of two-component Coulomb crystals in linear Paul traps,” Phys. Rev. Lett. 86, 1994 (2001).
- (10) N. Kjrgaard and M. Drewsen, ”Observation of a structural transition for Coulomb crystals in a linear Paul trap,” Phys. Rev. Lett. 91, 095002 (2003).
- (11) A. Mortensen, E. Nielsen, T. Matthey, and M. Drewsen, ”Observation of three-dimensional long-range order in small ion Coulomb crystals in an rf trap,” Phys. Rev. Lett. 96, 103001 (2006).
- (12) L.L. Yan, W. Wan, L. Chen, F. Zhou, S. J. Gong, X. Tong,and M. Feng, ”Exploring structural phase transitions of ion crystals,” Sci. Rep. 6, 21547 (2016).
- (13) Z.-X. Gong, G.-D. Lin, and L.-M. Duan, ”Temperature-Driven Structural Phase Transition for Trapped Ions and a Proposal for its Experimental Detection,” Phys. Rev. Lett. 105, 265703 (2010).
- (14) See supplementary materials.
- (15) J. Z. He, L. L. Yan, L. Chen, J. Li and M. Feng, ”Measurement of heating rates in a microscopic surface-electrode ion trap,” Chin. Phys. Lett. 34, 063701 (2017).
- (16) S. Fishman, G. De Chiara, T. Calarco and G. Morigi, ”Structural phase transitions in low-dimensional ion crystals,” Phys. Rev. B 77, 064111 (2008).
- (17) J. Ronagel, K. N. Tolazzi, F. Schmidt-Kaler and K. Singer, ”Fast thermometry for trapped ions using dark resonances,” New J. Phys. 17, 045004 (2015).
- (18) F. Diedrich, E. Peik, J. M. Chen, W. Quint, and H. Walther, ”Observation of a phase transition of stored laser-cooled ions,” Phys. Rev. Lett. 59, 2931 (1987).
- (19) R. Blümel, J. M. Chen, E. Peik, W. Quint, W. Schleich, Y. R. Shen, and H. Walther, ”Phase transitions of stored laser-cooled ions,” Nature (London) 334, 309 (1988).
- (20) R. Blümel, C. Kappler, W. Quint, and H. Walther, ”Chaos and order of laser-cooled ions in a Paul trap,” Phys. Rev. A 40, 808 (1989).
- (21) D. J. Evans, E. G. D. Cohen and G. P. Morriss, ”Probability of second law violations in shearing steady states,” Phys. Rev. Lett. 71, 2401 (1993).
- (22) D. J. Evans and D. J. Searles, ”The fluctuation theorem,” Advances in Physics 51, 1529 (2002).
- (23) E. Shimshoni, G. Morigi, and S. Fishman, ”Quantum zigzag transition in ion chains” Phys. Rev. Lett. 106, 010401 (2011).
- (24) R. Schmied, T. Roscilde, V. Murg, D. Porras, and J. I. Cirac, ”Quantum phases of trapped ions in an optical lattice,” New J. Phys. 10, 045017 (2008).
- (25) A. Bermudez, J. Almeida, F. Schmidt-Kaler, A. Retzker, and M. B. Plenio, ”Frustrated quantum spin models with cold Coulomb crystals,” Phys. Rev. Lett. 107, 207209 (2011).
- (26) K. Modi, A. Brodutch, H. Cable, T. Paterek, and V. Vedral, ”The classical-quantum boundary for correlations: Discord and related measures,” Rev. Mod. Phys.84, 1655 (2012).
- (27) D. Podolsky, E. Shimshoni, P. Silvi, S. Montangero, T. Calarco, G. Morigi, and S. Fishman, ”From classical to quantum criticality,” Phys. Rev. B 89, 214408 (2014).