Closing the U.S. gender wage gap requires understanding its heterogeneity
Abstract
Abstract. In 2016, the majority of full-time employed women in the U.S. earned significantly less than comparable men. The extent to which women were affected by gender inequality in earnings, however, depended greatly on socio-economic characteristics, such as marital status or educational attainment. In this paper, we analyze data from the 2016 American Community Survey using a high-dimensional wage regression and applying double lasso to quantify heterogeneity in the gender wage gap. We found that the gap varied substantially across women and was driven primarily by marital status, having children at home, race, occupation, industry, and educational attainment. We recommend that policy makers use these insights to design policies that will reduce discrimination and unequal pay more effectively.
keywords:
T1This version:
and and
T2Corresponding author. The R-code and supplementary material will be provided upon request and published online at https://www.bwl.uni-hamburg.de/en/statistik/forschung/software-und-daten.html
As a measure of inequality between men and women, the gender wage gap has come to play an important role both in academic research and the public debate. Most studies that have attempted to quantify gender inequality in earnings to date have reported wage gap estimates based on comparisons of the average wages of male and female employees. Most women in the labor force, however, experience wage penalties that differ from these depending on individual characteristics, such as educational attainment and occupation. Understanding the heterogeneity in the gender wage gap is crucial to designing effective and efficient occupation- and industry-specific programs that can lessen gender inequality in earnings for specific groups of female employees, such as married women and mothers.
In this paper, we aim to provide insights into the heterogeneity in the gender wage gap in the United States and, in doing so, contribute to a more comprehensive understanding of gender inequality in income. The extent to which the gender wage gap differs across women has attracted public attention and the interest of policy makers. While numerous policy reports and media articles have attempted to quantify heterogeneity in the wage gap, they have generally taken a simplistic approach based on comparing descriptive statistics across subgroups of people: They define these subgroups in terms of one characteristic only, such as region [9], race, ethnicity [13, 9, 8], or occupation [2, 10, 7]. Approaches such as this are likely to lead to flawed conclusions, however, because they neglect heterogeneity due to other variables. Moreover, statistical significance has only rarely been addressed although it becomes more and more important as the number of characteristics simultaneously being considered increases.
Studies in labor economics usually focus on the average wage gap between men and women, and perhaps control for a few hand-selected control variables [4]. In doing so, they fail to consider that the gender wage gap may vary with the control variables. We are aware of only several studies that examine heterogeneity in the wage gap and correlations with potential drivers of heterogeneity. For instance, in the study by [5], variation in the wage gap by occupation is considered and in [6] the results are compared across specific industries and for married and never-married women. To the best of our knowledge, our study is the first to model heterogeneity in the gender wage gap in terms of a large set of socio-economic variables using representative data for the U.S. We estimated the gender wage gap for each full-time employed woman in the sample and illustrate the distribution of the wage gaps in quantile plots. To assess sources of heterogeneity, we estimated the effects of a rich set of potential determinants and report their joint statistical significance.
We analyzed data from the 2016 American Community Survey (ACS), which is an annual survey of a representative sample of 1% of the U.S. population. Participation in the survey is mandatory. We restricted our analysis to full-time and year-round employees and stratified the data according to participants’ educational attainment. The 2016 ACS collected data on a large number of socio-economic variables at the individual and household levels that we were able to use to model heterogeneity. We included information on marital status, having children at home (i.e., at least one biological, adopted or stepchild 18 years of age or younger), race, ethnicity (i.e., Hispanic origin), English language ability, geographic information (i.e., U.S. census region and metropolitan statistical area), veteran status, labor market characteristics (i.e., industry, occupation, hours worked), and the classic human capital variables (i.e., labor market experience and years of education). For people with a bachelor’s degree, we also included information on their college major. Our final data set comprised 642,229 observations, including 288,095 individuals who had attained a bachelor’s degree or higher (called “bachelor’s degree data” in the following) and 354,134 individuals with lower educational attainment, i.e., at most a high school diploma, GED or equivalent (called “high school degree data”). Further information on the composition of the sample, detailed descriptive statistics, and a description of our model and methodology are provided in the supplementary material available online.
Applying the traditional approach from the literature on labor economics, i.e., an Oaxaca-Blinder decomposition, to the 2016 ACS data results in a wage gap estimate of 17% for people with a high school diploma or lower, and 14% for people with a bachelor’s degree or higher (controlling for individual characteristics). However, the results of our analysis suggest that wage gaps of this magnitude are experienced only by a small proportion of women. To study heterogeneity in the wage gap, we allowed the gap to vary according to the socio-economic characteristics of the survey participants by including two-way interactions between the available variables. As doing so led to a large number of regression coefficients, we used double selection [3] for the least absolute shrinkage and selection operator [12] (double lasso) to estimate the high-dimensional (log) wage regression. This approach allowed us to estimate the gender wage gap – or, more precisely, the relative loss in pay compared to a man with the same socio-economic characteristics – for each woman in the data set. We additionally report the ordinary least squares (OLS) results to allow for comparison.
Figure 1 provides quantile plots of the estimated wage gaps and illustrates that these were highly heterogeneous. Rather than affecting all women to the same extent, gender inequality in wages consisted of a range of wage penalties that differed greatly from woman to woman. For most women, the estimated gap deviated from the abovementioned estimates, derived from traditional analysis, of 17% for people with a high school diploma or lower educational attainment and 14% for people with a bachelor’s degree or higher. Patterns of heterogeneity varied substantially across the two samples, with gender wage inequality being more prevalent and more severe among women with lower educational attainment. Whereas more than 90% of female employees with a high school degree or lower earned significantly less than their male counterparts, only 40% of female employees with a bachelor’s degree or higher experienced a significant wage penalty according to the double lasso results in Figure 1. Moreover, at any given quantile, the wage gap was larger for women who did not have a college degree. The median of the estimated wage gaps was around 9% (non-significant) for women with postsecondary education. In contrast, a wage gap of at least 29% was experienced by half of the women with lower educational attainment. Interestingly, there was evidence of a reversal of the gender wage gap for a small share of women with a college degree, i.e., 4% of the full-time and full-year employees with postsecondary education earned significantly more than comparable men according to our double lasso results.
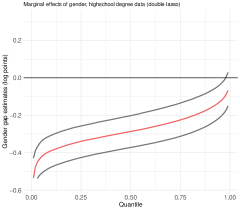
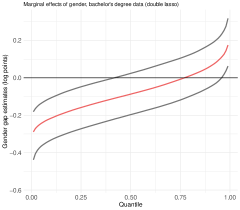
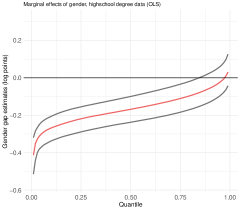
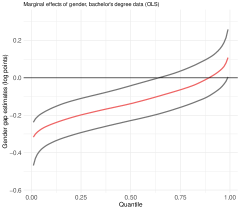
The plots show the quantiles of the individual gender wage gap estimates as computed for all women in the educational attainment subgroups of the ACS 2016 data together with simultaneous 0.95 confidence bands (gray lines). Estimates in Panel (a) are obtained from a high-dimensional wage regression using the double lasso estimator, with log weekly wages as the dependent variable. Plots on the left refer to the high school degree subgroup and plots on the right to the bachelor’s degree subgroup. In addition, ordinary least squares results are provided in Panel (b) for reasons of comparison.
In the next step, we analyzed the drivers of heterogeneity in the wage gap. Figures 2 and 3 present selected estimated effects of discrete regressors on the gender wage gap compared to the baseline group (indicated by the gray vertical line). Negative changes are interpreted as an increase in the absolute value of the wage gap.
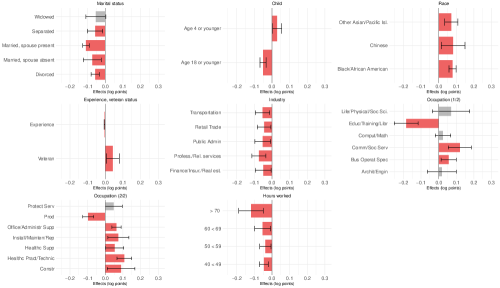
The plot presents selected effects of socio-economic variables on the magnitude of the gender wage gap with joint 0.95 confidence bands (black bounds). Effects indicate significant changes in the wage gap compared to the baseline category indicated by the vertical gray line. Baseline categories are: never married; no biological, adopted or stepchildren at home aged 4 or younger; no biological, adopted or stepchildren at home aged 18 or younger; White; not a veteran; wholesale trade (industry); management, business, science and arts (occupation); 35 to 40 hours work each week.
The plot presents selected effects of socio-economic variables on the magnitude of the gender wage gap with joint 0.95 confidence bands (black bounds). Effects indicate significant changes in the wage gap compared to the baseline category indicated by the vertical gray line. Baseline categories are: never married; no biological, adopted or stepchildren at home aged 4 or younger; no biological, adopted or stepchildren at home aged 18 or younger; White; not a veteran; wholesale trade (industry); management, business, science and arts (occupation); 35 to 40 hours work each week; and education administration and teaching (college major).
In both of the educational attainment subgroups, the gender wage gap showed similar patterns of heterogeneity for the variables marital status, having children at home and race. The effects associated with job-related variables, such as industry, occupation, and hours worked, differed in sign and magnitude across the two subgroups. A particularly large wage penalty was associated with marriage in both subgroups, with married women with spouse present experiencing a gap that, all other things being equal, was around nine to 12 percentage points larger than for women who had never been married. Moreover, our results point to a “motherhood penalty” [11, 14, 1] given that the wage gap was around five percentage points larger for women who had biological, adopted or stepchildren aged 18 or younger living with them. Apparently, the penalty for motherhood is rather time-persistent and does not directly reduce earnings of new mothers, at least for highly educated women. In this sample, mothers who had at least one child aged four or younger at home experienced a wage gap that was two percentage points smaller than for women without children, i.e., women who did not reside with a child aged 18 or younger. It is possible to observe a similar pattern with regard to having a young child at home in the high school subsample. However, the effect of having a young child at home is not sufficiently strong to lead to a comparable reversal, but rather reduces the magnitude of the wage gap for this subgroup.
Interestingly, the wage gap was significantly smaller for races other than White in both samples. The gender gap differentials were more pronounced in the subgroup with lower educational attainment. Hence, the often reported variation of the gender gap according to race [9] was robust to controlling for a large set of characteristics including education, experience, occupation, industry, and level of English language ability. The wage gap did not vary significantly across Hispanics and non-Hispanics.
The effects of the classic human capital variables “years of education” and “labor market experience” were small and non-significant in most cases. In the bachelor’s degree data, the gender wage gap varied according to college major. For 10 majors, including the natural sciences, social sciences and business, the wage gap was significantly larger than in the baseline major (i.e., the category “education administration and teaching”).
Patterns of heterogeneity related to the work environment of full-time employees differed across the two samples, particularly the effects associated with occupation. This difference might be explained by differences in the temporal flexibility of jobs for employees who are highly qualified compared to employees with less education [5, 4]. In concordance with such an explanation, the results of our analysis suggest that, among people with a high school degree or lower, the gender wage gap increased along with the number of working hours. Heterogeneity with respect to industry was found to be stronger for the high school degree subgroup. A common observation in both subgroups is that wage gaps were relatively large in the finance, insurance, and real estate industries, as well as in professional and related services.
In summary, our empirical analysis reveals that in 2016, most full-time employed women in the U.S. experienced a substantial wage penalty compared to observationally equivalent men. However, the extent to which women were affected by gender inequality in earnings differed greatly according to individual characteristics, including educational attainment, marital status, having children at home, race, and job-related characteristics such as occupation and industry. The commonly used average estimates of the gender wage gap can therefore be seen as a poor approximation of the wage penalty experienced by most women. By illustrating and quantifying heterogeneity in the wage gap, we hope to contribute to both the public and the academic discussion, and to provide information that policy makers can use to design more effective policies.
References
- [1] {barticle}[author] \bauthor\bsnmAngelov, \bfnmNikolay\binitsN., \bauthor\bsnmJohansson, \bfnmPer\binitsP. and \bauthor\bsnmLindahl, \bfnmErica\binitsE. (\byear2016). \btitleParenthood and the Gender Gap in Pay. \bjournalJournal of Labor Economics \bvolume34 \bpages545–579. \endbibitem
- [2] {bmisc}[author] \bauthor\bsnmBaxter, \bfnmEmily\binitsE. (\byear2015). \btitleHow the Gender Wage Gap Differs by Occupation. \bnoteCenter for American Progress. 14 April 2015; Available at https://www.americanprogress.org/issues/women/news/2015/04/14/110959/how-the-gender-wage-gap-differs-by-occupation/. \endbibitem
- [3] {barticle}[author] \bauthor\bsnmBelloni, \bfnmAlexandre\binitsA., \bauthor\bsnmChernozhukov, \bfnmVictor\binitsV. and \bauthor\bsnmHansen, \bfnmChristian\binitsC. (\byear2014). \btitleInference on Treatment Effects After Selection Amongst High-Dimensional Controls. \bjournalReview of Economic Studies \bvolume81 \bpages608-650. \bnoteArXiv, 2011. \endbibitem
- [4] {barticle}[author] \bauthor\bsnmBlau, \bfnmFrancine D.\binitsF. D. and \bauthor\bsnmKahn, \bfnmLawrence M.\binitsL. M. (\byear2017). \btitleThe Gender Wage Gap: Extent, Trends, and Explanations. \bjournalJournal of Economic Literature \bvolume55 \bpages789-865. \bdoi10.1257/jel.20160995 \endbibitem
- [5] {barticle}[author] \bauthor\bsnmGoldin, \bfnmClaudia\binitsC. (\byear2014). \btitleA Grand Gender Convergence: Its Last Chapter. \bjournalThe American Economic Review \bvolume104 \bpages1091–1119. \endbibitem
- [6] {barticle}[author] \bauthor\bsnmGoldin, \bfnmClaudia\binitsC., \bauthor\bsnmKerr, \bfnmSari Pekkala\binitsS. P., \bauthor\bsnmOlivetti, \bfnmClaudia\binitsC. and \bauthor\bsnmBarth, \bfnmErling\binitsE. (\byear2017). \btitleThe Expanding Gender Earnings Gap: Evidence from the LEHD-2000 Census. \bjournalAmerican Economic Review \bvolume107 \bpages110-14. \bdoi10.1257/aer.p20171065 \endbibitem
- [7] {bmisc}[author] \bauthor\bsnmNelson, \bfnmLibby\binitsL. \btitleEqual Pay Day: The Most Unequal Jobs in America. \bhowpublishedVox Media. \bnote12 April 2016; https://www.vox.com/2016/4/12/11413246/equal-pay-women-jobs. \endbibitem
- [8] {btechreport}[author] \bauthor\bsnmU. S. Bureau of Labor Statistics (\byear2017). \btitleHighlights of Women’s Earnings in 2016 \btypeReport No. \bnumber1069. \endbibitem
- [9] {bincollection}[author] \bauthor\bsnmThe American Association of University Women (\byear2018). \btitleThe Simple Truth about the Gender Pay Gap. In \bbooktitleSpring 2018 Edition (\beditor\bfnmKathryn\binitsK. \bsnmBibler, ed.). \endbibitem
- [10] {bmisc}[author] \bauthor\bsnmOverberg, \bfnmPaul\binitsP. and \bauthor\bsnmAdamy, \bfnmJanet\binitsJ. \btitleWhat’s Your Pay Gap? \bhowpublishedThe Wall Street Journal. \bnote17 May 2016; http://graphics.wsj.com/gender-pay-gap/. \endbibitem
- [11] {barticle}[author] \bauthor\bsnmSigle-Rushton, \bfnmWendy\binitsW. and \bauthor\bsnmWaldfogel, \bfnmJane\binitsJ. (\byear2007). \btitleMotherhood and Women’s Earnings in Anglo-American, Continental European, and Nordic Countries. \bjournalFeminist Economics \bvolume13 \bpages55-91. \bdoi10.1080/13545700601184849 \endbibitem
- [12] {barticle}[author] \bauthor\bsnmTibshirani, \bfnmR.\binitsR. (\byear1996). \btitleRegression Shrinkage and Selection via the Lasso. \bjournalJ. Roy. Statist. Soc. Ser. B \bvolume58 \bpages267–288. \endbibitem
- [13] {bmisc}[author] \bauthor\bsnmVasel, \bfnmKathryn\binitsK. \btitle5 Things to Know about the Gender Pay Gap. \bhowpublishedCNN. \bnote4 April 2017; https://money.cnn.com/2017/04/04/pf/equal-pay-day-gender-pay-gap/index.html. \endbibitem
- [14] {barticle}[author] \bauthor\bsnmWaldfogel, \bfnmJane\binitsJ. (\byear1998). \btitleUnderstanding the ”Family Gap” in Pay for Women with Children. \bjournalThe Journal of Economic Perspectives \bvolume12 \bpages137-156. \endbibitem