Automatic Classification of Knee Rehabilitation Exercises Using a Single Inertial Sensor: a Case Study
Abstract
Inertial measurement units have the ability to accurately record the acceleration and angular velocity of human limb segments during discrete joint movements. These movements are commonly used in exercise rehabilitation programmes following orthopaedic surgery such as total knee replacement. This provides the potential for a biofeedback system with data mining technique for patients undertaking exercises at home without physician supervision. We propose to use machine learning techniques to automatically analyse inertial measurement unit data collected during these exercises, and then assess whether each repetition of the exercise was executed correctly or not. Our approach consists of two main phases: signal segmentation, and segment classification. Accurate pre-processing and feature extraction are paramount topics in order for the technique to work. In this paper, we present a classification method for unsupervised rehabilitation exercises, based on a segmentation process that extracts repetitions from a longer signal activity. The results obtained from experimental datasets of both clinical and healthy subjects, for a set of 4 knee exercises commonly used in rehabilitation, are very promising.
I Introduction
With the ever-increasing demand for more efficient healthcare delivery, home-based exercise rehabilitation forms the mainstay of rehabilitation after injury or operation [1]. This places an increasing emphasis on the patient’s own self-management skills to maximise the outcome of surgery, yet many fail to adhere to their prescribed exercise programme [2]. Even for those that do adhere to their programme, confusion with the exercise technique and not remembering to complete the programme are common problems [3]. Errors in exercise technique due to insufficient range of movements, time under muscle tension, or biomechanical alignment, have the potential to detract from the outcome of surgery. With assessment of technique typically taking place in the clinic, there is the potential for several weeks of sub-optimal performance between visits. Therefore, a biofeedback system that can be used in the home has the potential to improve exercise performance technique, and hence maximise the outcome of rehabilitation after surgery. With the use of inertial measurement units (IMUs), capable of sampling physical motion characteristics, such as acceleration and angular velocity, exercises can be accurately evaluated using machine learning classification techniques [4, 5, 6]. In this paper, we present the implementation of an automatic exercise classification workflow, illustrating the general system architecture and detailing the phases related to data collection and cleaning, segmentation, feature extraction, and classification. The proposed architecture is integrated into an Android application patients can use to receive real-time biofeedback for their exercise performance. This paper aims to describe in detail the methodological approach used during the phases of data composition, preparation, segmentation and classification of this Android biofeedback application. It will also present and discuss experimental results and highlight future extensions to this work.
II Related work
Current biofeedback methods for biomechanical analysis consist of force plates, camera-based motion capture systems such as Microsoft Kinect, and IMUs [7]. Biofeedback systems using IMUs have been investigated in numerous populations including falls, neurological rehabilitation, physical activity and exercise rehabilitation [7]. Yet examples of these systems in clinical practice in the physical therapy field at present do not classify exercise technique, rather guide the user through the exercise programme by tracking repetitions, with interactive educational features along the way [8]. Chen et al [4] assessed the performance of a classification system for knee rehabilitation exercises based on data collected from 3 IMU sensors. They leveraged on the shank angle variation to segment the exercise signal, and classified the exercises using a mixture of time-domain and frequency-domain features, along with specific information about the angle variation. Their system detects multiple exercise deviations for 3 different knee rehabilitation exercises.
Previous work within this research group has identified the ability to classify exercise performance in commonly prescribed exercises following total knee replacement, and that by reducing the number of sensors to a single IMU, satisfactory levels of accuracy are maintained [7]. In this paper, we extend the work from Bingquan et al [5], who determined that binary classification for knee exercises has higher accuracy scores compared to the corresponding multilabel classification, and that the shin resulted to be the best sensor location for most of the target exercises. In their work, they evaluated the use of multiple sensors to improve segmentation and classification accuracy. However, as we intend to test our system in the home environment with a patient population, we are only using a single sensor located on the shin. We aim to highlight the most effective classification method that can be used for each exercise, and the accuracy these methods deliver. We also outline the method of segmentation for individual repetitions and the results achieved with this technique.
III Data and Methodology
The aim of this study is to assess the performance of a single IMU classification system for four different knee rehabilitation exercises. The position of the unit on the shin is shown to be optimal in terms of detecting deviations that may happen during the exercise execution [9], and is also convenient for easy placement by the patient. The sensor is placed in a neoprene sleeve at the midpoint of the shin, in the midline of the thigh on the anterior aspect.
III-A Exercises and labels
Four popular rehabilitation exercises for the knee are targeted in this paper: the heel slide (HS), the seated knee extension (SKE), the inner range quadriceps (IRQ) and the straight leg raise (SLR). HS, IRQ and SLR require the subject to be in a lying position, while SKE requires the subject to be in a sitting position, as extensively described in [9]. Based on the work in [6], the physical deviations that can be detected with a single shin sensor for the target exercises are excessive hip external rotation (ER) for HS, lack of full knee extension (KF) for SKE, excessive hip flexion (HF) for IRQ and inability to maintain full knee flexion (KF) for SLR.
III-B Study Subjects and Dataset Composition
A balanced dataset of correctly and incorrectly performed exercises is collected from a mixed group of 44 clinical subjects and 10 healthy subjects. Both groups performed 10 correct repetitions and 10 incorrect repetitions for each one of the 4 target exercises. In addition, the healthy subjects performed the exercises simulating fatigue conditions, with different pausing times between every pair of consecutive repetitions, or holding times at the isometric peak of each repetition, and mixing correct and incorrect repetitions. All data collection was supervised by a Chartered Physiotherapist.
III-C Data Collection, Preparation and Preprocessing
The Shimmer3 IMU device [10] was used to collect data using two different kinematic sensors, the triaxial digital accelerometer KXRB5-2042, and the triaxial digital gyroscope MPU-9150 [11]. We kept the device configuration consistent through all the observations, as follows:
-
•
Sampling rate of 102.4 Hz for both accelerometer and gyroscope (a total of 1024 samples are collected every 10 seconds).
-
•
Accelerometer range of .
-
•
Gyroscope range of 500dps.
The device was then calibrated using the Shimmer 9 DoF application. Each sensor axis has a specific baseline and orientation. The baseline represents the value sampled by the Shimmer when gravity only is applied to the sensor. The orientation is used to understand whether the sensor is facing up or down. The task of ensuring that all the units are properly configured, calibrated, and oriented, is paramount during the process of data collection, as baseline values and orientation references play an important role during the segmentation phase.
For each performed exercise, six numerical vectors are directly sampled by the Shimmer. That are, the acceleration and angular velocity signals over the axes , and . In addition, three new vectors are analytically derived and used in the feature extraction phase. They are the magnitude, the pitch, and the roll vectors. The magnitude represents the overall sensor velocity, while the pitch and the roll represent the rotation over the lateral axis and longitudinal axis, respectively. The nine raw signal vectors are smoothed by using a 4th order lowpass Butterworth filter, so that the noise introduced by the elastic vibration of the strap that keeps the Shimmer in place is removed. A subsequent min-max normalization is applied to all signals.
III-D Signal Segmentation
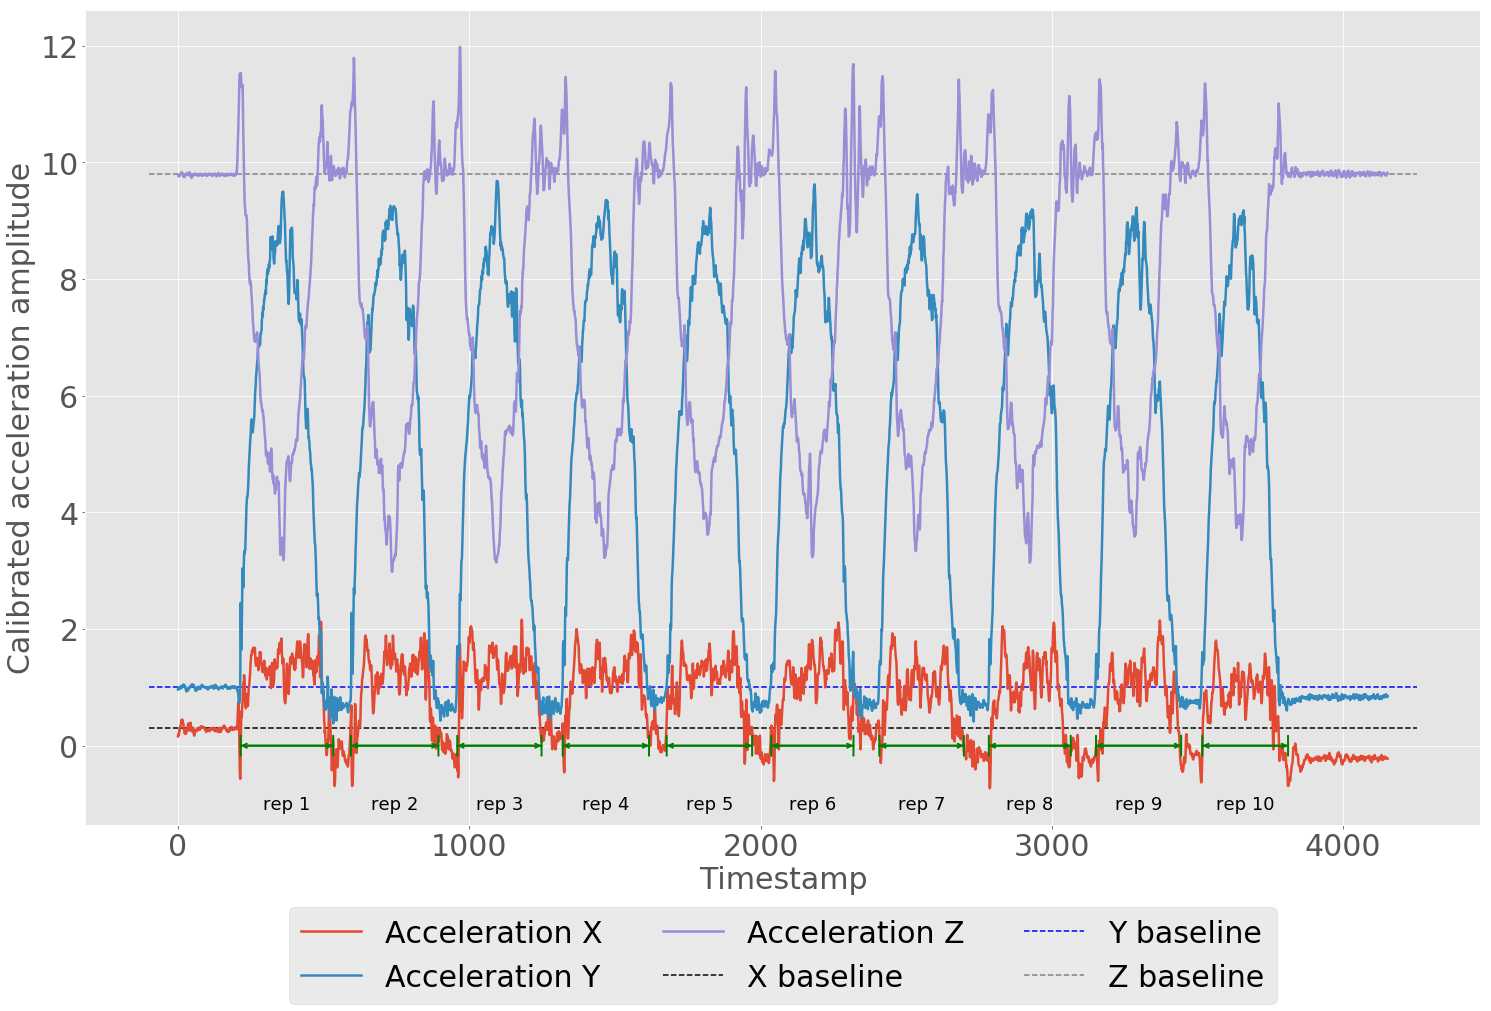
We apply a template matching algorithm to the resulting nine signal vectors. The segmentation algorithm returns a set of coordinates used to trace the repetitions within an exercise, as shown in Figure 1. Our technique exploits the pausing windows interleaving the exercise repetitions in order to detect silent data within the signals, i.e., data points that fall into inactivity periods.
Our signal segmentation approach is described in detail in the following steps:
-
•
Zero velocity points are analytically derived from the signals, by using the expected signal baselines as reference values. Several thresholds are used to single out and discard particularly noisy points.
-
•
The obtained zero velocity points are clustered with the k-means algorithm. The centroid of each cluster is used as the representative point for a signal window that potentially contains silent data only. All the centroids compose the set of candidate points.
-
•
Signal chunks are extracted by using all the pairs of subsequent candidate points. For each chunk, a set of features is extracted. These features are length, height, standard deviation, skewness, kurtosis, and the first 20 coefficients of the signal Fourier transformation.
-
•
Each chunk is classified with a Hoeffding tree, previously trained with a template dataset containing ideal characteristics for properly and improperly executed repetitions.
-
•
All the candidate points that divide the signals into positively classified chunks are returned as cutting points.
III-E Feature Extraction
Once the exercises are chunked into the composing repetitions, a set of 356 features is extracted from each of them. As previously stated, each repetition contains 9 different signal vectors. For each vector, two different groups of features are calculated. Static features are composed of mean, median, standard deviation, variance, range, kurtosis, skewness, maximum, minimum, positive mean, negative mean, sum of absolute differences, 1st quartile, 3rd quartile, and the correlation index between pitch and roll (the last one is only calculated for the pitch and the roll vectors). Dynamic features are composed of energy, energy ratio, energy average, harmonic ratio, energy entropy, and the first 20 coefficients of the signal Fourier transformation.
III-F Repetition Classification
The previously extracted features are used to train a set of classifiers. The adopted models are logistic regression, support vector machine trained with the SMO technique, adaptive boosting, random forest, and J48. The WEKA library [12] was used for the classification phase. The performance for each model is assessed with a 5-fold cross-validation process. In order to avoid overfitting, folds are generated by dividing the datesets over the patients, so that, for each fold, any given subject is included either in the training set or in the test set. During the classification process, the correctly segmented repetitions only are included in the dataset.
III-G Real World Usage
Newly executed exercises are sampled, segmented and classified with a native Android application. The Shimmer3 Bluetooth capabilities allow the application to stream the sampled data, collect them, then perform segmentation, feature extraction and segment classification as described in the above sections.
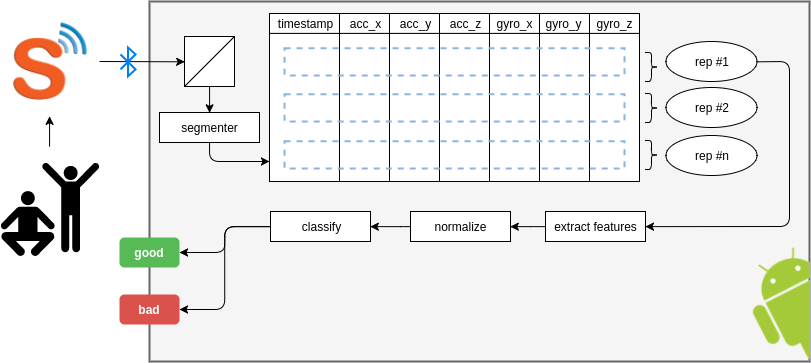
The workflow, illustrated in Figure 2, shows the exercise supervision platform from a high-level perspective. Previously trained and serialized classifiers and segmenters are loaded within our Android application. Each exercise uses the well-suited learning model, according to the results obtained during the training phase.
IV Experimental results
The first step in the evaluation of our classification procedure is to assess the performance of the segmentation process, as the quality of the extracted features highly depends on the cutting points obtained by the segmentation algorithm. A simple counting of correctly and incorrectly segmented repetitions is executed. Visual inspection is required in order to validate the obtained segments, as there is no ground truth based on timestamps that can be used to determine the goodness of the cutting points. As described by equation 1, for each of the exercises in the dataset the absolute difference between the actual number of segments and the extracted segments is calculated, then subtracted from the actual number of segments.
| (1) |
Table I shows the accuracy scores obtained for each combination of exercise and dataset. It also includes the total number of performed repetitions for the exercises.
| Exercise | Dataset | Repetitions | Accuracy |
|---|---|---|---|
| HS | lab | 300 | 0.97 |
| clinical | 714 | 1 | |
| mixed | 1014 | 0.99 | |
| SKE | lab | 857 | 0.98 |
| clinical | 754 | 1 | |
| mixed | 1611 | 0.99 | |
| IRQ | lab | 695 | 0.91 |
| clinical | 661 | 0.99 | |
| mixed | 1356 | 0.95 | |
| SLR | lab | 639 | 0.97 |
| clinical | 658 | 0.99 | |
| mixed | 1297 | 0.98 |
| HS | SKE | IRQ | SLR | ||||||||||
|---|---|---|---|---|---|---|---|---|---|---|---|---|---|
| Model | Metric (%) | lab | clinical | mixed | lab | clinical | mixed | lab | clinical | mixed | lab | clinical | mixed |
| accuracy | 78.69 | 91.75 | 92.61 | 87.34 | 93.12 | 86.05 | 73.35 | 84.98 | 85.33 | 71.79 | 88.93 | 85.6 | |
| precision | 81.57 | 89.15 | 91.44 | 88.78 | 92.93 | 92.56 | 80.63 | 88.88 | 86.14 | 76.24 | 88.69 | 89.12 | |
| Logistic | recall | 72.97 | 87.89 | 90.98 | 86.64 | 92 | 93.75 | 69.66 | 87.81 | 82.68 | 83.48 | 83.57 | 88.87 |
| accuracy | 94.39 | 96.9 | 96.92 | 95.38 | 94.32 | 96.70 | 74.62 | 89.03 | 85.6 | 72.9 | 94.41 | 88.13 | |
| precision | 93.57 | 95.28 | 95.96 | 89.11 | 93.32 | 96.12 | 78.43 | 88.27 | 86.75 | 77.92 | 92.94 | 91.09 | |
| SMO | recall | 92.9 | 95.21 | 95.84 | 93.32 | 91.75 | 96.68 | 65.4 | 86.92 | 82.47 | 78.97 | 88.47 | 89.74 |
| accuracy | 92.99 | 94.86 | 95.52 | 96.63 | 95.92 | 94.13 | 70.99 | 84.66 | 81.14 | 77.86 | 88.98 | 86.86 | |
| precision | 92.87 | 93.94 | 94.52 | 94.05 | 94.97 | 93.82 | 74.60 | 84.41 | 81.49 | 80.69 | 89.26 | 86.24 | |
| Ada Boost | recall | 92.14 | 93.75 | 94.23 | 96.06 | 94.64 | 94.68 | 53.36 | 80.29 | 74.55 | 79.88 | 82.24 | 84.94 |
| accuracy | 95.48 | 97.72 | 97.57 | 96.17 | 95.80 | 93.11 | 73.61 | 90.64 | 84.57 | 76.62 | 87.89 | 84.15 | |
| precision | 96.43 | 97.72 | 97.98 | 91.24 | 95.38 | 94.72 | 76.14 | 90.08 | 84.98 | 76.99 | 90.46 | 86.06 | |
| Rnd. Forest | recall | 95.84 | 97.75 | 97.84 | 95.17 | 94.96 | 95.74 | 57.56 | 88.97 | 79.67 | 75.54 | 84.07 | 85.28 |
| accuracy | 89.53 | 95.01 | 94.95 | 94.44 | 93.05 | 91.75 | 64.06 | 81.91 | 77.34 | 76.67 | 86.78 | 81.44 | |
| precision | 93.72 | 94.6 | 94.98 | 92.69 | 95.26 | 93.17 | 76.22 | 81.09 | 81.07 | 79.58 | 90.51 | 86.7 | |
| J48 | recall | 93 | 94.64 | 94.86 | 95.02 | 95 | 94.01 | 64.4 | 78.41 | 74.6 | 79.35 | 84.13 | 86.29 |
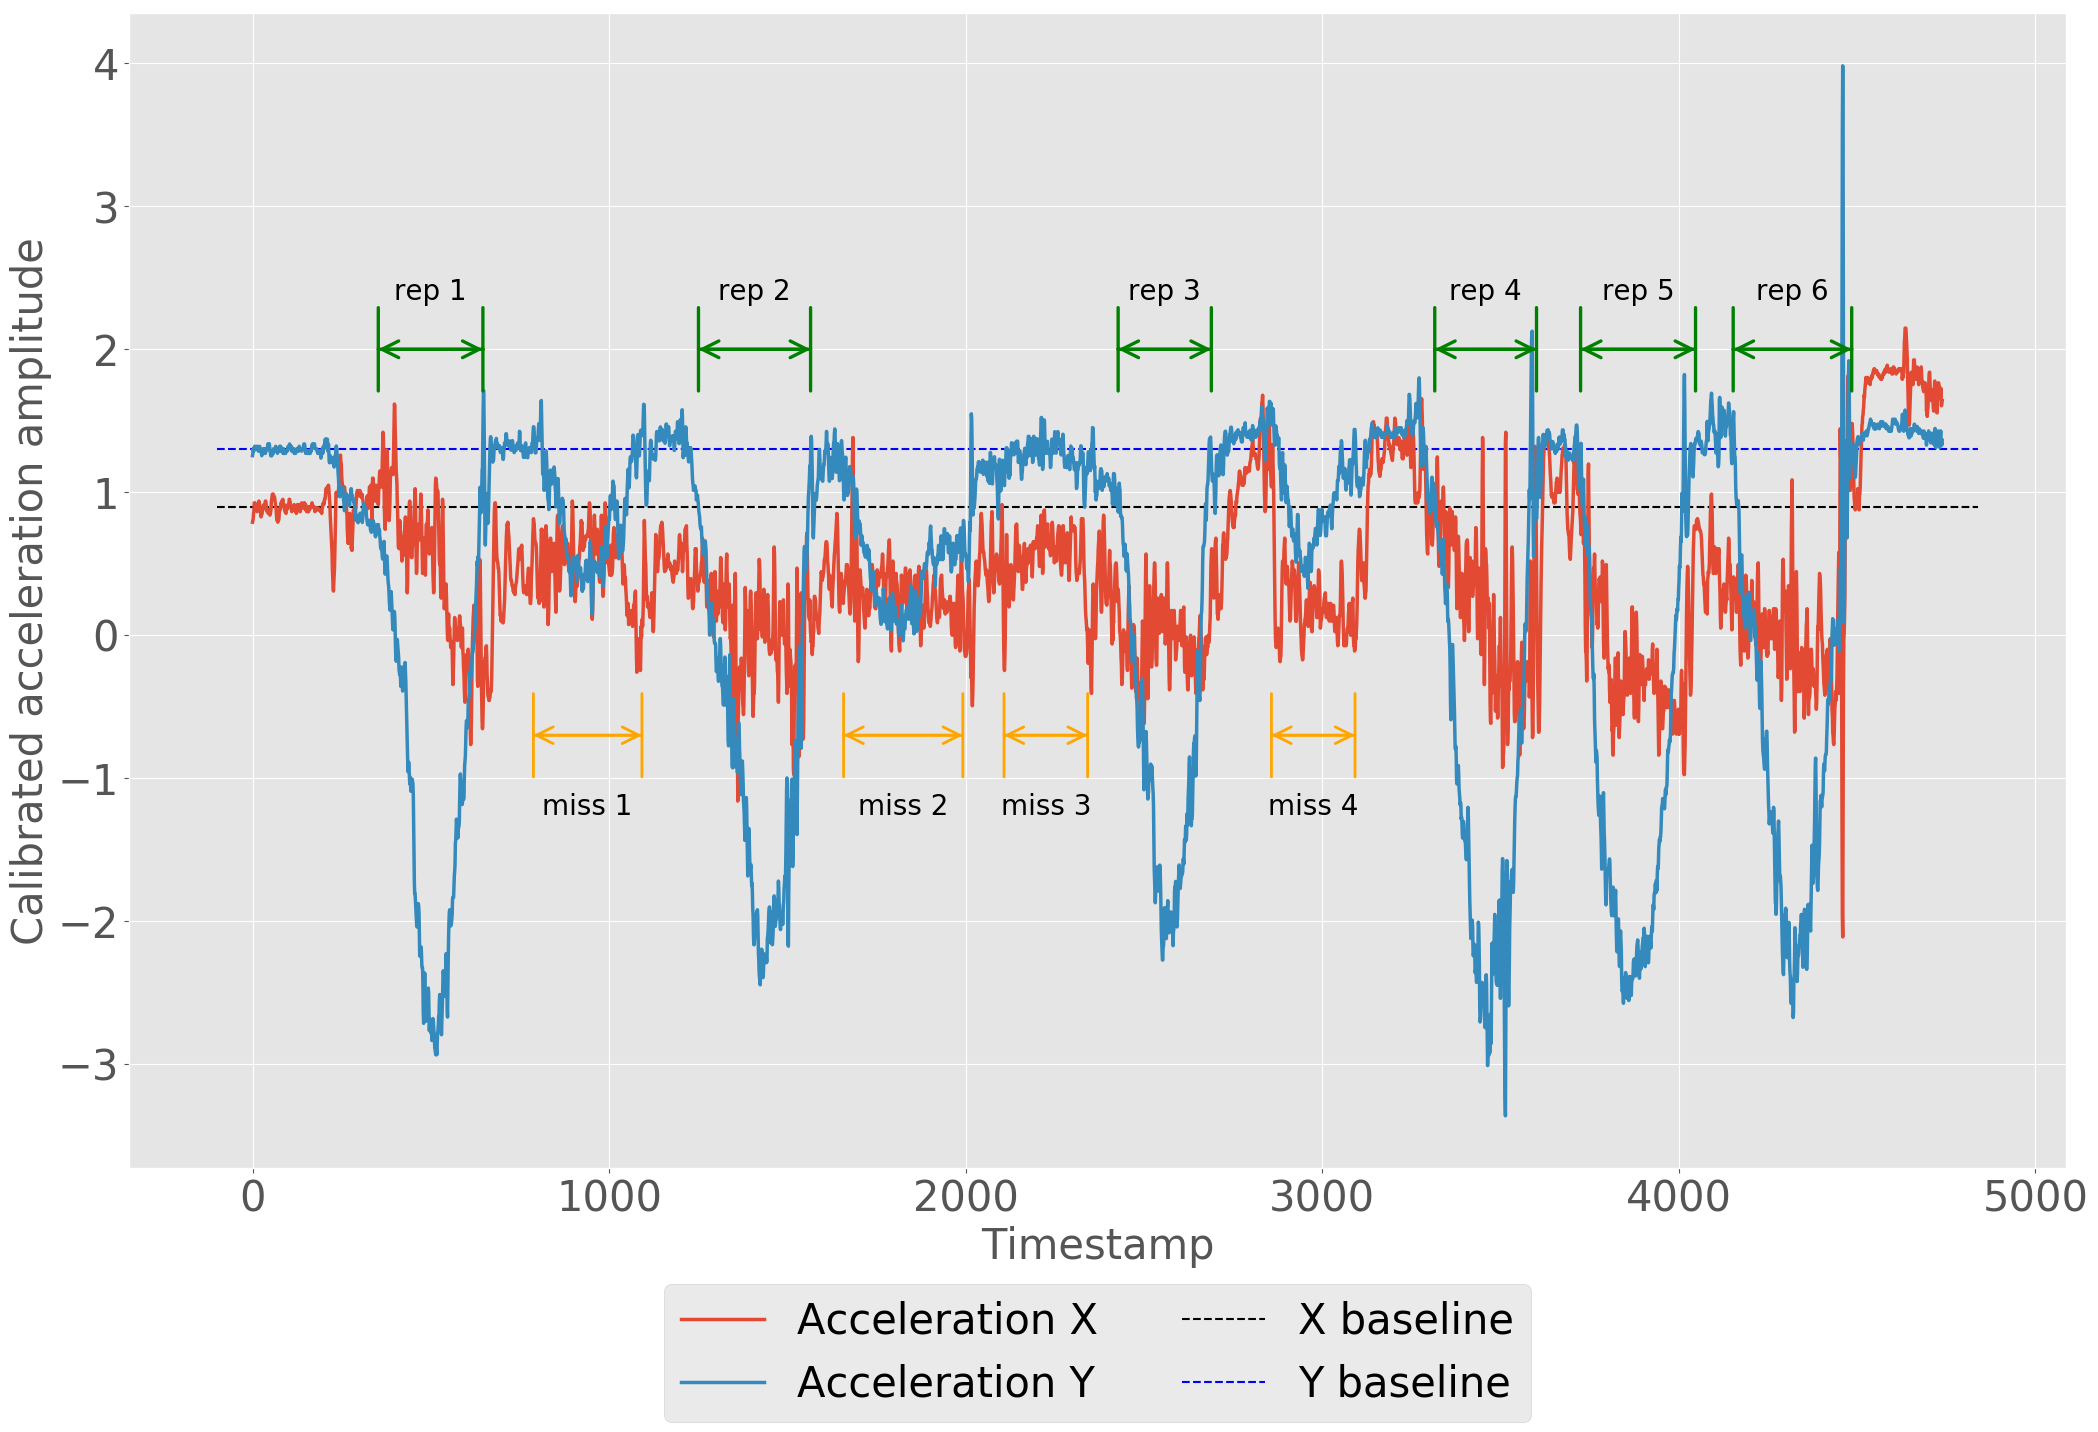
The proposed segmentation algorithm was able to properly detect all the repetitions for HS and SAKE in the clinical datasets. All the incorrectly chunked segments involve bad repetitions, both in mixed exercises and in wrong exercises. An example is shown in Figure 3, where 4 repetitions out of 10 executed for an IRQ exercise performed by one of the healthy subjects are not recognised. The first 4 repetitions of this particular execution instance alternate between good and bad, then a bad-good-bad sequence follows, then 3 good repetitions close the exercise. The exasperation of simulated bad exercise executions led to poor segmentation results.
The classification results are listed in Table II. For each exercise, the best values for accuracy, precision and recall are highlighted in green. The SMO model was the most effective for SKE and SLR, while the Random Forest performed best on HS and IRQ. Due to its narrow movement range, IRQ obtained the less satisfying results, especially in the laboratory dataset.
V Conclusions and future work
In this paper, we presented a system that provides an automatic feedback to patients on knee rehabilitation exercises. The collected data come from a heterogeneous group of subjects, under a wide range of conditions. The experimental results obtained from our campaigns show that the system is very promising, thus further work is recommended. A usability study should validate the performance of our Android application when adopted by real clinical patients, as well as the accuracy level obtained for the classification of full rehabilitation exercises, for which a minimum number of correct repetitions is required. Different segmentation techniques should be tested, and the quality of segments obtained from online algorithms should be properly assessed. In this regard, Fourier transformation of the signals or interpolating functions plays a key role in our future investigation. An exploratory study can also be performed by using data collected with different device setups or by using different hardware. In particular, the capabilities of common smartphone sensors hold a significant research interest, as they often present a lower sampling frequency when compared with medical devices.
References
- [1] “Total knee replacement exercise guide,” http://orthoinfo.aaos.org/topic.cfm?topic=a00301, accessed: 2017-09-30.
- [2] S. Bassett, “Measuring patient adherence to physiotherapy,” Journal of Novel Physiotherapies, vol. 2, no. 7, pp. –, 2012. [Online]. Available: https://www.omicsonline.org/open-access/measuring-patient-adherence-to-physiotherapy-2165-7025.1000e124.php?aid=7152
- [3] J. Smith, J. Lewis, and D. Prichard, “Physiotherapy exercise programmes: Are instructional exercise sheets effective?” Physiotherapy theory and practice, vol. 21, Nov 2005.
- [4] K.-H. Chen, P.-C. Chen, K.-C. Liu, and C.-T. Chan, “Wearable sensor-based rehabilitation exercise assessment for knee osteoarthritis,” Sensors, vol. 15, no. 2, p. 4193–4211, Feb 2015. [Online]. Available: http://dx.doi.org/10.3390/s150204193
- [5] B. Q. Huang, O. M. Giggins, M. T. Kechadi, and B. Caulfield, “The limb movement analysis of rehabilitation exercises using wearable inertial sensors,” in 38th Annual International Conference of the IEEE Engineering in Medicine and Biology Society, EMBC 2016, Orlando, FL, USA, August 16-20, 2016, 2016, pp. 4686–4689. [Online]. Available: https://doi.org/10.1109/EMBC.2016.7591773
- [6] O. M. Giggins, K. T. Sweeney, and B. Caulfield, “Rehabilitation exercise assessment using inertial sensors: a cross-sectional analytical study.” J Neuroeng Rehabil, vol. 11, no. 1, p. 158, 2014. [Online]. Available: http://www.biomedsearch.com/nih/Rehabilitation-exercise-assessment-using-inertial/25431092.html
- [7] O. M. Giggins, U. M. Persson, and B. Caulfield, “Biofeedback in rehabilitation,” Journal of NeuroEngineering and Rehabilitation, vol. 10, no. 1, p. 60, Jun 2013. [Online]. Available: https://doi.org/10.1186/1743-0003-10-60
- [8] P. Smittenaar, C. J. Erhart-Hledik, R. Kinsella, S. Hunter, G. Mecklenburg, and D. Perez, “Translating comprehensive conservative care for chronic knee pain into a digital care pathway: 12-week and 6-month outcomes for the hinge health program,” JMIR Rehabil Assist Technol, vol. 4, no. 1, p. e4, Apr 2017. [Online]. Available: http://rehab.jmir.org/2017/1/e4/
- [9] O. Giggins, D. Kelly, and B. Caulfield, “Evaluating rehabilitation exercise performance using a single inertial measurement unit,” pp. 49–56, 2013. [Online]. Available: http://dx.doi.org/10.4108/icst.pervasivehealth.2013.252061
- [10] A. Burns, B. R. Greene, M. J. McGrath, T. J. O’Shea, B. Kuris, S. M. Ayer, F. Stroiescu, and V. Cionca, “ShimmerTM a wireless sensor platform for noninvasive biomedical research,” IEEE Sensors Journal, vol. 10, no. 9, pp. 1527 – 1534, 2010.
- [11] “Shimmer3 specification sheet, v1.6,” http://www.shimmersensing.com/images/uploads/docs/Shimmer3_Spec_Sheet_V1.6.pdf, accessed: 2017-08-25.
- [12] M. Hall, E. Frank, G. Holmes, B. Pfahringer, P. Reutemann, and I. H. Witten, “The WEKA data mining software: an update,” SIGKDD Explorations, vol. 11, no. 1, pp. 10–18, 2009.