Supplementary information – A monolithic mid-infrared frequency comb platform based on interband cascade lasers

Benedikt Schwarz1∗, Johannes Hillbrand1, Maximilian Beiser1, Aaron Maxwell Andrews2, Gottfried Strasser2, Hermann Detz2,3, Anne Schade4, Robert Weih4,5 and Sven Höfling4,6

footnotetext: 1Institute of Solid State Electronics, TU Wien, Gußhausstraße 25, 1040 Vienna, Austria
2Center for Micro- and Nanostructures, TU Wien, Gußhausstraße 25, 1040 Vienna, Austria
3Central European Institute of Technology, Brno University of Technology, Brno, Czech Republic
4Technische Physik, Physikalisches Institut, University Würzburg, Am Hubland, 97074 Würzburg, Germany
5Nanoplus Nanosystems and Technologies GmbH, 97218 Gerbrunn, Germany
6SUPA, School of Physics and Astronomy, University of St Andrews, St Andrews, KY16 9SS, United Kingdom
e-mail: benedikt.schwarz@tuwien.ac.at
Refer to caption
Supplemental Figure 1: Comparison of ICL and QCL frequency combs a SWIFTS analysis of the ICL frequency comb, as shown in the paper. The intermode difference phases cover the range from π𝜋\pi to π𝜋-\pi from the lowest to the highest frequency mode of the optical spectrum. b SWIFTS analysis and corresponding time domain signal of a QCL frequency comb [18]. The QCL frequency comb shows the same linear chirp of the intermode difference phases with the subtle difference of the positive slope. Irrespective of the sign of the slope, both states shown in this figure constitute a phase balancing state.
Refer to caption
Refer to caption
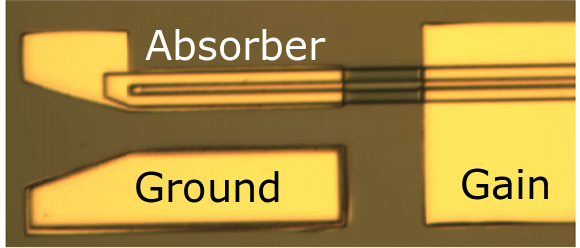
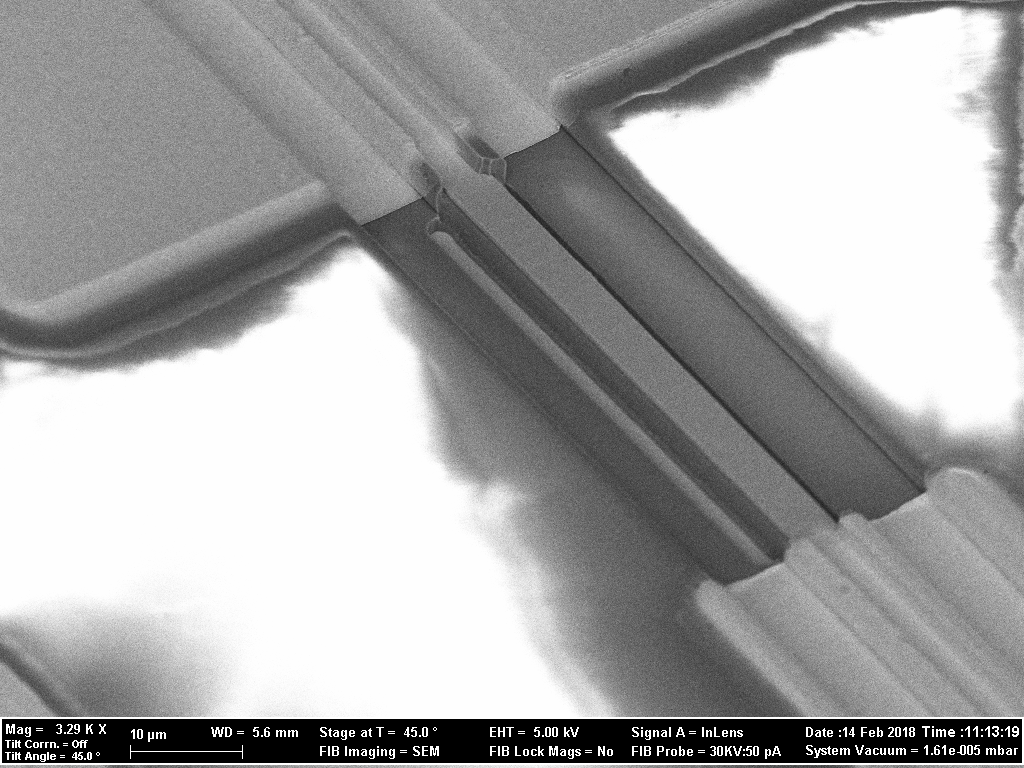
Supplemental Figure 2: a: Microscope image of a typical device. A 40 GHz signal-ground RF probe is positioned between the top contact of 160 µm long absorber section and the ground pad beside it. The SiN passivation layer of the absorber section is chosen to be relatively thick in order to decrease the parasitic capacitance of the absorber top contact enabling efficient RF injection. b: Scanning electron microscope image of the section of the ridge waveguide between the absorber and the gain section. This section was 60 µm long for all tested devices. This length was chosen to separate the top contacts of the absorber and gain sections electrically in order to allow different biasing of the two sections without permanently burning the device by excessive transverse current. Furthermore, the uncontacted section was also covered with a passivating SiN layer in order to ensure the continuity of the effective refractive index of the waveguide mode and prevent coupled cavity effects.
Refer to caption
Supplemental Figure 3: Another repulsively synchronized frequency comb state: a: The intensity spectrum spans over roughly 40 cm-1. The SWIFTS spectrum has the same shape as the intensity spectrum without any spectral holes, proofing that the frequency comb is phase-coherent. The phases clearly show a phase balance state covering the range between π𝜋\pi and π𝜋-\pi due to repulsive synchronization. The center burst of the corresponding SWIFTS interferograms (zoom) show a local minimum that is characteristic for FM-type comb states indicating the suppression of amplitude modulation at the cavity roundtrip frequency due to the fast gain dynamics. b The reconstructed time domain signal does not show the generation of short pulses. This is because the intermodal difference phases in (a) correspond to the group delay. Due to the phase balance state, all parts of the spectrum arrive at a different time during on cavity roundtrip time. Nevertheless, two spikes of large output intensity are visible. This is caused by the flat intermodal difference phases around 2595 cm-1.
Refer to caption
Supplemental Figure 4: Output power, current, voltage characteristics of the used ICL. The curve was recorded with a short section bias of 3V. The maximum output power is about 2.82.82.8\,mW and was measure with a calibrated thermal detector placed close to the laser facet. No correction factors where used.
Refer to caption
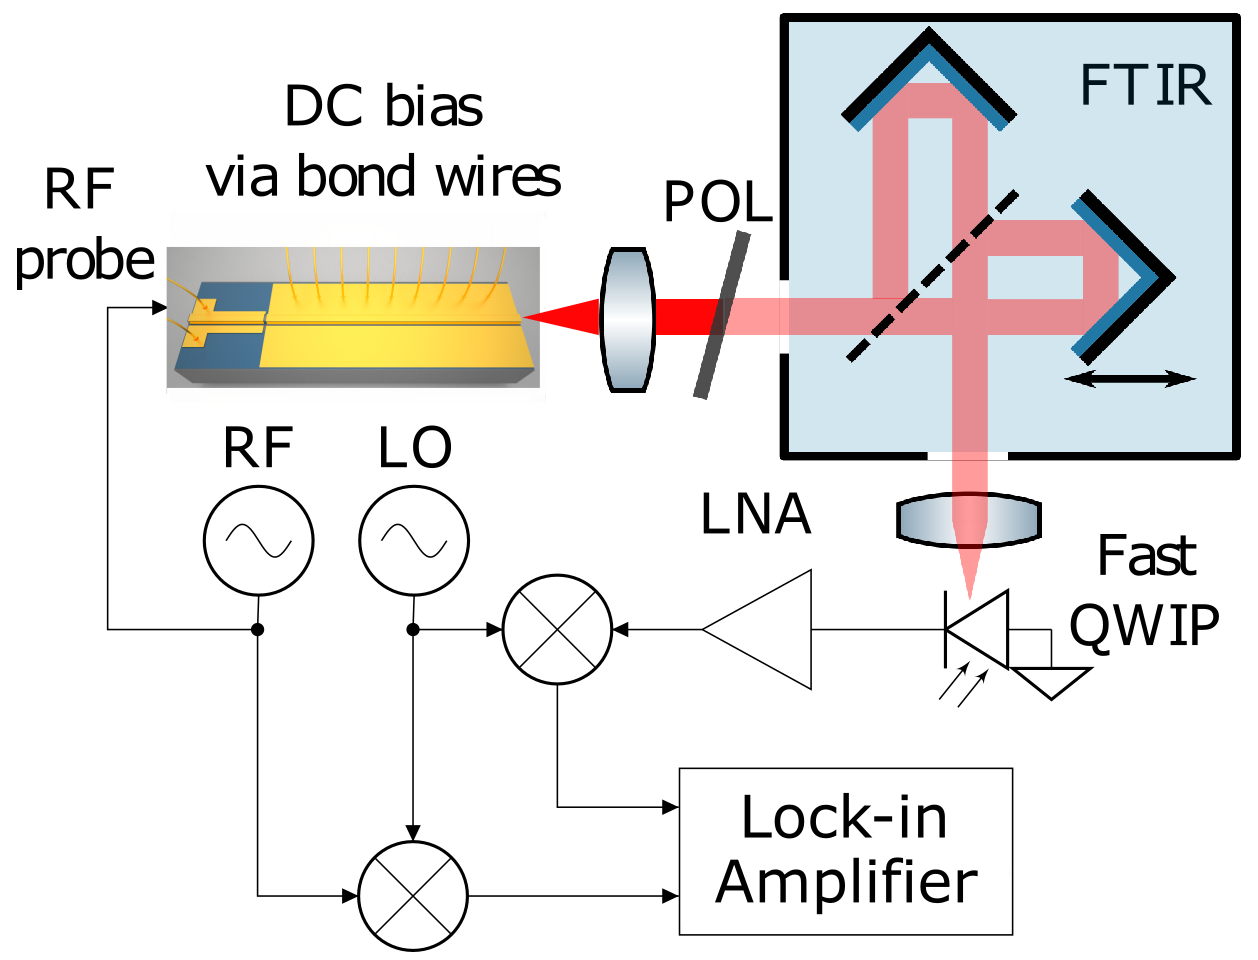
Supplemental Figure 5: Schematic drawing of the SWIFTS setup. A RF oscillator is used to electrically lock the ICL resulting in the generation of a frequency comb. The light emitted by the ICL is attenuated by a polarizer (POL), shined through a FTIR spectrometer and detected by a fast QWIP (\approx 8 GHz bandwidth). The DC intensity spectrum is obtained by recording the DC current of the QWIP. In order to obtain the SWIFTS spectra, the optical beatnote detected by the QWIP is amplified by a low-noise-amplifier (LNA) and mixed down to \approx 40 MHz using a second RF oscillator. A lock-in amplifier records both SWIFTS quadrature interferograms using the Helium-Neon trigger of the FTIR spectrometer. Due to the narrowband filter of the lock-in amplifier, only the light beating at the frequency of the first RF oscillator, that is used for injection locking, contributes to the SWIFTS interferograms. In this way it is possible to judge whether the mode-spacing frequency comb is locked to the frequency of the RF oscillator.
Refer to caption
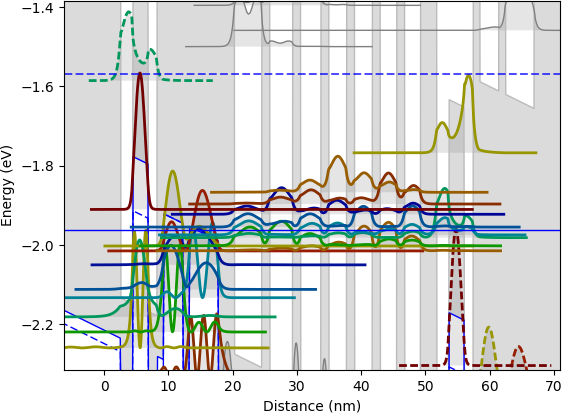
Supplemental Figure 6: Simulated bandstructure of the used ICL. The probability densities of the envelopes were calculated using a home-build multi-band k\cdotp solver and are plotted at the gamma point. Most ICLs have a very similar design.