Ultra-bright CO and [CI] emission in a lensed submillimeter galaxy with extreme molecular gas properties
Abstract
We report the very bright detection of cold molecular gas with the IRAM NOEMA interferometer of the strongly lensed source WISE J132934.18224327.3 at , the so-called Cosmic Eyebrow. This source has a similar spectral energy distribution from optical-mid/IR to submm/radio but significantly higher fluxes than the well-known lensed SMG SMMJ 2135, the Cosmic Eyelash at . The interferometric observations identify unambiguously the location of the molecular line emission in two components, component CO32-A with I Jy km s-1 and component CO32-B with I Jy km s-1. Thus, our NOEMA observations of the CO(3-2) transition confirm the SMG-nature of WISE J132934.18224327.3, resulting in the brightest CO(3-2) detection ever of a SMG. In addition, we present follow-up observations of the brighter component with the Green Bank Telescope (CO(1-0) transition) and IRAM 30m telescope (CO(4-3) and [CI](1-0) transitions). The star-formation efficiency of 100 L☉/(K km s-1 pc2) is at the overlap region between merger-triggered and disk-like star-formation activity and the lowest seen for lensed dusty star-forming galaxies. The determined gas depletion time 60 Myr, intrinsic infrared star-formation SFR M⊙ yr-1 and gas fraction Mmol/M indicates a starburst/merger triggered star-formation. The obtained data of the cold ISM — from CO(1-0) and dust continuum — indicates a gas mass M M☉ for component CO32-A. Its unseen brightness offers the opportunity to establish the Cosmic Eyebrow as a new reference source at for galaxy evolution.
1 Introduction
The number counts of dusty star-forming galaxies (DSFGs; see for a review Casey et al., 2014) are steep (Blain, 1996; Negrello et al., 2007), thus bright, luminous sources should be rare in the sky. To discover them large infrared surveys covering several hundred to thousand square degrees are needed. The advent of telescopes like Herschel (Pilbratt et al., 2010), Planck (Tauber et al., 2010; Planck Collaboration et al., 2011) and the South Pole Telescope (SPT Carlstrom et al., 2011) and their subsequent surveys of large parts of the sky (e.g., Carlstrom et al., 2011; Eales et al., 2010; Oliver et al., 2012) provide the indispensable dataset to search for such sources.
The combination of an increased probability of lensing towards higher redshift (e.g., Béthermin et al., 2015) and the steep number counts of DSFGs facilitate the search and selection of extremely bright star-forming galaxies at the peak epoch of galaxy formation at (e.g., Madau & Dickinson, 2014). Thus, in the past decade an increasing number of bright, lensed galaxies have been discovered, followed by subsequent observations of the cold molecular gas, the fuel of star-formation (e.g., Negrello et al., 2010; Cox et al., 2011; Vieira et al., 2013; Cañameras et al., 2015; Harrington et al., 2016, 2018; Yang et al., 2017).
Observations of the cold interstellar medium, molecular gas and dust, enables us to study in detail important properties of star-formation processes such as the content of the molecular gas, the star-formation efficiency (SFE) and gas fraction (e.g., Carilli & Walter, 2013). In case of detecting several CO transitions, the so-called CO spectral line energy distribution (CO SLED), can be constructed and molecular gas properties such as gas excitation and temperature can be studied (e.g., Dannerbauer et al., 2009; Daddi et al., 2015).
Among the brightest, lensed submillimeter galaxies (SMGs), SMM J2135, the so-called Cosmic Eyelash, at (Swinbank et al., 2010) provides a good reference to further identify in the sky even brighter SMGs which may facilitate subsequent detailed spatial and spectral studies. We carried out a search for bright analogues of similar colours using the VISTA Hemisphere Survey (VHS) (McMahon et al., 2013) and WISE (Wright et al., 2010) over a region of more than 6230 square degress. Details of our source selection and first results of this correlation were published in Iglesias-Groth et al. (2017). Subsequently, modifying and extending our technique, Díaz-Sánchez et al. (2017) have shown that cross-matching between the AllWISE and Planck full-sky compact source catalogues adopting appropriate colour criteria can lead to the identification of extremely bright, lensed SMGs.
The most promising candidate found in this full-sky search is WISE J132934.18224327.3 (alias P13292243), the so-called Cosmic Eyebrow. This source is found in a strong lensing cluster at (Oguri et al., 2012) which has been observed by Jones (2015) with JCMT/ SCUBA-2, reporting the discovery in snapshot observations of one submillimeter source at 850 and 450 m with S mJy and S mJy (Jones, 2015), and consistent with this source being the main counterpart of our measured Planck fluxes. For comparison, the flux densities of the Cosmic Eyelash at the same wavelengths are S mJy and S mJy (Ivison et al., 2010). Within 1 arcsec of the position of the SCUBA-2 submillimeter source, we find in the HST-ACS images a lensed, arc-like galaxy, split into two sources. Low-resolution rest-frame UV-optical spectroscopy of this lensed galaxy obtained with the 10.4 m GTC revealed the typical absorption lines of a starburst galaxy at (Díaz-Sánchez et al., 2017). Archival Gemini-N near-IR spectroscopy provided a clear detection of Hα emission at . We determined an intrinsic rest-frame 81000 m luminosity, LIR of (1.30.1)1013 L⊙ and a likely star-formation rate (SFR) of 2000 M⊙ yr-1, taking into account a lensing amplification factor of calculated with Lenstool (Kneib et al., 1993; Jullo et al., 2007). At all frequencies from the optical to the radio, the spectral energy distribution (SED) of P13292243 shows a remarkable similarity to the Cosmic Eyelash but is brighter (up to a factor 4) than the Cosmic Eyelash, and thus it is one of the brightest high-z lensed SMGs ever detected. In this paper, we present our cold molecular gas follow-up of WISE J132934.18224327.3 with the NOEMA interferometer and two single dish telescopes, the Green Bank Telescope (GBT) and the IRAM 30m telescope. In section 2, we present the observations and in section 3 the results. In section 4, we discuss the properties of our target and conclude in section 5. We adopt a flat CDM cosmology from Planck Collaboration et al. (2014) with H km s-1 Mpc-1, , ,.
2 Observations
2.1 NOEMA
On 27 August 2017 we observed P13292243 with IRAM NOEMA for a total of 4.9 hours (DDT D17AA: PI H. Dannerbauer) with eight antennae in D configuration (E04W08E10N13W12N02W05N09). We used the Wide-X receiver, offering a bandwidth of 3.6 GHz, in dual polarization mode and targeted the redshifted CO(3-2) line at 113.599 GHz (tuning frequency). The phase center is RA13:29:34.03 and Dec22:43:25.5. Our observations cover the frequency range from 111.8 to 115.4 GHz, including the CS(7-6) line (342.883 GHz in the rest-frame), expected to lie at 112.790 GHz. The data were calibrated through observations of standard bandpass (3C279), phase/amplitude (1328+307) and flux calibrators (MWC349, 1328307) and reduced with the GILDAS software packages CLIC and MAPPING. Using the deconvolution algorithm/method HOGBOM, we have ”cleaned” the ”dirty map” of the NOEMA observations. The FWHM of the synthesized beam is at 113.6 GHz. The field of view respectively the full width at half power of the primary beam (largest scale to be detected) is , and includes several families of multiply lensed background galaxies – called A, C, E and F (see Fig. 1 in Díaz-Sánchez et al., 2017) — used to perform a lens model of the foreground galaxy cluster at (Díaz-Sánchez et al., 2017).
2.2 Green Bank Telescope
The CO (1-0) line emission was observed using the Ka band receiver on the GBT. The pointing position was very close to the NOEMA one (RA13:29:34.18 and Dec22:43:27.3). Observations (GBT/17B-305; PI: K. Harrington) took place on October 16th, 2017, under good sky conditions. The FWHM of the main beam at the observed frequency of 37.9 GHz is 20′′. We used the standard SubBeamNod111Nodding the 8 m GBT sub-reflector every 6 seconds between each of the two receiver feeds for an integration time of 4 minutes. procedure, with 4 minute integrations per scan. Pointing and focus were performed before the SubBeamNod integrations, with a follow-up pointing directly to minimize losses in efficiency. The backend spectrometer, VEGAS, was used in its low-resolution 1.5 GHz bandwidth mode tuned to the expected CO (1-0) line frequency. Using GBTIDL (Marganian et al., 2013), we reduced the on-off measurements and corrected for the atmospheric attenuation (see Harrington et al., 2018). After dropping bad scans, we smoothed the averaged spectra to 50 km s-1 channels, and further removed a low order polynomial outside of the line emission. The resulting on-source integration time was 0.5 hours. Flux accuracy was checked with the standard source Uranus and pointing stability with 08417053, 13103220, 13313030 and 16423948. We use a gain conversion factor of 1 K/1.5 Jy and adopt a 25 % uncertainty for systematic uncertainties (baseline removal, flux calibration, pointing/focus drifts), and note that the observed frequency lies at the edge of the Ka bandpass where receiver performance can be limited.
2.3 IRAM 30m Telescope
Using the IRAM 30m, we observed the CO (4-3) and the [CI] (1-0) transitions with the EMIR receiver (Carter et al., 2012), — same pointing position as for the GBT. The observations (170-17; PI: K. Harrington) took place on February 10th and 11th, 2018 for on-source integrations of 0.75 h and 0.5 h under good weather conditions (). The FWHM of the primary beam at the observed frequency of 151.7 GHz (observed frequency of the CO(4-3) transition) is 16′′. We used the wobbler switching observing mode, with repeated 5 minute integrations consisting of twelve 25 second subscans (wobbler switching frequency of 0.5 Hz; azimuthal offset 40″). We recorded the EMIR E150 data with the fast Fourier Transform Spectrometre (FTS200) backend. Each observing session began with a strong calibration source for pointing and focus measurements. Pointings were assessed every 1.5 to 2 hours, with azimuth and elevation offsets typically within 2-3″. The data have been reduced with GILDAS in standard manner and the final spectra binned to 40 km s-1.
3 Results
3.1 Interferometric Observations with IRAM NOEMA
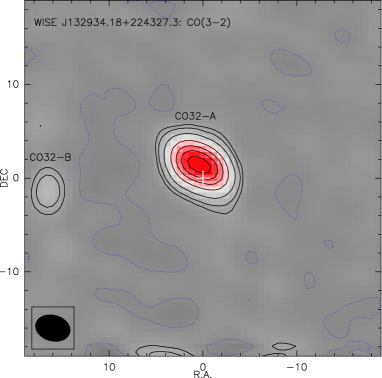
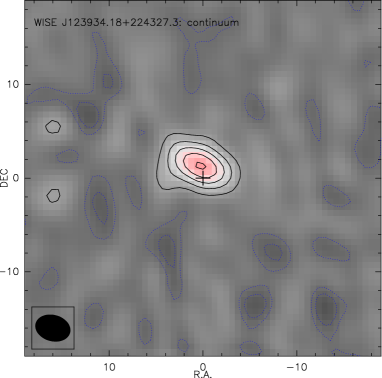
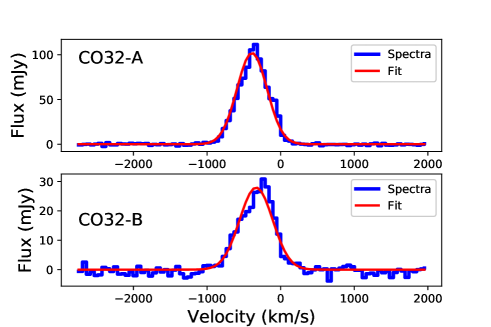
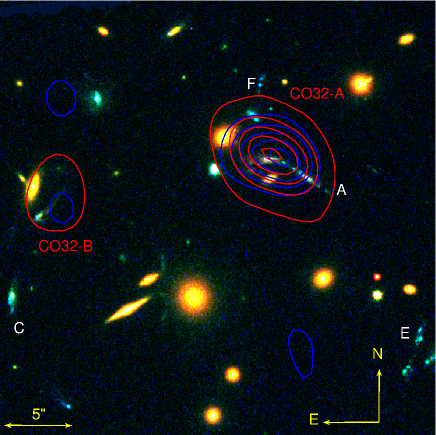
We detect a strong signal of the CO(3-2) line at 113.7 GHz yielding a spectroscopic redshift of . We reveal the molecular gas reservoir via this line at two positions, called CO32-A and CO32-B, separated by 165, see Fig. 1 and for details Table 1. 15 north away from the phase center, we obtain an impressive 50 sigma detection of the CO(3-2) line from CO32-A, I Jy km s-1 (top panel of Fig. 2), as strong as predicted by us and a factor of four brighter than the Cosmic Eyelash (Danielson et al., 2011). For the second component CO32-B we measure an integrated velocity intensity I Jy km s-1 (bottom panel of Fig. 2), taking into account the primary beam correction. We derive FWHMs of 481 (CO32-A) and 529 km s-1 (CO32-B) respectively, typical values for SMGs (e.g., Bothwell et al., 2013). The line profiles are symmetrical. Out of four families of background galaxies (see Fig. 1 in Díaz-Sánchez et al., 2017) within the NOEMA field of view, we detect A (CO32-A) and C (CO32-B) (only the member 1 of the C family has CO emission with an offset of ). In the data cubes we do not see any indication for rotation and outflows of the cold molecular gas in neither of the two components. CO32-A is consistent with the two arc-like rest-frame UV/optical sources 1 and 2 reported in Díaz-Sánchez et al. (2017), however closer to source 1, see Fig. 3. The second source CO32-B lies 165 south-east away from CO32-A. Interestingly, it is consistent with extended emission detected by WISE (see also Fig. 1 in Díaz-Sánchez et al., 2017). In the SCUBA-2 maps at 450 and 850 m we see hints for an extended emission towards this second CO source. The peak position of component CO32-B is consistent with an arc for which still no optical spectroscopic redshift exists. The velocity offset between the H and CO line for component CO32-A is km/s or which is consistent with typical offset values of several hundred km s-1 derived from CO (Bothwell et al., 2013; Chen et al., 2017) and H line observations (Swinbank et al., 2004; Alaghband-Zadeh et al., 2012; Chen et al., 2017) for SMGs. However, due to the coarse spatial resolution of the NOEMA CO data, we cannot exclude a composite object. We detect the dust continuum at rest-frame 870 m for component CO32-A mJy. The second source CO32-B is marginally seen in continuum (SmJy). There is a hint that the dust continuum emission of CO32-A could be extended (Fig. 1). However, due to the coarse beam we cannot measure the morphology of the cold ISM and compare them with the rest-frame UV/optical emission revealed through the HST imaging shown in Fig. 3. Higher resolution imaging is indispensable to confirm this possible feature. At the end, we note that similar to Danielson et al. (2011) for the Cosmic Eyelash, we did not detect any emission from the faint CS(7-6) line down to 3 (I Jy km s-1), deriving a flux ratio CS(7-6)/CO(3-2), about a factor 2 lower than measured for the Cosmic Eyelash (CS(7-6)/CO(3-2); Danielson et al., 2011).
| ID | R.A. | Decl. | zline | Frequency | ICO(3-2) | FWHM | SCO(3-2) | S |
|---|---|---|---|---|---|---|---|---|
| (J2000.0) | (J2000.0) | GHz | Jy km s-1 | km s-1 | mJy | mJy | ||
| CO32-A | 13:29:34.0570.001 | 22:43:26.920.01 | 113.747 | 52.20.9 | 4817 | 102.01.2 | 1.50.1 | |
| CO32-B | 13:29:35.2300.004 | 22:43:24.010.08 | 113.725 | 15.70.7 | 52917 | 28.00.8 | 0.60.2 |
| Telescope | line | zline | Frequency | Iline | FWHMline | |
|---|---|---|---|---|---|---|
| GHz | Jy km s-1 | km s-1 | ||||
| GBT | CO(1-0) | 2.040210.00014 | 37.915 | 5.71.4 | 44034 | |
| IRAM 30m | CO(4-3) | 2.040030.00006 | 151.656 | 95.414.3 | 49714 | |
| IRAM 30m | [CI]1-0 | 2.039940.00019 | 161.898 | 21.43.2 | 45041 |
3.2 Single Dish Observations — GBT and IRAM 30m
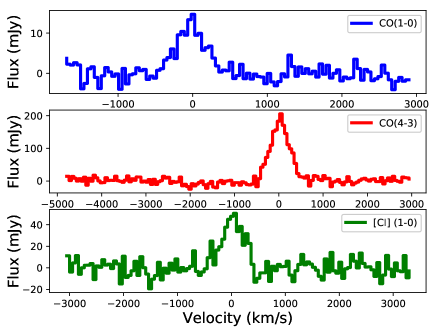
Both with the GBT and IRAM 30m we detect at high significance the targeted lines of CO(1-0), CO(4-3) and [CI] of component CO32-A, see Fig. 4 and Table 2. In both observations component CO32-B was not covered by the respective primary beam. We measure integrated velocities for the [CI](1-0) I Jy K km-1, CO(1-0) I Jy K km-1 and I Jy K km-1 transitions. Especially, the CO(4-3) and [CI] emissions are extremely bright, even taking lensing into account, see section 4 for a detailed discussion on this.
Strikingly, the derived spectroscopic redshifts from the different CO transitions are consistent within . Thus, the reported velocity offset km/s (3.1) between the rest-frame optical line H and the CO(3-2) from the NOEMA observations is real. Furthermore, the profiles and FWHMs of all four cold ISM tracers — [CI](1-0), CO(1-0), CO(3-2) and CO(4-3) — are very similar to each other: FWHM km s-1.
4 Discussion
4.1 General Remarks
We combine the interferometric and single dish observations to build-up the low-J CO SLED (spectral line energy distirbution) of the Cosmic Eyebrow up to . As the GBT and IRAM 30m observations do not cover component CO32-B, we will discuss and compare with the literature the CO SLED of the Cosmic Eyebrow based on component CO32-A. Based on the observations of the cold ISM including several CO transitions, [CI] and dust, we derive physical properties mainly of CO32-A, see Table 3. Whenever possible for completeness we derive physical properties for CO32-B as well, see Table 3. Due to the detection of two components in the far-infrared, we have split and recalculated the infrared luminosity into the two components — CO32-A and CO32-B. We determined an intrinsic rest-frame 81000 m luminosity, LIR of (1.10.1)1013 L⊙ for CO32-A and LIR of (6.80.3)1012 L⊙ for CO32-B, following Díaz-Sánchez et al. (2017).
The CO(3-2) and CO(4-3) transitions are already tracing the star-forming gas. The observed velocity-integrated intensity for these two transitions are extremely high. We will use both transitions in the following section to study in detail the cold ISM of this extremely bright CO source. We stress that due to additional single dish observations with the GBT and the IRAM 30 m telescope, we will estimate the complete cold molecular gas properly, — via CO(1-0) and [CI](1-0).
4.2 Lensing
We constructed the lens model with Lenstool (Kneib et al., 1993; Jullo et al., 2007) based on the HST ACS F606W image and with only a spectroscopic redshift for family A, see for details Díaz-Sánchez et al. (2017). Multi-object spectroscopic observations of a large number of possible images of our galaxy and background galaxies are needed in order to construct an accurate lens model. We do not have lens magnification factors derived for the submm continuum nor for the CO(1-0), thus we cannot say anything about potential differential lensing effects (Serjeant, 2012) that may distort this ratio, nevertheless in our preliminary lens model there are spatial magnification gradients in the source plane in the vicinity of the source.
We can expect that the CO(1-0) will trace even the most diffuse regions (see e.g., Emonts et al., 2016; Dannerbauer et al., 2017) of the galaxy, rather than the luminosity-weighted dust temperatures contributing to the observed infrared luminosity. Whereas for the infrared emission a slightly higher magnification is possible if it is on average closer to the caustic. The derived lens model from the optical/NIR data (Díaz-Sánchez et al., 2017) and the magnification factors (Table 3) are used for the cold ISM data as well. We are aware that differential lensing could play a role in our galaxy as in the Herschel and Planck detected source HATLAS J132527284452 at (Timmons et al., 2015) different magnification factors were derived for the star and dust components. However, our NOEMA data do not have the required resolution (to spatially resolve the source) in order to construct a reasonable lens model. With future high spatial resolution from NOEMA and/or ALMA we should be in a position to verify if differential lensing exists in our target.
4.3 Are the two CO components images of the same source?
The lensing magnification factor for the optical-NIR counterparts of CO32-A (sources 1 and 2 in the optical/near-infrared images) is . At the position of CO32-B we derive . Thus, within the errors the magnification factors at the positions of the CO(3-2) components are consistent. The CO(3-2) line profiles of both CO components of the Cosmic Eyebrow are very similar (Fig. 2). The frequency offset is 20 MHz which is consistent with the channel width we are using for our analysis. This could suggest that these two CO(3-2) images are from the same background source. However, the optical/near-infrared counterpart of CO32-A is a factor 2-3.5 brighter than CO32-B: the optical-NIR flux ratio is 2.2, the CO(3-2) is 3.6, the 3 mm continuum is 2.5 and WISE band 1/4 is 2.2/3.1. The magnification factor for the optical/near-infrared counterparts of CO32-B is not smaller than for CO32-A, indicating that the two CO(3-2) components could be different sources. However, between the optical-NIR and CO/mm components of CO32-B, we have an offset of 2-3′′, thus the amplification could be significantly different. High-resolution ALMA imaging is needed to reveal the configuration of this system.
4.4 Previous CO(3-2) detections of high-redshift sources
Due to not negligible uncertainties in the conversion of integrated CO fluxes from CO(3-2) into CO(1-0) (cf. Bothwell et al., 2013)222Only a handful of sources in this sample have CO(1-0) measurements., we decide to conduct our forthcoming analysis and comparison with the literature with observations of the same transition CO(3-2). Thus, we search the literature for CO(3-2) observations of intermediate- and high-redshift sources. Our literature sample consists of our reference source the Cosmic Eyelash (Danielson et al., 2011), Herschel (Riechers, 2013; Yang et al., 2017), Planck333We note that there is an overlap of four sources between the sample from Cañameras et al. (2015) and Harrington et al. (2016). As the measurements are not consistent in several cases (and no tendencies are seen), we decided to show the measurements from both studies. Cañameras et al. (2015) use the IRAM 30m telescope and Harrington et al. (2016) the LMT for their CO(3-2) measurements. (Cañameras et al., 2015; Harrington et al., 2016, 2018) and SPT444In the literature, we only find CO(3-2) observations with measured line flux and FWHM of one SPT-selected source, SPT031158 at (Strandet et al., 2017) selected lensed SMGs and non-lensed intermediate- and high-redshift ultraluminous infrared galaxies (ULIRGs) (Magdis et al., 2014), normal star-forming galaxies (SFGs) (Daddi et al., 2015; Arabsalmani et al., 2018) and SMGs (Bothwell et al., 2013).
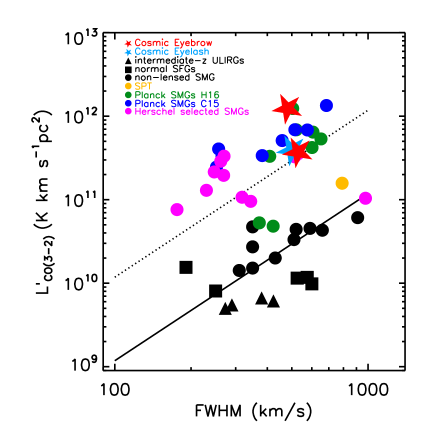
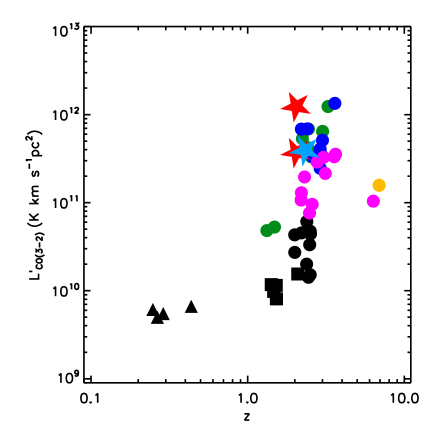
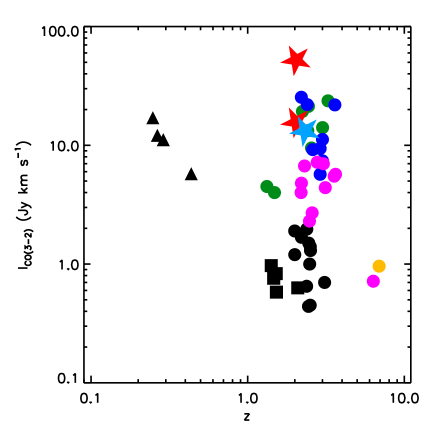
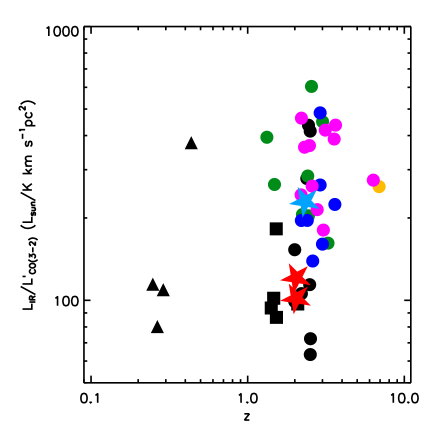
The component CO32-A of the Cosmic Eyebrow has the largest velocity-integrated flux ever detected in the CO(3-2) transitions for a high-redshift source (Fig. 5, 6 and 7). The observed L is the largest together with two other Planck-selected lensed SMGs, PJ160917.8 at (Harrington et al., 2018) and PLCK_G145.2+50.9 at (Cañameras et al., 2015), see Fig. 5. At redshift , the peak epoch of star-formation and black hole activity (e.g., Madau & Dickinson, 2014), the CO(3-2) luminosity of WISE J132934.18224327.3 is unseen (Fig. 6).
4.5 Molecular gas mass
The CO(1-0) line emission is optically thick and can be assumed to trace the spatial extent and bulk of molecular ISM gas mass. Thus, we derive the molecular gas mass directly from the CO(1-0) observations. Although there exists commonly used conversions between higher-J transition and CO(1-0) for SMG (Bothwell et al., 2013), the Cosmic Eyebrow is a good example that covering the lowest CO transitions (J2) is indispensable in order to obtain an accurate measurement of the total cold molecular gas mass (Fig. 8). The derived star-formation efficiency of our source (Fig. 9) suggests to use the CO luminosity to molecular gas-mass conversion factor M⊙ pc-2 (K km s, a commonly used value for merger-induced star-formation (Solomon & Vanden Bout, 2005). Including a factor of 1.36 to account for Helium, we derive M M⊙. We note that using the CO(3-2) velocity-integrated flux density, the molecular gas mass would have been overestimated by a factor of 2. The brightness ratio for SMGs is r (Bothwell et al., 2013), however the Cosmic Eyebrow is thermalized yielding to r (Table 3 and Fig. 8).
Both carbon fine structure emission lines, [CI](1-0) and [CI](2-1), have been proposed as molecular gas mass tracers (e.g., Weiß et al., 2003, 2005; Papadopoulos & Greve, 2004) due to their low-excitation requirements (23.6 K and 62.5 K energies above ground state). Neutral carbon is easily influenced by turbulent mixing, such that the relative neutral carbon distribution remains constant in various ISM environments (Xie et al., 1995).
The abundance is often assumed in other studies when lacking low-J CO measurements in order to derive the M(H2) Weiß et al. (e.g., 2003) via the atomic to molecular weight ratio of M(CI)/M(H2). Here we derive the X(CI)/X(H2) abundance by first using Eq. 2 from Weiß et al. (2005) to compute the total neutral carbon gas mass M M⊙, assuming a neutral carbon excitation temperature of T K. The excitation temperature only changes the total carbon mass significantly when T K (see Weiß et al., 2005). We assume the upper limit carbon excitation temperature, T K, in the sample of QSO/SMGs from Walter et al. (2011) because of the extreme nature of the Cosmic Eyebrow. The velocity-integrated [CI](1-0) flux of roughly 21 Jy km s-1 is 5 that of the strongly lensed Cloverleaf QSO (Weiß et al., 2005), which is amongst the brightest on average in the high-z universe (Walter et al., 2011; Alaghband-Zadeh et al., 2013; Bothwell et al., 2017). The thermalized low-J CO line ratios suggests the higher value of 35 K is appropriate to assume in this system. The independent CO(1-0) derived H2 mass (assuming an 0.8), provides an abundance of M M — which is comparable to the value of 4 found in nearby galaxies, and within the lower value found in the average carbon abundance of X([CI])/X(H2)= 8.5 3.5 in Walter et al. (2011). This implies a strong carbon enrichment in this system (Weiß et al., 2005) at .
Using the SCUBA-2 measurement of S mJy () from Jones (2015) including both CO components, and our NOEMA 3 mm continuum measurement of 1.5 mJy () of CO32-A, we are able to derive a range for the molecular ISM mass using the empirical calibration of long wavelength thermal dust emission to total gas mass, as presented in Scoville et al. (2014, 2016, 2017). We adopt a dust temperature, T TK, which is 3 K less than the luminosity-weighted dust temperature derived in the SED fit to the Cosmic Eyelash template (Díaz-Sánchez et al., 2017). The assumed colder dust temperature will trace more of the mass and will be easier to compare to the [CI](1-0) and CO(1-0) derived gas masses. T K is equal to the highest reasonable mass-weighted dust temperature suggested in Scoville et al. (2016). We would not expect much lower dust temperatures given an intrinsic far-IR luminosity more than log(LIR/L⊙) (magnification factor ; Díaz-Sánchez et al., 2017).
With fixed Td and the observed dust continuum, we use Eq. 16 in Scoville 2016 to derive M M⊙ from the observed 850 for the total Cosmic Eyebrow system, and M M⊙ for component CO32-A from the observed 3 mm. Assuming the IR-luminosity ratio of 2.8 between CO32-A and CO32-B to separate the SCUBA-2 flux at 850 m, see also Table 3, we obtain M M⊙ from the observed 850 . The empirically calibrated equation holds for . As the rest wavelength from the observed 850 measurement is almost exactly , our 3mm continuum measurement can be used to exclusively trace the total ISM mass via longer-wavelength thermal dust emission. We note that the restricted stellar mass range, M M⊙, used to calibrate the long-wavelength dust continuum to total gas mass is appropriate, as our MAGPHYS (da Cunha et al., 2012) derived stellar mass (for the optical/near-infrared counterparts source 1 and 2 in Díaz-Sánchez et al., 2017) corrected for amplification is at the upper limit: M M⊙ (Díaz-Sánchez et al., 2017).
Using only the 850 flux for CO32-A would suggest decreasing the neutral carbon metallicity to a value of roughly X(CI)/X(H2) (keeping everything else fixed from our assumptions above). This is unlikely for the expected rapid build up of heavy metals during the starburst phase within the Cosmic Eyebrow. Additionally, the ISM mass derived from only the 850 m photometry would suggest an higher when comparing to our CO(1-0) derived gas mass. We conclude that there are likely two dominant molecular gas phases (with separate ), as seen in local ULIRGs (e.g., Liu et al., 2017), and that other studies such as multi-J CO and [CI] non-LTE radiative analysis are required for further clarification.
To summarize, most of the gas mass measures suggest a cold molecular gas mass of M M☉ for component CO32-A and that applying the conversion factor typical for merger induced starburst is reasonable for our source.
4.6 Properties of the Cosmic Eyebrow
4.6.1 Morphology
The astrometric calibration of the HST data was done with stars from SDSS. The error is 007 and the astrometry of the NOEMA dataset is based on the radio frame. The offset between the CO(3-2) position and the rest-frame optical source 1 is 021 (see Fig. 3) and within the position uncertainty of 03 of the NOEMA detection. Furthermore, the NOEMA synthesized beam at the observed frequency has a size of is at 113.6 GHz. Due to the obtained spatial resolution, we cannot establish the geometry of the rest-frame UV/optical neither of the cold molecular gas components, e.g., we cannot rule out that there exists an offset between the millimeter emission and the rest-frame optical emission even from the rest-frame UV/optical source 1 (reported in Díaz-Sánchez et al., 2017).
At a marginal level we detect extended dust emission for CO32-A (Fig. 1). Confirming this possible feature555We note that decorrelation on the longer NOEMA baselines may cause this feature as well. with higher resolution mm-imaging would be a very interesting and surprising result as recent ALMA observations of a few SMGs from the ALESS survey (e.g., Hodge et al., 2013; Karim et al., 2013) show that the dust continuum is about a factor of two to five smaller than the cold molecular gas reservoir (Chen et al., 2017; Calistro-Rivera et al., 2018)
There is no sign of a double-horn rotation feature and in the NOEMA data cube we did not detect any rotation. With the current spatial resolution from the NOEMA observations of about , however, we cannot rule out the possibility of a late stage merger event where the rotation of both galaxies would blend into one single gaussian (Engel et al., 2010).
4.6.2 Star-formation efficiency
The derived star-formation efficiency SFESFR/L L☉/(K km s-1 pc2) for the Cosmic Eyebrow is at the lower end expected for high-z, merger-triggered star-formation but the gas depletion of 60 Myr (Fig. 9) is consistent with high-z starburst activity. This star-formation mode is strengthened by the gas fraction Mmol/M, a value expected for starbursts at redshift , see e.g. Fig. 6 in Dannerbauer et al. (2017). The relation described in Whitaker et al. (2012) predicts the star-formation rate of a main-sequence galaxy SFR M⊙ yr-1, the derived lensing corrected SFR M⊙ yr-1 for CO-32A is a factor higher.
4.6.3 CO spectral line energy distribution
The CO SLED of WISE J132934.18224327.3 is thermalized even up to CO(4-3), see Fig. 8. It deviates significantly from the Cosmic Eyelash (Danielson et al., 2011), the average non-lensed SMG (Bothwell et al., 2013), and the average lensed SMG (selected from the SPT survey Spilker et al., 2014) — the former both are similar —, resembling high-z QSOs (Carilli & Walter, 2013). The CO SLED of the Cosmic Eyebrorw. Although the selection is based on the optical to far-infrared SED of the Cosmic Eyelash, a typical SMG, the CO SLED is completely different. Up to CO(3-2), QSOs and hybrid SMGs/QSOs are thermalized as well (Sharon et al., 2016). Strikingly, the CO(4-3) transition makes the difference. We note that our source is seen in the VLA survey FIRST (S mJy; Becker et al., 1994) indicating AGN activity. Thus, the radio can help to distingush between AGN and starburst dominated sources. Harrington et al. (2018) presented the low-J CO observations of seven Planck and Herschel selected sources. None of the sources with shows such a behaviour as P13292243 although this source is selected from Planck data as well. PJ160917.8 (Harrington et al., 2018) has a similar apparent L as the Cosmic Eyebrow however its CO SLED resembles rather typical SMGs which are dominated by starburst activity. Unfortunately, for lensed SMGs selected from Planck by Cañameras et al. (2015) no CO SLEDs are published, especially the CO(1-0) transition is missing.
4.6.4 [CI] and CO brightness temperature relations
We derive L/L. This value is consistent within the lower bound of the average value of L/L derived for high-z sources such as SMGs and QSOs in Walter et al. (2011). It is closer to the value of L/L found in local and nearby galactic systems (Gerin & Phillips, 2000), while the [CI] to CO(1-0) ratio is higher than in the Milky Way (0.150.1; Fixsen et al., 1999). The derived L/L is comparable to the value 0.320.13 for high-z star-forming systems (Walter et al., 2011).
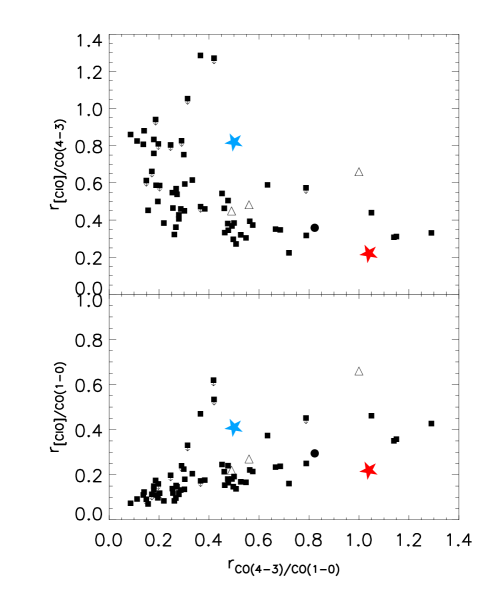
Including the CO(4-3) transition to the CO(1-0) and [CI](1-0) detections enables us to get more insight into the excitation conditions of the cold ISM of our source. We compare our source with low and high redshift sources from the literature (Danielson et al., 2011; Lestrade et al., 2010, 2011; Israel et al., 2015; Kamenetzky et al., 2016; Rosenberg et al., 2015; Emonts et al., 2018). As the molecular gas is thermalized at least to the CO(4-3) transition, we would expect a significant component of warmer gas to be associated with the low-excitation gas presented in this study.
In Fig. 10 we show that there is an extreme amount of CO luminosity compared to the [CI]. For such a short-lived starburst episode we expect that the gas will no longer be thermalized after the burst of star formation when conditions will be less intense. The r41 — brightness temperature ratio of the CO(4-3) and CO(1-0) transitions) — will decrease from unity and the [CI]/CO ratio will likely evolve towards the more populated parameter space once the gas supply is consumed.
4.6.5 CO line width-luminosity relation
We explore the relation between FWHM and L of the CO(3-2) line for our compiled sample from the literature. This relation was first proposed by Bothwell et al. (2013) for SMGs and then extended to normal SFGs at high-z in Dannerbauer et al. (2017). This relation can be used as an indicator to see if a high-z CO bright source could be strongly lensed or not (Harris et al., 2012; Aravena et al., 2016; Yang et al., 2017; Harrington et al., 2018). In Fig. 5, a segregation between lensed and non-lensed sources is clearly seen. Due to the dispersion of the relation between FWHM and L, it is not possible to calculate even approximate magnification factors as suggested previously by Harris et al. (2012) and Aravena et al. (2016). However, from Fig. 5 it is clear that our source has a strong magnification as predicted by our lens model.
5 Conclusion
In this work we present a detailed study of the cold ISM with IRAM NOEMA, GBT, and IRAM 30 m of an ultra-bright, lensed submillimeter galaxy at with extreme molecular gas properties. The main results are the following:
We have revealed the location of the SMG WISE J132934.18224327.3 at with IRAM NOEMA via CO(3-2) observations unambiguously and find two components, CO32-A and CO32-B. The derived flux ratios and magnification factors do not discard a two-component/merger-like system, however with the current low spatial resolution dataset in the mm-regime and the preliminary lens model, we cannot exclude that these two images are of the same source.
The determined redshifts and FWHMs of the four cold ISM line tracers [CI], CO(1-0), CO(3-2) and CO(4-3) are very similar.
In combination with single-dish observations from the GBT and IRAM 30 m telescope we have built up the CO SLED of component CO32-A of the Cosmic Eyebrow and show that the molecular gas is thermalized up to the CO(4-3) transition.
Based on the results derived from the CO SLED, we emphasize that to constrain the cold molecular gas mass, observations of low-J transitions are indispensable. Using suggested conversion for SMGs from e.g., CO(3-2) into CO(1-0) should be used with great caution.
We emphasize that the measured integrated velocity intensities for the CO(3-2), CO(4-3) and [CI(1-0)] transitions have been unseen so far in the early universe.
Our dataset enables us to measure the cold ISM of the Cosmic Eyebrow via two measures: CO(1-0) and dust continuum. Overall both methods suggest a cold molecular gas mass M M☉.
The gas depletion time of 60 Myr suggest a merger induced star-formation, strengthened by the measured infrared SFR and gas fraction.
The very high apparent flux brightness offers the opportunity to get new insights in the star-formation processes of high-z galaxies at the peak epoch of the star-formation and black hole activity in the universe. The Cosmic Eyebrow may become a new reference source at for galaxy evolution. Although the observed luminosity is exceptional large, only two other Planck-selected SMGs have this huge apparent CO-luminosity. Our work demonstrates that all-sky surveys are indispensable to find the brightest sources in the universe. In order to do a detailed study of the Cosmic Eyebrow including a lens model for the cold ISM, higher resolution, subarcsecond imaging with ALMA is needed, see e.g., Dye et al. (2015) and Swinbank et al. (2015). In addition, high-J CO line observations are indispensable to derive molecular gas properties such as gas density and excitation temperature.
| Property | Unit | CO32-A | CO32-B |
|---|---|---|---|
| zCO(3-2) | |||
| zHα | … | ||
| magnification factor | 2 | 3 | |
| L | 30.0 | … | |
| L | 2.2 | ||
| L | 4.0 | ||
| LIR | |||
| SFRIRa | M☉ yr-1 | ||
| Mmolb, based on CO(1-0) | 1011 M☉ | 13.2 | 4.1c |
| Mmol, based on dust measurements | 1011 M☉ | ||
| Mmol/M∗d | 0.44 | … | |
| SFECO(1-0) | ) | … | |
| SFECO(3-2) | ) | 120 | |
| Myr |
References
- Alaghband-Zadeh et al. (2012) Alaghband-Zadeh, S., Chapman, S. C., Swinbank, A. M., et al. 2012, MNRAS, 424, 2232
- Alaghband-Zadeh et al. (2013) Alaghband-Zadeh, S., Chapman, S. C., Swinbank, A. M., et al. 2013, MNRAS, 435, 1493
- Arabsalmani et al. (2018) Arabsalmani, M., Le Floc’h, E., Dannerbauer, H., et al. 2018, MNRAS, 476, 2332
- Aravena et al. (2016) Aravena, M., Spilker, J. S., Bethermin, M., et al. 2016, MNRAS, 457, 4406
- Becker et al. (1994) Becker, R. H., White, R. L., & Helfand, D. J. 1994, Astronomical Data Analysis Software and Systems III, 61, 165
- Béthermin et al. (2015) Béthermin, M., De Breuck, C., Sargent, M., & Daddi, E. 2015, A&A, 576, L9
- Blain (1996) Blain, A. W. 1996, MNRAS, 283, 1340
- Bothwell et al. (2013) Bothwell, M. S., Smail, I., Chapman, S. C., et al. 2013, MNRAS, 429, 3047
- Bothwell et al. (2017) Bothwell, M. S., Aguirre, J. E., Aravena, M., et al. 2017, MNRAS, 466, 2825
- Bournaud et al. (2014) Bournaud, F., Perret, V., Renaud, F., et al. 2014, ApJ, 780, 57
- Calistro-Rivera et al. (2018) Calistro Rivera, G., Hodge, J. A., Smail, I., et al. 2018, ApJ, 863, 56
- Cañameras et al. (2015) Cañameras, R., Nesvadba, N. P. H., Guery, D., et al. 2015, A&A, 581, A105
- Carilli & Walter (2013) Carilli, C. L., & Walter, F. 2013, ARA&A, 51, 105
- Carlstrom et al. (2011) Carlstrom, J. E., Ade, P. A. R., Aird, K. A., et al. 2011, PASP, 123, 568
- Carter et al. (2012) Carter, M., Lazareff, B., Maier, D., et al. 2012, A&A, 538, A89
- Casey et al. (2014) Casey, C. M., Narayanan, D., & Cooray, A. 2014, Phys. Rep., 541, 45
- Chen et al. (2017) Chen, C.-C., Hodge, J. A., Smail, I., et al. 2017, ApJ, 846, 108
- Cox et al. (2011) Cox, P., Krips, M., Neri, R., et al. 2011, ApJ, 740, 63
- da Cunha et al. (2012) da Cunha, E., Charlot, S., Dunne, L., Smith, D., & Rowlands, K. 2012, The Spectral Energy Distribution of Galaxies - SED 2011, 284, 292
- Daddi et al. (2004) Daddi, E., Cimatti, A., Renzini, A., et al. 2004, ApJ, 617, 746
- Daddi et al. (2015) Daddi, E., Dannerbauer, H., Liu, D., et al. 2015, A&A, 577, 46
- Danielson et al. (2011) Danielson, A. L. R., Swinbank, A. M., Smail, I., et al. 2011, MNRAS, 410, 1687
- Dannerbauer et al. (2009) Dannerbauer, H., Daddi, E., Riechers, D. A., et al. 2009, ApJ, 698, L178
- Dannerbauer et al. (2017) Dannerbauer, H., Lehnert, M. D., Emonts, B., et al. 2017, A&A, 608, A48
- Díaz-Sánchez et al. (2017) Díaz-Sánchez, A., Iglesias-Groth, S., Rebolo, R., & Dannerbauer, H. 2017, ApJ, 843, L22
- Dye et al. (2015) Dye, S., Furlanetto, C., Swinbank, A. M., et al. 2015, MNRAS, 452, 2258
- Eales et al. (2010) Eales, S., Dunne, L., Clements, D., et al. 2010, PASP, 122, 499
- Emonts et al. (2016) Emonts, B. H. C., Lehnert, M. D., Villar-Martín, M., et al. 2016, Science, 354, 1128
- Emonts et al. (2018) Emonts, B. H. C., Lehnert, M. D., Dannerbauer, H., et al. 2018, MNRAS, 477, L60
- Engel et al. (2010) Engel, H., Tacconi, L. J., Davies, R. I., et al. 2010, ApJ, 724, 233
- Fixsen et al. (1996) Fixsen, D. J., Cheng, E. S., Gales, J. M., et al. 1996, ApJ, 473, 576
- Fixsen et al. (1999) Fixsen, D. J., Bennett, C. L., & Mather, J. C. 1999, ApJ, 526, 207
- Flower et al. (1994) Flower, D. R., Le Bourlot, J., Pineau Des Forets, G., & Roueff, E. 1994, A&A, 282, 225
- Gerin & Phillips (2000) Gerin, M., & Phillips, T. G. 2000, ApJ, 537, 644
- Harrington et al. (2016) Harrington, K. C., Yun, M. S., Cybulski, R., et al. 2016, MNRAS, 458, 4383
- Harrington et al. (2018) Harrington, K. C., Yun, M. S., Magnelli, B., et al. 2018, MNRAS, 474, 3866
- Harris et al. (2012) Harris, A. I., Baker, A. J., Frayer, D. T., et al. 2012, ApJ, 752, 152
- Hodge et al. (2013) Hodge, J. A., Karim, A., Smail, I., et al. 2013, ApJ, 768, 91
- Karim et al. (2013) Karim, A., Swinbank, A. M., Hodge, J. A., et al. 2013, MNRAS, 432, 2
- Iglesias-Groth et al. (2017) Iglesias-Groth, S., Díaz-Sánchez, A., Rebolo, R., & Dannerbauer, H. 2017, MNRAS, 467, 330
- Israel et al. (2015) Israel, F. P., Rosenberg, M. J. F., & van der Werf, P. 2015, A&A, 578, A95
- Ivison et al. (2010) Ivison, R. J., Swinbank, A. M., Swinyard, B., et al. 2010, A&A, 518, L35
- Jones (2015) Jones, S. F. 2015, PhD thesis, Univ. Leicester, https://core.ac.uk/download/ pdf/42018134.pdf
- Jullo et al. (2007) Jullo, E., Kneib, J.-P., Limousin, M., et al. 2007, New Journal of Physics, 9, 447
- Kamenetzky et al. (2016) Kamenetzky, J., Rangwala, N., Glenn, J., Maloney, P. R., & Conley, A. 2016, ApJ, 829, 93
- Kennicutt (1998) Kennicutt, R. C., Jr. 1998, ARA&A, 36, 189
- Kneib et al. (1993) Kneib, J. P., Mellier, Y., Fort, B., & Mathez, G. 1993, A&A, 273, 367
- Lestrade et al. (2010) Lestrade, J.-F., Combes, F., Salomé, P., et al. 2010, A&A, 522, L4
- Lestrade et al. (2011) Lestrade, J.-F., Carilli, C. L., Thanjavur, K., et al. 2011, ApJ, 739, L30
- Liu et al. (2017) Liu, L., Weiß, A., Perez-Beaupuits, J. P., et al. 2017, ApJ, 846, 5
- Madau & Dickinson (2014) Madau, P., & Dickinson, M. 2014, ARA&A, 52, 415
- Magdis et al. (2014) Magdis, G. E., Rigopoulou, D., Hopwood, R., et al. 2014, ApJ, 796, 63
- Marganian et al. (2013) Marganian, P., Garwood, R. W., Braatz, J. A., Radziwill, N. M., & Maddalena, R. J. 2013, Astrophysics Source Code Library, ascl:1303.019
- McMahon et al. (2013) McMahon, R. G., Banerji, M., Gonzalez, E., et al. 2013, The Messenger, 154, 35
- Narayanan & Krumholz (2014) Narayanan, D., & Krumholz, M. R. 2014, MNRAS, 442, 1411
- Negrello et al. (2007) Negrello, M., Perrotta, F., González-Nuevo, J., et al. 2007, MNRAS, 377, 1557
- Negrello et al. (2010) Negrello, M., Hopwood, R., De Zotti, G., et al. 2010, Science, 330, 800
- Oguri et al. (2012) Oguri, M., Bayliss, M. B., Dahle, H., et al. 2012, MNRAS, 420, 3213
- Oliver et al. (2012) Oliver, S. J., Bock, J., Altieri, B., et al. 2012, MNRAS, 424, 1614
- Papadopoulos & Greve (2004) Papadopoulos, P. P., & Greve, T. R. 2004, ApJ, 615, L29
- Papadopoulos et al. (2012) Papadopoulos, P. P., van der Werf, P. P., Xilouris, E. M., et al. 2012, MNRAS, 426, 2601
- Planck Collaboration et al. (2011) Planck Collaboration, Ade, P. A. R., Aghanim, N., et al. 2011, A&A, 536, A1
- Planck Collaboration et al. (2014) Planck Collaboration, Ade, P. A. R., Aghanim, N., et al. 2014, A&A, 571, A16
- Pilbratt et al. (2010) Pilbratt, G. L., Riedinger, J. R., Passvogel, T., et al. 2010, A&A, 518, L1
- Riechers (2013) Riechers, D. A. 2013, Nature, 502, 459
- Rosenberg et al. (2015) Rosenberg, M. J. F., van der Werf, P. P., Aalto, S., et al. 2015, ApJ, 801, 72
- Scoville et al. (2014) Scoville, N., Aussel, H., Sheth, K., et al. 2014, ApJ, 783, 84
- Scoville et al. (2016) Scoville, N., Sheth, K., Aussel, H., et al. 2016, ApJ, 820, 83
- Scoville et al. (2017) Scoville, N., Lee, N., Vanden Bout, P., et al. 2017, ApJ, 837, 150
- Serjeant (2012) Serjeant, S. 2012, MNRAS, 424, 2429
- Sharon et al. (2016) Sharon, C. E., Riechers, D. A., Hodge, J., et al. 2016, ApJ, 827, 18
- Solomon & Vanden Bout (2005) Solomon, P. M., & Vanden Bout, P. A. 2005, ARA&A, 43, 677
- Spilker et al. (2014) Spilker, J. S., Marrone, D. P., Aguirre, J. E., et al. 2014, ApJ, 785, 149
- Strandet et al. (2017) Strandet, M. L., Weiss, A., De Breuck, C., et al. 2017, ApJ, 842, L15
- Swinbank et al. (2004) Swinbank, A. M., Smail, I., Chapman, S. C., et al. 2004, ApJ, 617, 64
- Swinbank et al. (2010) Swinbank, A. M., Smail, I., Longmore, S., et al. 2010, Nature, 464, 733
- Swinbank et al. (2015) Swinbank, A. M., Dye, S., Nightingale, J. W., et al. 2015, ApJ, 806, L17
- Tauber et al. (2010) Tauber, J. A., Mandolesi, N., Puget, J.-L., et al. 2010, A&A, 520, A1
- Timmons et al. (2015) Timmons, N., Cooray, A., Nayyeri, H., et al. 2015, ApJ, 805, 140
- Vieira et al. (2013) Vieira, J. D., Marrone, D. P., Chapman, S. C., et al. 2013, Nature, 495, 344
- Yang et al. (2017) Yang, C., Omont, A., Beelen, A., et al. 2017, A&A, 608, A144
- Walter et al. (2011) Walter, F., Weiß, A., Downes, D., Decarli, R., & Henkel, C. 2011, ApJ, 730, 18
- Weiß et al. (2003) Weiß, A., Henkel, C., Downes, D., & Walter, F. 2003, A&A, 409, L41
- Weiß et al. (2005) Weiß, A., Downes, D., Henkel, C., & Walter, F. 2005, A&A, 429, L25
- Whitaker et al. (2012) Whitaker, K. E., van Dokkum, P. G., Brammer, G., & Franx, M. 2012, ApJ, 754, L29
- Wright et al. (2010) Wright, E. L., Eisenhardt, P. R. M., Mainzer, A. K., et al. 2010, AJ, 140, 1868
- Xie et al. (1995) Xie, T., Allen, M., & Langer, W. D. 1995, ApJ, 440, 674