The impact of the environment on the early stages of radio source evolution
Abstract
Compact Symmetric Objects (CSOs) show radio features such as jets, lobes, hot spots that are contained within the central 1 kpc region of their host galaxy. Thus, they are thought to be among the progenitors of large-scale radio galaxies. A debate on whether the CSOs are compact primarily because they are young or because they are surrounded by a dense medium impacting their expansion is ongoing. Until now, attempts to discriminate between the environmental and genuine youthfulness scenarios have been inconclusive. We present a study of three CSOs selected on the basis of their puzzling X-ray absorbing properties in prior Beppo-SAX and/or Chandra X-ray Observatory data. Our new XMM-Newton observations unambiguously confirm the nature of their X-ray absorbers. Furthermore, for the first time, our X-ray data reveal the existence of a population of CSOs with intrinsic hydrogen column density cm-2 that is different from the population of X-ray unabsorbed CSOs. The two groups appear to be separated in the linear size vs. radio power plane. This finding suggests that a dense medium in X-ray obscured CSOs may be able to confine the radio jets. Alternatively, X-ray obscured CSOs could be seen as radio brighter than their unobscured counterparts either because they reside in a dense environment or because they have larger jet powers. Our results help constrain the origin of the X-ray emission and the location and size of the X-ray obscurer in CSOs, and indicate that the environment may play a key role during the initial expansion of a radio source.
Subject headings:
X-rays: galaxies – galaxies: active – galaxies: jets – galaxies: evolution1. Introduction
Giga-Hertz Peaked-Spectrum (GPS) radio sources are characterized by a spectral turn-over at the Giga-Hertz frequencies, and compact sub-kpc scale radio structures (e.g. review in O’Dea 1998). A sub-class of Compact Symmetric Objects (CSOs) is identified by symmetric double radio structures with the radio intensity dominated by lobes or hot spots. These features are also typically observed in large-scale radio galaxies, but in the CSOs they are contained within the central 1 kpc region of the host galaxy. Because by definition CSOs are expected to be observed in the direction nearly perpendicular to the radio jet axis, the observed emission is not affected by beaming. Thus, their linear radio size can be translated into the source kinematic age if one measures the advance velocity of the hot spots. Multiple studies show that the CSOs radio structures may be very young, years old (e.g. Gugliucci et al. 2005; see also An & Baan 2012, and references therein).
The reasons for the CSO compactness are still debated. Fanti et al. (1990) observed an anti-correlation between the radio turn-over frequency and linear radio size in radio galaxies with linear sizes kpc. This finding, along with CSO radio morphologies resembling miniature versions of those seen in the FRI/FRII galaxies (Fanaroff & Riley 1974) led to the formulation of an evolutionary scenario in which CSOs are the young counterparts of large scale radio sources (e.g. O’Dea 1998; Snellen et al. 2003; Kunert-Bajraszewska et al. 2010). However, there is also increasing observational evidence in favor of the confinement scenario, in which the CSOs cannot expand freely because they reside in a dense environment (e.g. van Breugel 1984; Bicknell et al. 1997; Callingham et al. 2015; Tingay et al. 2015). In particular, recent radio monitoring of CSOs provide observational evidence in favor of the existence of clouds with a complex density distribution in some sources (Tingay et al. 2015; Callingham et al. 2015, 2017).
| # | Source | RA | DEC | Date | Exposurea |
|---|---|---|---|---|---|
| PN/ MOS1/ MOS2 | |||||
| [ks] | |||||
| 1 | 2021+614 | 20 22 06.682 | 61 36 58.79 | 2016-05-25 | 24.5/ 30.6/ 36.0 |
| 2 | 193463 | 19 39 25.027 | 63 42 45.61 | 2017-04-01 | 22.8/ 27.3/ 27.9 |
| 3 | 1946+708 | 19 45 53.520 | 70 55 48.72 | 2016-10-21 | 18.1/ 24.9/ 26.3 |
NOTES: a Effective exposure after applying the standard filtering criteria.
| Parameter | Unit | 1934-63 | 1946+708 | 2021+614 | ||
|---|---|---|---|---|---|---|
| (1) | (2) | (3) | (4) | (5) | (6) | (7) |
| powerlaw | powerlaw | pexmon | mytorus | borus02 | ||
| Redshift | 0.183 | 0.101 | 0.227 | 0.227 | 0.227 | |
| cm-2 | 6.16 | 8.57 | 14.01 | 14.01 | 14.01 | |
| cm-2 | ||||||
| cm-2 | ||||||
| 1(f) | ||||||
| 0.5(f) | ||||||
| keV | 6.4(f) | 6.4(f) | 6.4(f) | |||
| keV | 0.2 | 0.2 | ||||
| erg s-1 cm-2 | ||||||
| erg s-1 | 0.6 | 1.2 | 10.8 | 11.2 | 9.5 | |
| 233 | 38 | 76 | 73 | 72 | ||
| d.o.f.d | 269 | 51 | 69 | 68 | 68 | |
NOTES: Errors represent 1 confidence intervals, except for and flux
for which we give 90% confidence interval uncertainties.
The cutoff energy was fixed at 100, 500, and 300 keV in models
presented in columns (5), (6) and (7), respectively, but this has
no impact on modeling the keV XMM-Newton data.
a Equivalent width of the Fe K emission line (PN) computed with respect
to the total continuum.
b Observed (not corrected for absorption) 2–10 keV (observed frame) flux (PN instrument).
c Intrinsic (corrected for absorption) 2–10 keV (rest frame) luminosity of the direct power law
(PN instrument).
d Degrees of freedom.
| # | Source | z | Size | Ref | NH(z) | X-ray | Ref | ||
|---|---|---|---|---|---|---|---|---|---|
| pc | W m-2 | (radio) | cm-2 | Observatory | (X-ray) | ||||
| (1) | (2) | (3) | (4) | (5) | (6) | (7) | (8) | (9) | (10) |
| 1 | 0035+227 | 0.096 | 31.3 | 24.75 | [1] | (1.7) | Chandra | [3] | |
| 2 | 0108+338 | 0.668 | 39.0 | 27.33 | [1] | (1.75) | XMM-Newton | [4] | |
| 3 | 0710+439 | 0.518 | 146 | 27.16 | [1] | Chandra | [3] | ||
| 4 | 1031+567 | 0.460 | 181.8 | 26.98 | [1] | (1.75) | XMM-Newton | [4] | |
| 5 | OQ+208 | 0.077 | 11.1 | 25.55 | [1] | 44-130 | XMM-Newton/Chandra/NuSTAR | [5] | |
| 6 | 1511+0518a | 0.084 | 7.3 | 24.98 | [1] | Chandra | [3] | ||
| 7 | 1607+26b | 0.473 | 290 | 27.18 | [1] | Chandra | [3] | ||
| 8 | 1718-649 | 0.014 | 2.8 | 24.34 | [1] | Chandra/XMM-Newton | [3, 6] | ||
| 9 | 1843+356 | 0.764 | 31 | 27.25 | [1] | (1.7) | Chandra | [3] | |
| 10 | 1934-63c | 0.181 | 128 | 26.79 | [1] | Chandra/XMM-Newton | This work | ||
| 11 | 1943+546 | 0.263 | 165 | 26.29 | [1] | (1.7) | Chandra | [3] | |
| 12 | 1946+708c | 0.101 | 57 | 25.21 | [1] | Chandra/XMM-Newton | This work | ||
| 13 | 2021+614 | 0.227 | 24.5 | 26.54 | [1] | Chandra/XMM-Newton | This work | ||
| 14 | 2351+495 | 0.238 | 179.2 | 26.41 | [1] | (1.75) | XMM-Newton | [4] | |
| 15 | 0029+3456 | 0.517 | 200 | 27.05 | [1] | XMM-Newton | [7] | ||
| 16 | 0048+3157 | 0.015 | 1.2 | 23.61 | [1] | XMM-Newton | [8] | ||
| 17 | 0431+2037 | 0.219 | 145.6 | 26.47 | [1] | XMM-Newton | [9] | ||
| 18 | 0503+0203 (1) | 0.584 | 66.5 | 27.45 | [1] | XMM-Newton | [7] | ||
| 0503+0203 (2) | 0.584 | 66.5 | 27.37 | [1] | XMM-Newton | [7] | |||
| 19 | 1148+5254 | 1.632 | 4.3 | 21.88 | [1] | XMM-Newton | [10] | ||
| 20 | J12201+2916 | 0.002 | 1.5 | 21.88 | [2] | Chandra/XMM-Newton | [11] | ||
| 21 | J12342+4753 | 0.372 | 80.8 | 26.09 | [2] | Chandra | [12] | ||
| 22 | 1256+5652 | 0.042 | 56.0 | 24.24 | [1] | XMM-Newton | [8] | ||
| 23 | J13262+3154 | 0.368 | 285.4 | 26.95 | [2] | XMM-Newton | [9] | ||
| 24 | 1400+6210 | 0.431 | 218 | 26.80 | [9] | XMM-Newton | [9] |
NOTES: a Compton thick candidate (S16). b reported to be Compton thick in XMM-Newton data (Tengstrandt et al. 2009). Much better quality Chandra data revealed that the source is unabsorbed. c reported to be CT in Beppo-SAX data (Risaliti et al. 2003). Much better quality Chandra data revealed that the source is unabsorbed.References: [1] References in An & Baan 2012, [2] Tremblay et al. (2016), [3] S16, [4] Vink et al. (2006), [5] Sobolewska et al. (2018), [6] Beuchert et al. (2018), [7] Guainazzi et al. (2006), [8] Singh et al. (2011), [9] Tengstrandt et al. (2009), [10] Young, Elvis & Risaliti (2009), [11] Younes et al. (2010), [12] Green et al. (2009).
X-ray observations have the potential to resolve this puzzle because the host galaxy environment can be studied in the X-ray band via direct measurements of both the interstellar medium (ISM) temperature and the total equivalent hydrogen column density, , along the line of sight (see Siemiginowska et al. 2008; Siemiginowska 2009; Tengstrand et al. 2009 for reviews on X-ray emission of GPS sources). In Siemiginowska et al. (2016; hereafter S16) we presented the first X-ray study of a sample that included all CSOs with redshift and measured kinematic ages known by 2010 (16 sources; 6 of them we observed with Chandra111Chandra X-ray Observatory for the first time in X-rays). The majority of the observations were short, but indicated a diverse environment and moderate column densities. Radio surveys continue providing new CSO kinematic age estimates, and new CSOs and CSO candidate identifications (e.g. An & Baan 2012; Tremblay et al. 2016).
S16 found that the majority of CSOs observed in X-rays show moderate or little intrinsic X-ray absorption (i.e. hydrogen equivalent column density of cm-2). However, observations of a few sources suggested that they have a complex X-ray spectrum with a heterogeneous absorbing medium and required high quality data for detailed studies of their emission and absorption properties. In particular, the X-ray spectrum of OQ208 observed with XMM-Newton (Guainazzi et al. 2004), and Chandra and NuSTAR (Sobolewska et al. 2018) is dominated by emission reflected from neutral matter. The direct power law emission is intrinsically absorbed with a column density of cm-2 (Sobolewska et al. 2018). Thus, OQ208 resembles an archetypal highly obscured, possibly Compton thick AGN.
Vink et al. (2006) reported significant amount of intrinsic X-ray absorption in the XMM-Newton spectrum of another CSO, 0108388 ( cm-2 for the photon index fixed at ). Singh, Shastri & Risaliti (2011) found that XMM-Newton data of 00483157 required three intrinsic absorbers with a range of hydrogen column densities; in particular, a partial coverer with cm-2. Risaliti et al. (2003) reported a Compton thick absorption in two CSO sources studied with Beppo-SAX: 193463 and 1946708. However, these two sources appeared Compton thin in the Chandra observations of S16. Similarly, 160726 was classified as a Compton thick source in an XMM-Newton observation with poor S/N ratio (Tengstrand et al. 2009), while S16 found cm-2 in a deeper 40 ks Chandra observation. Finally, in S16 we reported a photon index of –1.0 in 15110518 and 2021614, which is unusually hard for non-beamed sources. Both sources were flagged as Compton thick CSO candidates.
We observed with XMM-Newton the two CSOs with prior Beppo-SAX and Chandra data (193463 and 1946708) and one of the two Compton thick candidates identified in S16 (2021614). Our goal was to constrain the presence of any line emission attributable to Fe K originating from the locations of these three sources, constrain their X-ray absorption properties, and study any underlying correlations between the radio size, radio power, and CSO environment.
In this paper we present the results of our new XMM-Newton observations. We discuss the current status of X-ray absorption measurements in the S16 CSO sample, and the implications for the environment and initial expansion of radio sources.
2. Observations
Table 1 contains the details of our XMM-Newton observations. We present the data obtained with the EPIC instruments. We used the standard XMM-Newton pipeline products (PPS event lists processed with SAS v.15.0 for 2021614 and 1946708, and SAS v.16.0 for 193463). We applied the standard screening of the events, excluding the periods of flaring particle background. The resulted clean exposure times for each source are listed in Table 1. We note that the high background rates impacted approximately half of the originally scheduled exposure of 54 ks for 2021614.
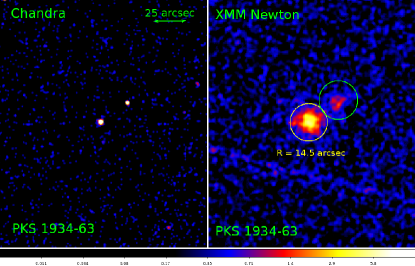
Our previous 20 ks Chandra observation revealed a background X-ray source 25″ away from 193463 in the NW direction (Fig. 1, top/left; S16). This source is also visible in our XMM-Newton image. Thus, we chose 14.5″ and 15″ extraction regions for 193463 and the secondary source, respectively, to avoid mutual flux contamination. There are no contaminating sources in the other two CSOs and the standard circular regions with the radius of 24″ were used for extracting spectra of 2021614 and 1946708.
We fitted simultaneously the EPIC PN, MOS1 and MOS2 spectra using XSPEC v12.9.1s (Arnaud 1996).
3. Results
Our XMM-Newton observations enabled us to refine the intrinsic X-ray absorption measurements of our targets. We confirm that, in agreement with our prior Chandra observations (S16), the X-ray spectra of 193463 and 1946708 can be described with a power law model modified by absorption, , where is the photo-electric cross-section and and are the Galactic and intrinsic X-ray absorbing columns, respectively (phabs and zphabs XSPEC models). We detected only a mild intrinsic X-ray absorbing hydrogen column in both sources. By contrast, we show that 2021614, a source reported to be a Compton thick candidate in S16, is indeed absorbed due to a significant intrinsic hydrogen column density. Parameters of our best fitting X-ray spectral models are listed in Table 2 and the modeling details are given below.
3.1. 193463
We detected an X-ray source adjacent to 193463 in both Chandra and XMM-Newton images (Fig. 1, top). We were not able to model the Chandra X-ray spectrum of the secondary source due to a low ratio.
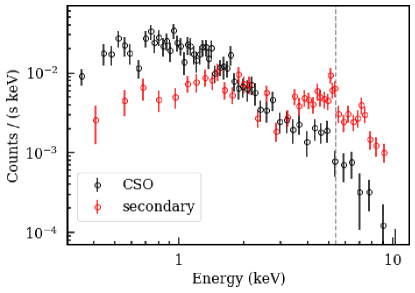
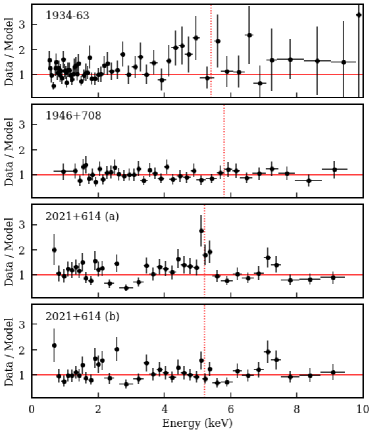
In Fig. 1, bottom, we plot the EPIC PN spectra for the CSO and the secondary source. This comparison shows that the iron emission originates from the secondary source, while the XMM-Newton spectrum of the CSO is modeled well with an intrinsically absorbed power law (Tab. 2; see Fig. 2 for the data to model ratio). Although the XMM-Newton data of the CSO appear to contain a hint of iron emission at keV (rest frame), we only find an upper limit on the line’s equivalent width, keV (90% confidence level). We conclude that the two sources were blended in the Beppo-SAX observation reported by Risaliti et al. (2003) and this led to the incorrect suggestion that 193463 may contain a Compton thick obscurer. Here we derived cm-2 for 193463, consistent with our Chandra result (c.f. S16).
3.2. 1946708
XMM-Newton data are consistent with our prior Chandra data (S16) and indicate that 1946708 is not a Compton thick source. No nearby secondary X-ray sources are seen in our data. The source flux in our observations is comparable (within a factor of 2) with the flux reported by Risaliti et al. (2003) based on the Beppo-SAX data. Thus, we can now rule out a scenario considered in S16 in which the source switches between the Compton thick and Compton thin states on time scales of several years. We conclude that, most likely, the marginal detection of an iron line emission in the Beppo-SAX data that prompted the Compton thick interpretation was a false positive. In our XMM-Newton data the 90% confidence level on the equivalent width of the 6.4 keV line at the redshift of the source is keV. With the much better quality XMM-Newton and Chandra data it is evident that the source is only mildly intrinsically absorbed ( cm-2; Tab. 2; Fig. 2).
3.3. 2021614
Application of an intrinsically absorbed power law model to the XMM-Newton spectrum of 2021614 confirmed the unusually hard photon index seen previously in our Chandra data (S16). In addition, we observed residuals near the region corresponding to the rest frame 6.4 keV energy, suggestive of the presence of the Fe K fluorescent line emission (Fig. 2; line emission was not required by our Chandra data, most likely due to low S/N ratio at energies keV). When we added a Gaussian line to the model, we obtained the rest frame energy of the line keV, equivalent width keV, , and for 69 degrees of freedom. The apparent hard photon index and the detection of the Fe K line suggest strong intrinsic obscuration in this source.
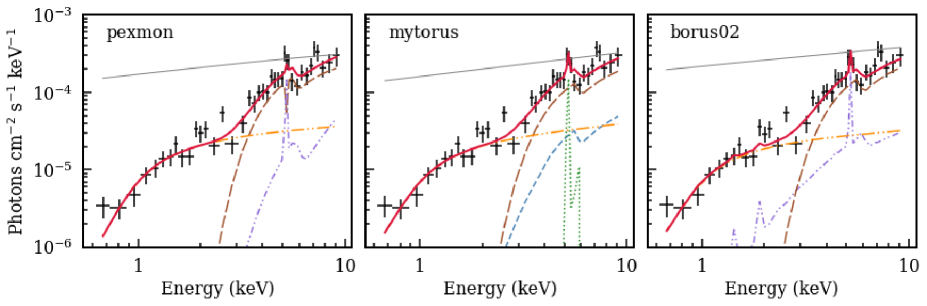
To verify this, we constructed a model consisting of an intrinsically absorbed power law and its reflection from a neutral matter in the slab geometry (pexmon; Nandra et al. 2007) with the Fe K emission computed self consistently. However, this model was not able to provide a good fit to the data for a range of typical AGN photon indices (e.g. Del Moro et al. 2017; Corral et al. 2011). Thus, we added a contribution from the direct power law that is scattered into the line-of-sight, rather than absorbed, by the obscuring material, and dominates the spectrum at energies below 3 keV. The total model was given by , with the second intrinsic absorber modifying only the pexmon component. Note that with our choice of the reflection amplitude, , fixed at 1, the pexmon component stands for the combination of the direct cutoffpl and reflected continuum, including the line emission. The photon indices and normalizations of the scattered cutoffpl and pexmon components were linked to each other, and the cut-off energy was fixed at 100 keV. We obtained a very good fit with for 67 degrees of freedom, , and two intrinsic absorbing columns of the order of cm-2 and cm-2 (Fig. 3, left; Tab. 2, col. (5)). The ratio of the scattered and direct power law normalizations was rather high, (e.g. Ueda et al. 2007; Marchesi et al. 2018).
Finally, we explored two models of a toroidal reprocessor (mytorus, Yaqoob 2012; borus02, Baloković et al. 2018). The key difference between these two models is the flexibility of the borus02 model to fit for the torus covering factor, , fixed at 0.5 in the mytorus model. The total model was defined as , with being the zeroth-order continuum given by Yaqoob (2012). We used the relevant reflected and line emission table models provided by Yaqoob (2012) and Baloković et al. (2018) to express the torus component. In both cases the line-of-sight column density was tied to the average toroidal column density. The inclination angle was fixed at 80∘ since the CSO sources are believed to be viewed edge on, through the obscuring torus, given the symmetricity of their radio structures and underlying assumption that the jet axis is perpendicular to the plane of the torus. We introduced a normalization constant following Yaqoob 2012 who argue that the flexibility in modeling the relative normalizations of the scattered and line emission is required in order to account for effects such as a deviation from a perfect toroidal geometry, a range of covering factors, etc. It was a fit parameter in the mytorus model () and it was fixed at 1 (by construction) in the borus02 model. We found good fits for both toroidal models, and the resulting model parameters were consistent between the two approaches (Fig. 3, middle/right; Tab. 2, cols. (6-7)). Fit parameters of the toroidal models were consistent with those of the pexmon model. The toroidal models result in the de-absorbed 2–10 keV rest frame luminosity of the order of 1044 erg s-1, while the slab geometry model gives erg s-1.
Models presented in Tab. 2, cols. (5–7) are statistically equivalent given the current data, and result in the ratio of the data to model of comparable quality and energy dependence (illustrated in the bottom panel in Fig. 2). However, all these models imply that the nuclear X-ray emission of 2021614 is seen through a matter with high intrinsic X-ray absorbing column, cm-2, and another intrinsic absorber with of the order of 1021 cm-2.
3.4. Sub-population of X-ray absorbed CSOs
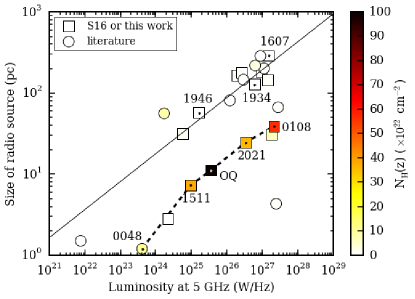
In Tab. 3 and Fig. 4 we combined information on the intrinsic X-ray absorption in CSOs, CSO radio power at 5 GHz, and radio source linear size. We stress that sources in Tab. 3 represent all currently known CSOs observed both in the radio and X-ray bands. We used the radio data provided by Tremblay et al. (2016), and for sources from An & Baan (2012) we derived the 5 GHz radio power from their spectral index, , and 4.8 GHz flux as , where is the luminosity distance to the source assuming WMAP9 cosmology (Hinshaw et al. 2013). The X-ray exposures are relatively deep, with 8 sources observed for ks, 11 sources observed for 9–30 ks and only 5 sources observed for 2–5 ks.
We found that intrinsically X-ray unabsorbed and X-ray absorbed CSOs ( cm-2 and cm-2, respectively) appear to be separated in the size of the radio source vs. 5 GHz luminosity plane (Fig. 4). In general, the former cluster around the relation reported by Tremblay et al. (2016; see also Orienti & Dallacasa 2014), while the latter are located below this correlation. To estimate the statistical significance of this separation we performed two 1-dimensional 2-sample Kolmogorov-Smirnov (K-S) tests with respect to the CSO radio luminosity and radio size. The results suggest that while we cannot reject the hypothesis that the radio luminosities of the two samples come from the same distribution ( and -), the radio sizes of the two samples most do not come from the same distributions at a significance level % ( and -). This would support our conclusion that the obscured and unobscured sources appear to have different radio sizes.
On the other hand, a 2-dimensional 2-sample K-S test should be used in the statistical verification of our results (e.g. Peacock 1983; Frasano & Franceschini 1987). However, this test requires that the size of each sample is larger than . This condition is not met by our current data as we have only 5 obscured CSOs. The 2-dimensional 2-sample K-S test can be successfully performed in the future, when X-ray data become available for an extended CSO sample. Nevertheless, for our current unabsorbed and absorbed samples the 2-dimensional 2-sample K-S test results in and , which, if confirmed with future data, would suggest that at 98% confidence level the low- and high- CSOs occupy different regions in the radio size vs. radio luminosity plane.
We conclude that our data are suggestive of the first observational evidence in the X-ray band for a statistically significant separation in the CSO population with respect to the density of the CSO environment, as measured through the intrinsic equivalent hydrogen column density, and radio properties such as the source size, and perhaps also source radio luminosity.
4. Discussion
We observed three Compton thick CSO candidates with XMM-Newton and were able to refute the presence of a Compton thick absorber in 193463 and 1946708, and detect a significant intrinsic X-ray absorbing column in 2021614. The X-ray spectrum of 2021614 shows that the intrinsic X-ray power law is strongly attenuated and it is seen primarily in a reflection from a neutral matter. In particular, the detection of the 6.4 keV iron emission line accompanying the reflection continuum indicates that 2021614 is not a beamed source (c.f. Giommi et al. 2007 and D’Abrusco et al. 2014 who classified the source as a blazar). Our findings are in agreement with the results of Barter et al. (1984) who reported on strong reddening in the optical spectroscopic observations of 2021614 performed with the Multiple Mirror Telescope.
We note that the best-fit photon indexes of the power law models applied to the X-ray spectra of these three CSOs cover a range of –2 (Tab. 2). Thus, it is likely that different physical processes give rise to the intrinsic X-ray emission in these sources (e.g. inverse-Compton processes in expanding radio lobes, X-ray jet, X-ray corona).
We observed that the X-ray absorbed and unabsorbed CSOs appear to be separated in the radio size vs. 5 GHz radio luminosity plane (Fig. 4). We performed 1-dimensional 2-sample K-S tests with repspect to the radio properties, and found that the radio sizes of the absorbed and unabsorbed CSO samples could form two populations. In addition, the results of a 2-dimensional 2-sample K-S test confirmed a possible existence of such two populations. However, we caution that the 2-dimensional 2-sample K-S test requires a larger number of the absorbed sources (as least twice as many as in the current sample) to be valid.
Our results could be interpreted in two ways. It could be that the CSOs with a high intrinsic X-ray absorbing column, cm-2; 00483157, OQ208, 2021614, 1511518, 0108388) have less evolved radio structures (smaller linear radio size) than X-ray unabsorbed CSOs with the same 5 GHz radio power. Thus, the environment in which a radio source expands might be able to confine the source growth already at the earliest stages of its evolution. This would provide the first observational evidence in the X-ray band that some compact jets may be frustrated by a dense environment and their kinematic ages may be underestimated.
An alternative way of explaining the separation visible in Fig. 4 is that the X-ray obscured sources have higher radio luminosity than the X-ray unobscured sources for a given radio size. The two factors that drive radio luminosity for a given size of a radio source are environmental density and jet power. Thus, one possible explanation is that the X-ray obscured sources are brighter for a given size because they were born in a denser environment. Another option is that they are brighter than the unobscured CSOs with the same size because they have higher jet power, which is related to central density, through e.g. the accretion rate (e.g. Allen et al. 2006; Tchekhovskoy et al. 2011; Ghisellini et al. 2014), or directly as in the model of Stawarz et al. (2008).
Even though with the current data it is not possible to distinguish between these two explanations, we stress that in both cases the density of the CSO environment plays a key role. Moreover, our results rise a question about the origins of the X-ray emission and the location of the X-ray obscurer. If the CSO X-ray emission originates primarily from an active nucleus that becomes attenuated by obscuring material in the vicinity of the nucleus, then we should also see heavily obscured CSOs with larger radio structures. In contrast, the CSOs in our sample show low intrinsic X-ray absorption for the radio size exceeding a few tens of parsecs. If the CSO X-ray emission is dominated by inverse-Compton emission of the radio lobes (e.g. Stawarz et al. 2008; Ostorero et al. 2010), then the CSOs would become unobscured once their radio lobes expand beyond the region occupied by the dense material. Thus, it could be that the obscurer is located on scales smaller than a few tens of parsecs. Alternatively, the obscuring material could be destroyed or removed by the expanding radio source.
Recently, Ostorero et al. (2017) addressed the question of the relative location of the X-ray and radio absorbers in the CSOs. They confirmed a positive correlation between the total absorbing column density (, X-rays) and the neutral hydrogen column (, radio), originally found by Ostorero et al. (2010). The existence of such a correlation suggests that the gas responsible for the X-ray and radio absorption may be part of the same, possibly unsettled, hundred-parsec scale structure.
We note that there are three sources whose X-ray properties place them in the vicinity of the X-ray absorbed sources in Fig. 4 and/or significantly below the correlation reported by Tremblay et al. (2016). Yet, they appear to be X-ray unabsorbed with of the order of cm-2. We observed one of them with Chandra (1843356; W Hz-1, pc) for 5 ks and detected only counts. Thus, the measured intrinsic absorption is highly uncertain (S16). However, we should be able to robustly constrain both the and intrinsic in this source with the pending XMM-Newton observation. The two remaining sources display characteristics that are not typical to our CSO X-ray sample. PKS 1718649 ( W Hz-1, pc) is to date the only -ray emitting CSO (Migliori et al. 2016). While at , 11485254 (a.k.a. SDSS J114856.56+525425.2; W Hz-1, pc) is the only source in Fig. 4 with redshift above 1. Additionally, its radio data indicate a presence of a larger scale (older) emission not associated with the younger radio source (Tremblay et al. 2016; Young, Elvis & Risaliti 2009).
The CSOs constitute the youngest resolved radio structures and provide information on early stages of the radio source expansion, and its impact on the feedback between the evolution of a galactic environment and black hole growth. The future X-ray observations of a large number of the CSOs are necessary for a statistical verification of the trends observed in this work.
5. Conclusions
We studied the X-ray and radio properties of a sample of Compact Symmetric Objects. The sample included all currently identified CSOs with (1) X-ray spectral information obtained with Chandra and/or XMM-Newton, (2) morphological information on their compact radio structures, and (3) radio band spectral information. We considered a tree-dimensional parameter space with axes corresponding to the radio luminosity at 5 GHz, , radio source linear size, , and intrinsic X-ray hydrogen column density, . Our main findings are as follows.
-
•
Two CSOs, 193463 and 1946708, observed with XMM-Newton are only mildly X-ray obscured indicating that they are not Compton-thick sources (dismissing the original claim based on the lower-quality BeppoSAX data), while the third CSO, 2021614, is highly absorbed with the X-ray intrinsic column density of cm-2.
-
•
X-ray obscured and unobscured CSOs appear to occupy separate regions in the (, LS, ) parameter space.
-
•
One interpretation of the above separation is that X-ray absorbed CSOs have smaller radio sizes than X-ray unabsorbed CSOs. Alternatively, X-ray absorbed CSOs could be more radio luminous than X-ray unabsorbed CSOs with the same radio size.
-
•
We argued that in both cases the high density environment plays the key role: (1) High density ISM could prevent the radio source from expanding freely. (2) Radio source born in a dense environment would appear more radio luminous than a source born in low density environment, as a high density environment is able to sustain higher mass accretion rate onto a black hole than a low density environment. Consequently, jet power and hence radio luminosity increase with increasing mass accretion rate.
-
•
If X-ray emission originates in radio lobes, then our results place an upper limit on the distance of the high column density clouds from the center as we did not detect high intrinsic X-ray obscuration in CSOs with LS exceeding a few tens of parsecs.
Expanding our sample of X-ray CSOs is necessary in order to verify the statistical significance of the separation between the X-ray obscured and unobscured CSO in the radio power vs. radio size plane and draw important conclusions on the effect of the environment on the early evolution of the radio sources. Deep XMM-Newton exposures of 1511518 (Compton thick candidate identified in S16) and 1843356 would allow us to put more stringent constraints on the intrinsic X-ray absorbers in these sources. Excellent candidates for a follow-up X-ray study, with radio properties that place them near the emerging X-ray absorbed branch in Fig. 4, have been recently identified by An & Baan (2012) and Tremblay et al. (2016). Ongoing and future radio surveys will keep provide new CSO targets for X-ray follow-ups.
References
- (1) Allen, S. W., Dunn, R. J. H., Fabian, A. C., Taylor, G. B., & Reynolds, C. S. 2006, MNRAS, 372, 21
- (2) An, T., & Baan, W. A. 2012, ApJ, 760, 77
- (3) Arnaud, K. A. 1996, Astronomical Data Analysis Software and Systems V, 101, 17
- (4) Baloković, M., Brightman, M., Harrison, F. A., et al. 2018, ApJ, 854, 42
- (5) Beuchert, T., Rodríguez-Ardila, A., Moss, V. A., et al. 2018, A&A, 612, L4
- (6) Bicknell, G. V., Dopita, M. A., & O’Dea, C. P. O. 1997, ApJ, 485, 112
- (7) Callingham, J. R., Gaensler, B. M., Ekers, R. D., et al. 2015, ApJ, 809, 168
- (8) Callingham, J. R., Ekers, R. D., Gaensler, B. M., et al. 2017, ApJ, 836, 174
- (9) Corral, A., Della Ceca, R., Caccianiga, A., et al. 2011, A&A, 530, A42
- (10) D’Abrusco, R., Massaro, F., Paggi, A., et al. 2014, ApJS, 215, 14
- (11) Del Moro, A., Alexander, D. M., Aird, J. A., et al. 2017, ApJ, 849, 57
- (12) Fanaroff, B. L., & Riley, J. M. 1974, MNRAS, 167, 31P
- (13) Fanti, R., Fanti, C., Schilizzi, R. T., et al. 1990, A&A, 231, 333
- (14) Fasano, G., & Franceschini, A. 1987, MNRAS, 225, 155
- (15) Ghisellini, G., Tavecchio, F., Maraschi, L., Celotti, A., & Sbarrato, T. 2014, Nature, 515, 376
- (16) Giommi, P., Capalbi, M., Cavazzuti, E., et al. 2007, A&A, 468, 571
- (17) Green, P. J., Aldcroft, T. L., Richards, G. T., et al. 2009, ApJ, 690, 644
- (18) Guainazzi, M., Siemiginowska, A., Rodriguez-Pascual, P., & Stanghellini, C. 2004, A&A, 421, 461
- (19) Guainazzi, M., Siemiginowska, A., Stanghellini, C., et al. 2006, A&A, 446, 87
- (20) Gugliucci, N. E., Taylor, G. B., Peck, A. B., & Giroletti, M. 2005, ApJ, 622, 136
- (21) Hinshaw, G., Larson, D., Komatsu, E., et al. 2013, ApJS, 208, 19
- (22) Kunert-Bajraszewska, M., Gawroński, M. P., Labiano, A., & Siemiginowska, A. 2010, MNRAS, 408, 2261
- (23) Marchesi, S., Ajello, M., Marcotulli, L., et al. 2018, ApJ, 854, 49
- (24) Migliori, G., Siemiginowska, A., Sobolewska, M., et al. 2016, ApJ, 821, L31
- (25) Nandra, K., O’Neill, P. M., George, I. M., & Reeves, J. N. 2007, MNRAS, 382, 194
- (26) O’Dea, C. P. 1998, PASP, 110, 493
- (27) Orienti, M., & Dallacasa, D. 2014, MNRAS, 438, 463
- (28) Ostorero, L., Moderski, R., Stawarz, Ł., et al. 2010, ApJ, 715, 1071
- (29) Ostorero, L., Morganti, R., Diaferio, A., et al. 2017, ApJ, 849, 34
- (30) Peacock, J. A. 1983, MNRAS, 202, 615
- (31) Risaliti, G., Woltjer, L., & Salvati, M. 2003, A&A, 401, 895
- (32) Siemiginowska, A., LaMassa, S., Aldcroft, T. L., Bechtold, J., & Elvis, M. 2008, ApJ, 684, 811-821
- (33) Siemiginowska, A. 2009, Astronomische Nachrichten, 330, 264
- (34) Siemiginowska, A., Sobolewska, M., Migliori, G., et al. 2016, ApJ, 823, 57 (S16)
- (35) Sobolewska, M., Siemiginowska, A., Guainazzi, M., Hardcastle, M., Migliori, G., Ostorero, L., Stawarz, L. 2018, ApJ submitted
- (36) Singh, V., Shastri, P., & Risaliti, G. 2011, A&A, 532, A84
- (37) Snellen, I. A. G., Schilizzi, R. T., Miley, G. K., et al. 2000, MNRAS, 319, 445
- (38) Stawarz, Ł., Ostorero, L., Begelman, M. C., et al. 2008, ApJ, 680, 911
- (39) Tchekhovskoy, A., Narayan, R., & McKinney, J. C. 2011, MNRAS, 418, L79
- (40) Tengstrand, O., Guainazzi, M., Siemiginowska, A., et al. 2009, A&A, 501, 89
- (41) Tingay, S. J., Macquart, J.-P., Collier, J. D., et al. 2015, AJ, 149, 74
- (42) Tremblay, S. E., Taylor, G. B., Ortiz, A. A., et al. 2016, MNRAS, 459, 820
- (43) Ueda, Y., Eguchi, S., Terashima, Y., et al. 2007, ApJ, 664, L79
- (44) van Breugel, W., Miley, G., & Heckman, T. 1984, AJ, 89, 5
- (45) Vink, J., Snellen, I., Mack, K.-H., & Schilizzi, R. 2006, MNRAS, 367, 928
- (46) Yaqoob, T. 2012, MNRAS, 483, 3360
- (47) Younes, G., Porquet, D., Sabra, B., et al. 2010, A&A, 517, A33
- (48) Young, M., Elvis, M., & Risaliti, G. 2009, ApJS, 183, 17