11email: ducci@astro.uni-tuebingen.de 22institutetext: ISDC Data Center for Astrophysics, Université de Genève, 16 chemin d’Écogia, 1290 Versoix, Switzerland 33institutetext: NASA Marshall Space Flight Center, NSSTC, 320 Sparkman Drive, Huntsville, AL 35805, USA 44institutetext: Universities Space Research Association, NSSTC, 320 Sparkman Drive, Huntsville, AL 35805, USA 55institutetext: INAF – Osservatorio Astronomico di Brera, via Bianchi 46, 23807 Merate (LC), Italy 66institutetext: Warsaw University Observatory, Al. Ujazdowskie 4, PL-00-478 Warszawa, Poland
X-ray and optical monitoring of the December 2017 outburst of the Be/X-ray binary AX J0049.47323
AX J0049.47323 (SXP 756) is a Be/X-ray binary that shows an unusual and poorly understood optical variability that consists of periodic and bright optical outbursts, simultaneous with X-ray outbursts, characterised by a highly asymmetric profile. The periodicity of the outbursts is thought to correspond to the orbital period of the neutron star. To understand the peculiar behaviour shown by this source, we performed the first multi-wavelength monitoring campaign during the periastron passage of December 2017. The monitoring lasted for about 37 days and consisted of X-ray, near-ultraviolet, and optical data from the Neil Gehrels Swift Observatory, the optical band from the OGLE survey, and spectroscopic observations of the H line performed with the 3.9 m Anglo-Australian Telescope. These observations revealed AX J0049.47323 during an anomalous outburst having remarkably different properties compared to the previous ones. In the band, it showed a longer rise timescale ( days instead of 1–5 days) and a longer decay timescale. At the peak of the outburst, it showed a sudden increase in luminosity in the band, corresponding to the onset of the X-ray outburst. The monitoring of the H emission line showed a fast and highly variable profile composed of three peaks with variable reciprocal brightness. To our knowledge, this is the second observation of a variable three-peak H profile of a Be/X-ray binary, after A0535+26. We interpreted these results as a circumstellar disc warped by tidal interactions with the neutron star in a high eccentricity orbit during its periastron passage. The fast jump in optical luminosity at the peak of the outburst and the previous asymmetric outbursts might be caused by the reprocessing of the X-ray photons in the circumstellar disc or the tidal displacement of a large amount of material from the circumstellar disc or the outer layers of the donor star during the periastron passage of the neutron star, which led to an increase in size of the region emitting in the band. Further multi-wavelength observations are necessary to discriminate among the different scenarios proposed to explain the puzzling optical and X-ray properties of AX J0049.47323.
Key Words.:
accretion – stars: neutron – X-rays: binaries – X-rays: individuals: AX J0049.47323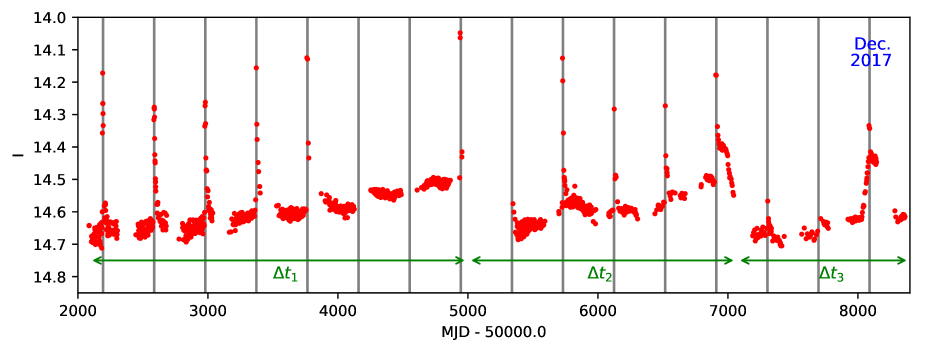
1 Introduction
Be/X-ray binaries (Be/XRBs, see Reig 2011 for a review) usually contain a neutron star (NS) or, rarely, a black hole (Casares et al. 2014 and e.g. Brown et al. 2018) accreting material from an early-type Oe-Be star. Oe-Be stars are O-B type stars of luminosity class III-V which, at some stages in their lives, show emission lines in their spectra (mostly in the Balmer and Paschen series) and an enhanced infrared (IR) radiation called IR excess (Waters, 1989). These features in their spectra are produced in a disc of dense gas lying on the equatorial plane of the donor star, called the circumstellar disc. The best-studied emission line of Be stars is the H line. Its morphology and variability give fundamental information about the structure, orientation, and evolution of the circumstellar disc (see e.g. Hanuschik et al. 1995 and Rivinius et al. 2013 for a recent review).
The optical luminosity of Be/XRBs is dominated by the radiation coming from the surface of the Be star and the circumstellar disc (e.g. van Paradijs 1998). Usually, their optical light curves show super-orbital ( d) irregular or quasi-periodic variability, with typical amplitudes in the band of , which are believed to be related to the formation and depletion of the circumstellar disc (Rajoelimanana et al. 2011, Reig & Fabregat 2015 and references therein). The variability characteristics differ from source to source. They depend not only on the intrinsic properties of each source, but also on the orientation of the circumstellar disc with respect to the line of sight (e.g. Haubois et al. 2012). A small fraction of Be/XRBs shows orbital periodicities with amplitudes . This variability is usually ascribed to perturbations of the circumstellar disc produced by the orbiting NS. Some Be/XRBs show a fast rise-exponential decay (FRED) profile, which in some cases is associated with the orbital period. Bird et al. (2012) proposed using the ‘FRED-iness’ of these profiles as an indicator to distinguish between orbital periods and other mechanisms like aliased radial and non-radial pulsations and long-term variability of the circumstellar disc. Despite the efforts and the valuable results obtained so far, a detailed model to explain the mechanism producing the FRED orbital modulation observed in some Be/XRBs is still missing.
As the name suggests, the main observational property that characterises the class of Be/XRBs is their bright X-ray emission. It is caused by the accretion of the dense material of the circumstellar disc on the compact object (Maraschi et al., 1976). These episodes of high accretion are sporadic, can last several weeks, and can reach X-ray luminosities of erg s-1 (e.g. Reig 2011; Townsend et al. 2017). Based on observations and theoretical models, it has recently been argued that the primary properties of the X-ray outbursts observed in most of Be/XRBs (e.g. the point of their onset along the orbit, their duration, the outburst rates, the X-ray luminosity and its variability) depend on the complicated interaction between the compact object and the circumstellar disc, whose structure can on some occasions deviate significantly from a symmetric geometry (Laplace et al., 2017; Negueruela et al., 2001; Reig et al., 2007; Moritani et al., 2013; Martin et al., 2011, 2014a, 2014b; Okazaki et al., 2002). To understand the properties of the optical and X-ray outbursts and the mechanisms which trigger them, it is of great importance to collect information about the gas outflow from the Be star of these binary systems through multi-wavelength observations in X-ray and optical bands.
One of the few remarkable exceptions to the typical low-amplitude variability observed in Be/XRBs is AX J0049.47323 (SXP 756), which shows relatively short ( days), bright (), and periodic outbursts ( d Schmidtke et al. 2013) that are simultaneous with X-ray outbursts, with a periodicity that is thought to correspond to the orbital period of the system (Cowley & Schmidtke, 2003; Coe & Edge, 2004; Laycock et al., 2005; Galache et al., 2008). AX J0049.47323 is located in the Small Magellanic Cloud (SMC) and is composed of a s pulsar (Yokogawa et al., 2000) orbiting around a O9.5-B0.5 III-V star (Edge & Coe, 2003; McBride et al., 2008). The photometric light curves based on the data from the MAssive Compact Halo Object Project (MACHO, Alcock et al. 1997) and the Optical Gravitational Lensing Experiment (OGLE, Sect. 2.3) of AX J0049.47323 presented by Rajoelimanana et al. (2011) showed that the amplitude of the outbursts vary and their peak luminosities increase with the optical emission between outbursts (hereafter basal emission). MACHO light curves in the and bands show that AX J0049.47323 becomes redder during most outbursts, suggesting that the emitting region gets cooler (Cowley & Schmidtke, 2003). The optical light curve folded at the orbital period shows a sharp and asymmetric peak ( d), making it one of the best examples of a FRED profile (Rajoelimanana et al., 2011; Bird et al., 2012; Coe & Edge, 2004). Cowley & Schmidtke (2003) found a quasi-periodic variability in the optical band of AX J0049.47323, on a timescale of d. They suggested that the observed modulation might be associated with the rotation of the disc of the Be star. Then Coe & Edge (2004) proposed that the d periodicity might be induced by the periastron passage of the NS which disturbs the geometry of the circumstellar disc. Schmidtke et al. (2013) proposed that the d signal might actually be an alias produced by a signal at d. The light curve folded at this latter period shows a sinusoidal modulation, which is consistent with the expected optical variability due to non-radial pulsation of a Be star.
A spectroscopic study of the donor star of AX J0049.47323 carried out during an optical outburst (on 2001 November 6-12), showed a double-peaked H emission profile, indicating the presence of a circumstellar disc not observed face-on (Edge & Coe, 2003). The optical outburst was accompanied by an X-ray outburst detected by RXTE (Coe & Edge, 2004; Ducci et al., 2018).
Since its discovery, AX J0049.47323 has been observed in X-rays with several satellites. As mentioned above, it shows periodic X-ray outbursts with peak luminosities of erg s-1 which are in phase with the optical outbursts, thought to occur near periastron (Coe & Edge, 2004; Laycock et al., 2005; Galache et al., 2008). AX J0049.47323 shows high X-ray variability along the orbit, spanning more than three orders of magnitude, with high luminosity states ( erg s-1) far from periastron, and possibly two cases of anomalous fast variability (Ducci et al., 2018). The enhanced X-ray luminosity observed far from periastron during some orbital cycles might be due to the NS experiencing long periods of high accretion rate all along its orbit, likely caused by an extended and warped circumstellar disc or some other unknown mechanism (Coe & Edge, 2004; Ducci et al., 2018).
The optical and X-ray variability of AX J0049.47323 is unusual and still poorly understood. Therefore, we planned a monitoring campaign at different wavelengths, performed during the last outburst of December 2017, to investigate it more thoroughly. We made use of X-ray data from the Neil Gehrels Swift Observatory (Swift), simultaneously with spectroscopic and photometric observations in optical/UV bands with the Anglo-Australian Telescope (AAT) and Swift/UVOT, especially focused on the study of the variability of the H line, which provided with us important information about the properties of the circumstellar disc surrounding the system. In addition, we used the data from the OGLE survey collected over the last 17 years (Fig. 2). The results of these observations are presented in Sect. 3 and discussed in Sect. 4.
2 Data analysis
2.1 Swift
Table 1 shows the log of the Swift (Gehrels et al., 2004) observations analysed in this paper. These data were obtained as a monitoring program of 12 observations carried out near the expected outburst, based on the ephemeris calculated by Schmidtke et al. (2013). We processed and analysed X-ray Telescope (XRT, Burrows et al. 2005) data using the standard software (FTOOLS111https://heasarc.gsfc.nasa.gov/docs/software/lheasoft/ftools/ v6.24) and calibration (CALDB222https://heasarc.gsfc.nasa.gov/docs/heasarc/caldb/caldb_intro.html 20180411). XRT data were processed and filtered using xrtpipeline (v0.13.4). Source events were extracted from a circular region with a radius of 10 pixels (1 pixel = 2.36′′), while the background was extracted from an annular region centred at the source position, with an inner radius of 30 pixels and an external radius of 70 pixels. The data were not affected by pile-up. The XRT light curve was corrected for point spread function losses, vignetting, and then background subctracted. Ancillary response files were created with the task xrtmkarf. The spectrum was extracted from all the datasets (except for the last observation, where the source was not detected) of Table 1 combined and analysed using xspec (v12.10.0c, Arnaud 1996).
The UV/Optical Telescope (UVOT, Roming et al. 2005) observed AX J0049.47323 simultaneously with XRT, using six filters: ( Å, Å, Å, Å, Å, Å). The data analysis was performed using the tasks uvotimsum and uvotsource. To calculate the magnitude, we adopted a circular region with radius of centred on the source position and a circular region with a radius of for the background.
2.2 Anglo-Australian Telescope
Three optical spectroscopic observations of AX J0049.47323 were performed with the 3.9 m Anglo-Australian Telescope (AAT) during the nights of 2017 November 26, December 5, and 2018 January 3. Observations were carried out with the High Efficiency and Resolution Multi-Element Spectrograph (HERMES, Sheinis 2016). HERMES is a four-channel fibre-fed spectrograph with high resolution (R=) and multi-object capability, sensitive in the range nm. The source was observed with a sec of good exposure time and a arcsec slit width. All runs were performed with the line/mm cross-dispersing grating. Each channel has individual CCD cameras, each of , of the E2V family with m pixels, operating at about K. We reduced all data using a standard 2drfr software package333https://www.aao.gov.au/science/software/2dfdr dedicated to reducing HERMES data, and standard Image Reduction and Analysis Facility (IRAF)444iraf.noao.edu packages (version 2.16). Images were bias- and flatfield-corrected, and wavelength calibration using arc lamp spectra (thorium-argon) was applied.
2.3 OGLE
OGLE is a photometric sky survey that began in April 1992 (Udalski et al., 2015). It monitors regularly the Galactic Bulge, part of the Galactic disc, and the Magellanic Clouds, and it provides photometry in the band with uncertainties of about mag for the SMC fields (an analysis of the OGLE errors can be found in Skowron et al. 2016). During the first phase (1992–1995), the main goal of the project was the detection of gravitational microlensing events to constrain the nature of dark matter (e.g. Paczynski 1986). However, thanks to the constant monitoring of about a billion stars, OGLE proved to be a useful project for the study of numerous other physical phenomena. These include the study of the optical variability of Be/XRBs (Rajoelimanana et al. 2011; Bird et al. 2012; Schmidtke et al. 2013). The photometric data used in this paper have been retrieved from the OGLE III and IV X-ray variables OGLE monitoring (XROM, Udalski 2008) web sites555http://ogle.astrouw.edu.pl/ogle3/xrom/xrom.html 666http://ogle.astrouw.edu.pl/ogle4/xrom/xrom.html and have been corrected to the standard -band system.
| ObsID | Start time (UT) | End time (UT) | Exp. |
|---|---|---|---|
| (s) | |||
| 00010380001 | 2017-11-27 08:23:08 | 2017-11-27 13:29:52 | 4947 |
| 00010380002 | 2017-11-28 22:29:48 | 2017-11-29 01:54:21 | 1978 |
| 00010380004 | 2017-11-30 01:51:00 | 2017-11-30 01:59:54 | 534 |
| 00010380005 | 2017-12-01 08:09:58 | 2017-12-01 08:27:53 | 1076 |
| 00010380006 | 2017-12-02 11:12:03 | 2017-12-02 19:30:52 | 7023 |
| 00010380007 | 2017-12-03 11:09:51 | 2017-12-03 11:26:54 | 1023 |
| 00010380008 | 2017-12-04 01:27:31 | 2017-12-04 01:45:52 | 1101 |
| 00010380009 | 2017-12-05 12:23:38 | 2017-12-05 23:59:54 | 1086 |
| 00010380010 | 2017-12-07 08:58:56 | 2017-12-07 23:33:53 | 6609 |
| 00010380012 | 2017-12-10 05:44:59 | 2017-12-10 15:26:53 | 1667 |
| 00010380013 | 2017-12-12 02:12:12 | 2017-12-12 05:37:54 | 1617 |
| 00010380014 | 2017-12-28 02:49:50 | 2017-12-28 07:51:54 | 1259 |

3 Results
3.1 Optical photometry
Figure 1 shows that the optical outbursts observed in the OGLE survey are superimposed on three epochs of gradual brightening of the basal emission ( MJD; MJD; MJD). From the outburst at MJD, the main features characterising the optical variability of AX J0049.47323 changed significantly. The most important new pieces of information after this event emerging from Fig. 1 are the following:
-
•
the decay tail of the outburst observed at MJD is much longer ( days) than those previously observed and its shape is also peculiar as it shows a hump during the decay phase;
-
•
after this anomalous outburst, the basal luminosity decreased to , i.e. about 0.15 magnitudes fainter than the magnitude prior to the outburst. Since then, and until the last outburst, AX J0049.47323 showed a rebrightening of the basal emission similar to that previously observed;
-
•
in the two successive orbital cycles, the amplitude of the optical outbursts were much lower than in the past. The shape of the alleged outburst during the second cycle was peculiar; it was similar to a step. However, it is important to note that there is a gap of about 24 days in the data at the expected peak position;
-
•
The last outburst of Fig. 1, which peaks at MJD, shows a longer rise timescale (about 60 days) compared to the previous ones (the outbursts with more frequent sampling show a rise time of about 2–5 days) and also a longer decay timescale. The lack of data between MJD and MJD does not allow us to estimate its duration. Despite this gap of data, we note that the decay phase of this outburst shows a peculiar hump, already observed in the bright outburst observed at MJD.
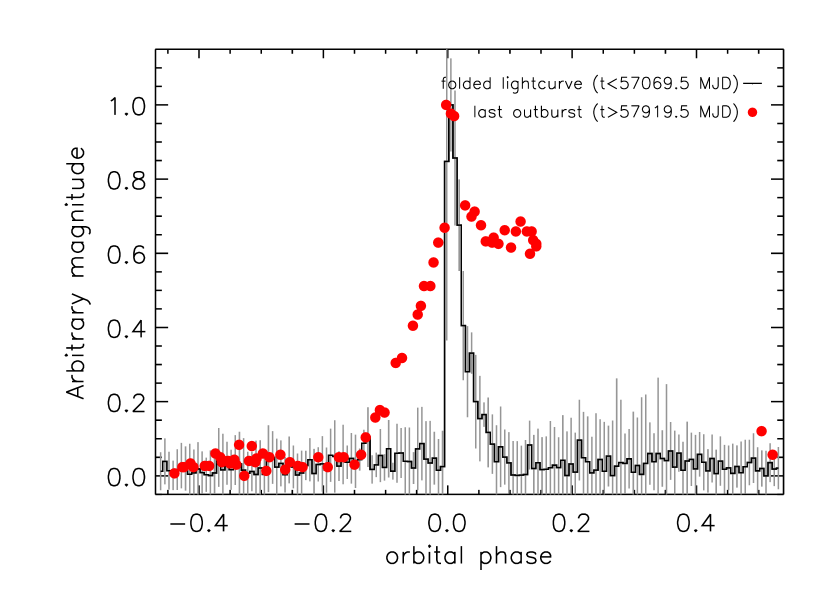
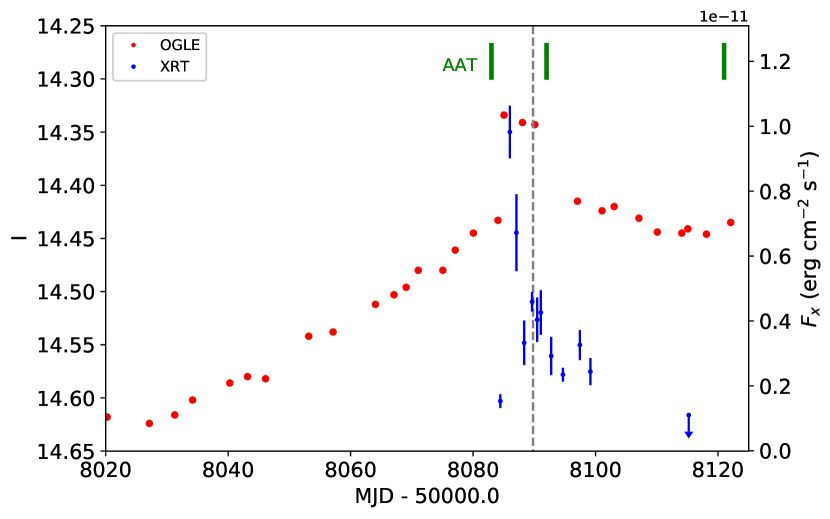
The anomalous shape of the December 2017 ( 58090 MJD) outburst is highlighted in Fig. 2, where it is compared to the FRED profile of the OGLE light curve folded on the 393.1 d period. We created the folded light curve from the detrended OGLE light curve obtained from two polynomial functions (three orders each, in the ranges and ) fitted to the OGLE data where the periods of the outbursts were removed, and then subtracted from the complete light curve, i.e. the one which includes the outbursts. Figure 3 shows that during the December 2017 outburst, the -band luminosity of AX J0049.47323 increased almost constantly up to MJD, where the source showed a sudden increase in the luminosity that was simultaneous (within 1 day) with the onset of the X-ray outburst observed by Swift/XRT.
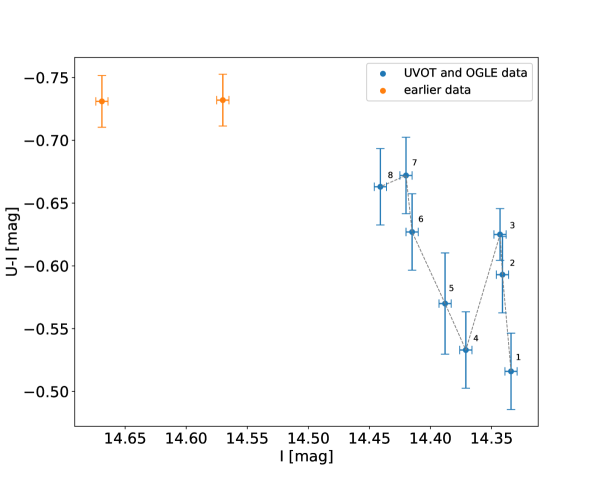
Figure 4 shows the colour-magnitude diagram versus obtained from the UVOT and OGLE data of the last outburst (blue, see Fig. 5) and of two previous observations carried out far from periastron (yellow: MJD; MJD, corresponding to the orbital phases and ; these two measurements were reported in Ducci et al. 2018). The magnitudes of Fig. 4 corresponding to the points 4, 5, and 7, were obtained from interpolation. The plot shows that the source reddens when it goes in outburst and it cools during the outburst. This behaviour was previously observed by Cowley & Schmidtke (2003) in AX J0049.47323 using , , and magnitudes provided by the MACHO and OGLE-II survey, and it was explained with a brightening of the circumstellar disc during the outburst.
3.2 Swift/XRT
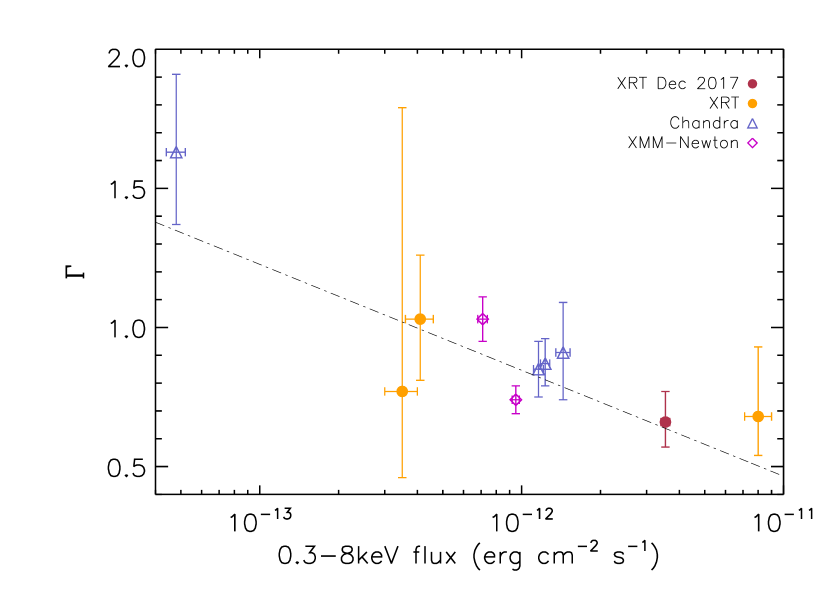
The average XRT spectrum during the outburst can be well fitted (, 41 d.o.f.) with an absorbed ( cm-2; calculated using tbabs model in xspec, Wilms et al. 2000) power law (). The parameters of the fit are listed in Table 2, and the average spectrum is shown in Fig. 6 (all errors quoted at the 1 confidence level). Ducci et al. (2018) showed an anti-correlation between and the flux using previous X-ray observations of AX J0049.47323. Considering the new measure shown in Table 2, we increased the significance of this anti-correlation: the Pearson’s linear coefficient becomes and the null hypothesis probability in the space is %. The spectral slope softens at lower fluxes following the relation , where the errors are quoted at the 1 confidence level. The anti-correlation between and the flux including the new Swift/XRT observation is shown in Fig. 7.
3.3 H emission line
The H line was observed three times, at the peak of the December 2017 outburst and during the fading phase, for about 40 days. The line profiles are shown in Fig. 8. Dealing with double-peaked profiles, the equivalent width (EW) was calculated using the splot task of IRAF, which employs the method of direct integration of the flux across the feature. Moreover, double-peaked profiles have also been fitted using the deblending routine available in IRAF. The three peaks have been modelled with three Voigt functions, which fitted the line wings better than Gaussian functions, returning line centres and intensities of the three peaks above the continuum. By these, we calculated the separation between the red and blue peaks . Following the methodology of Reig et al. (2010) and Malacaria et al. (2017), to derive the H line spectral parameters we iterated the fitting procedure twelve times for each double-peaked feature and sampled, at each iteration, a slightly different point of the continuum (whose definition is the main source of uncertainty during this process). Final values and errors of line parameters were calculated as the average and standard deviation over those iterated measures. The equivalent width and the separation between red and blue peaks of each observation are given in Table 3. The H line showed a high variability and a peculiar shape in all three observations. In particular, during observation A, carried out slightly before the peak of the outburst (see Fig. 1), the H profile showed a three-peak profile with a narrow central peak and two side peaks of about the same height (). Nine days later (observation B), when the optical emission from the source was fading, the H profile changed significantly: its intensity increased, and the height of the red peak became higher than the blue peak (). The observed variability could be due to density perturbations in the circumstellar disc caused by the NS or to one-armed disc oscillations of the circumstellar disc similar to those observed in other Be stars (see e.g. Rivinius et al. 2013 and references therein). In observation C, carried out about one month later, when AX J0049.47323 was much fainter in the band and not detected in X-ray, the H profile still shows a relatively high intensity compared to observation B and especially observation A. The height of the blue and red peaks was much lower compared to the central peak (they almost disappeared).
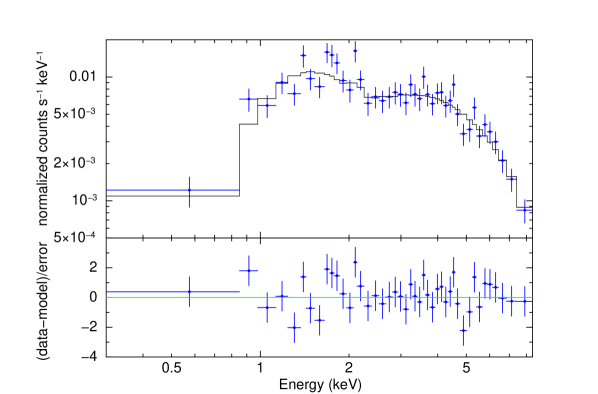
| Parameter | Value |
|---|---|
| cm-2 | |
| (d.o.f.) | 1.160 (41) |
| absorbed flux | |
| unabsorbed flux |
Notes: fluxes are in units of erg cm-2 s-1 in the 0.38 keV energy range. Errors are quoted at the confidence level.
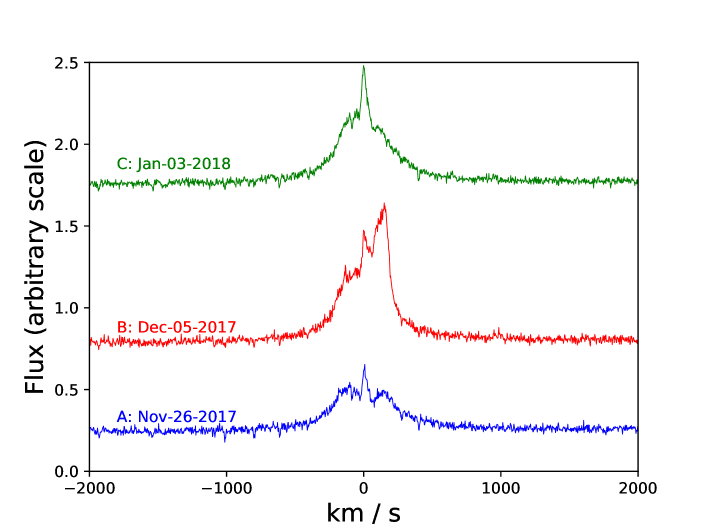
| Obs. | Date | ||
|---|---|---|---|
| [Å] | [km s-1] | ||
| A | 2017-Nov-26 | ||
| B | 2017-Dec-05 | ||
| C | 2018-Jan-03 |
4 Discussion
In Sect. 3.1 we showed that AX J0049.47323 experienced a change in its optical properties after the outburst observed at MJD. The decrease in the magnitude after this outburst and the low amplitude of the two subsequent outbursts compared to the previous ones displayed by the system, might be due to a rapid depletion of the circumstellar disc (likely triggered by the tidal interaction with the NS) which then slowly formed again. Unfortunately, the binary system was not observed at other wavelengths during the anomalous outburst of MJD and the lack of H observations during and immediately after that event prevents us from testing our hypothesis.
The multi-wavelength monitoring campaign of AX J0049.47323 carried out in December 2017 revealed an anomalous outburst whose optical emission was characterised by rise and decay timescales longer than in the previous outbursts. As shown in Fig. 2, the outburst did not show the distinctive FRED profile observed in the past. The rise of the outburst can be divided in two parts. In the first part the flux increases slowly, starting from MJD (corresponding to the phase in Fig. 2) and rising to MJD. The rise timescale of this part of the outburst is relatively fast compared to the typical timescales of the formation of circumstellar discs in Be/XRBs (see e.g. Haubois et al. 2012), but it is roughly consistent with those seen in some of them (e.g. Kızıloǧlu et al. 2009; Rajoelimanana et al. 2011). We suggest that it might be due to an increment in the size of the circumstellar disc triggered by the tidal interactions of a NS in an eccentric orbit that approaches periastron.
In the second part of the light curve, from to the peak, AX J0049.47323 displays a steep jump in the optical brightness synchronised with the onset of the X-ray outburst. The fast increase in luminosity at is similar to that of the FRED outbursts observed prior to MJD, though with much lower amplitude, and might suggest that another mechanism (likely triggered by the X-ray outburst) could be the cause of the bright peak of this outburst and also the previous asymmetric outbursts.
The current explanation for the FRED-shaped optical outbursts simultaneous with the X-ray outbursts was proposed by Cowley & Schmidtke (2003) and Coe & Edge (2004). They suggested that the optical outbursts were caused by the disruption of the circumstellar disc caused by its interaction with the NS. They also pointed out that a similar outburst behaviour was observed in another Be/XRB, A053866. In this system, an optical variability spanning more than 2 magnitudes was observed simultaneously with bright X-ray outbursts ( erg s-1, Charles et al. 1983 and references therein). Charles et al. (1983), Maraschi et al. (1983), and Apparao & Tarafdar (1988) suggested that the bright optical outbursts of A053866 were produced by the reprocessing of the X-ray photons emitted by the NS in the circumstellar envelope around the binary system. A similar mechanism could explain the asymmetric outbursts observed in AX J0049.47323 prior to MJD and the sudden increase in luminosity at observed in the December 2017 outburst. A similar possibility was also considered by McGowan et al. (2008) for the optical variability shown by SXP 46.6, an accreting pulsar in the SMC. Alternatively, these fast outbursts might be caused by the tidal displacement of a large amount of material from the circumstellar disc or the outer layers of the donor star during the periastron passage of the NS, which then translates to a significant increase in the size of the emitting region and hence in the optical luminosity.
In Sect. 3.3 we presented the results of three observations
of the H line carried out during the December 2017 outburst.
Previously, the H profile of AX J0049.47323 was observed only once by Edge & Coe (2003),
during another optical outburst (at the orbital phase , according to the ephemeris of Schmidtke et al. 2013).
In that observation it showed the typical
double peak seen in many other Be stars with a circumstellar disc observed at a high inclination angle.
In our observations, the H profile showed three peaks
with variable reciprocal intensity.
Although with remarkably different properties from those of AX J0049.47323,
only a few other Be/XRBs
showed anomalous H profiles. Among these,
two interesting cases are
4U 0115+63 and A0535+26.
Negueruela et al. (2001) reported the observations of a succession of single-peaked
and shell profiles in the emission lines of 4U 0115+63
on a timescale of several months.
Shell profiles are usually associated with Be discs seen edge-on,
while single-peaked profiles are observed in pole-on Be discs.
They interpreted their observations with a highly tilted warped
precessing circumstellar disc. The large variability of the H emission line
of 4U 0115+63 was associated with the onset of giant X-ray outbursts.
Moritani et al. (2011, 2013), studied the H line profile variability
of A0535+26 from 2009 to 2012. During this period, the source displayed several X-ray outbursts.
In 2009, during a giant X-ray outburst, the line profile showed three peaks.
They interpreted these features as the result of a precessing warped
circumstellar disc.
Each of the three peaks was produced in different regions of the warped disc
observed from different angles.
We suggest that both the peculiar shape and the high variability of the H profile
of AX J0049.47323 presented in this work might be interpreted
with a scenario similar to that proposed by Moritani et al. (2011, 2013) for A0535+26,
namely with perturbations in the circumstellar disc driven by radiation
or by tidal interactions with the NS in a high eccentricity orbit during its periastron passage.
Similar to what was done by Moritani et al. (2011),
we used the calculations presented by Porter (1998) to estimate
the timescale associated with the precession of a radiatively induced
warped disc around a Be star.
We found that a radiatively
driven warped disc around AX J0049.47323 would have a precessing timescale
ranging from one to five months. The lower limit of about 30 days,
obtained assuming the stellar properties of a O9.5 V star, is compatible
with the observed timescale.
Another way to warp the disc is through tidal interactions with the NS.
Martin et al. (2011, 2014a, 2014b) showed, with numerical simulations,
that if the circumstellar disc of a Be star and the orbital plane of the NS
are misaligned, the tidal torque exerted by the NS on the disc
can warp it and make it more elongated.
Interestingly, an extended and warped circumstellar disc,
slightly misaligned with respect to the orbital plane,
would also explain the high X-ray variability of AX J0049.47323 observed
far from periastron reported in Ducci et al. (2018).
An alternative explanation
is that the complicated shape of the H
line of AX J0049.47323 is caused by the superposition of two contributions from the
circumstellar disc and from an accretion disc around the NS, with different reciprocal orientations.
Kızıloǧlu et al. (2009) suggested that accretion discs around a NS
in a Be/XRB might contribute to the H line.
This line has been used
to reveal the presence of an accretion disc in other
X-ray binary systems such as
SS 433 (Bowler, 2010), IGR J173292731 (Bozzo et al., 2018),
and IGR J00291+5934 (Lewis et al., 2010).
It is important to note that in this framework some problems would emerge for the case of AX J0049.47323 that require further clarification. The central peak was not present during a previous bright X-ray and optical outburst (November 2001, see Sect. 1), when the H line was observed to have the typical double-peak profile produced by the circumstellar discs seen in the spectra of many Be stars. The absence of the central emission line in the previous outburst
would suggest that this component is caused by a transient accretion disc.
It is worth noting that the central peak of the H line observed during the December 2017 outburst has an EW of about , which is strikingly similar to that observed for the single-peaked H line from the face-on accretion disc of the X-ray binary MAXI J1836194 (Russell et al., 2014).
Although it is an attractive scenario, due to the lack of more detailed observations of AX J0049.47323 it is not possible to go beyond these speculations.
5 Conclusions
We presented the results from a multi-wavelength monitoring campaign of the Be/XRB AX J0049.47323 during the outburst of December 2017 in X-ray and optical. We observed the binary system during an anomalous optical outburst characterised by longer rise and decay timescales than in the previous outbursts, and without the characteristic FRED profile observed previously. Near the peak of the outburst, the source showed a sudden increase in the flux in X-ray and bands. We proposed that the properties of the H line and the variability of AX J0049.47323 in the band indicate the presence of a highly perturbed circumstellar disc, likely warped and elongated by the tidal interaction with a NS in a high eccentricity orbit during the periastron passage. We also suggested that the X-ray reprocessing of X-ray photons in the circumstellar disc might be the cause of the asymmetric outbursts observed prior to MJD and the jump in optical luminosity at the peak of the December 2017 outburst. We proposed an alternative scenario, where also an accretion disc around the NS contributes to the complicated shape of the H line. Although the monitoring campaign of the December 2017 outburst has revealed new interesting properties of AX J0049.47323, the information collected so far are insufficient to draw any firm conclusion about the peculiar optical and X-ray variability of AX J0049.47323. Therefore, new multi-wavelength observations and the determination of the orbital parameters of the system, such as the eccentricity and the inclination angle between the orbital plane and the circumstellar disc, will be fundamental to answer some of the most important open questions about the puzzling properties of AX J0049.47323, with particular emphasis on the morphology of the gas envelope around AX J0049.47323 and the mechanism responsible for the simultaneous ‘FRED’ optical and X-ray outbursts.
Acknowledgements.
We thank the anonymous referee for the constructive comments that helped to improve the paper. This paper is based in part on data from the Neil Gehrels Swift Observatory and on data acquired through the Australian Astronomical Observatory. We acknowledge the traditional owners of the land on which the AAT stands, the Gamilaraay people, and pay our respects to elders past and present. This work is supported by the Bundesministerium für Wirtschaft und Technologie through the Deutsches Zentrum für Luft und Raumfahrt (grant FKZ 50 OG 1602). P.R. acknowledges contract ASI-INAF I/004/11/0. C.M. is supported by an appointment to the NASA Postdoctoral Program at the Marshall Space Flight Center, administered by Universities Space Research Association under contract with NASA. The OGLE project has received funding from the National Science Centre, Poland, grant MAESTRO 2014/14/A/ST9/00121 to AU. J.L. is grateful for the support from the Chinese NSFC 11733009.References
- Alcock et al. (1997) Alcock, C., Allsman, R. A., Alves, D., et al. 1997, ApJ, 486, 697
- Apparao & Tarafdar (1988) Apparao, K. M. V. & Tarafdar, S. P. 1988, ApJ, 335, 147
- Arnaud (1996) Arnaud, K. A. 1996, in Astronomical Society of the Pacific Conference Series, Vol. 101, Astronomical Data Analysis Software and Systems V, ed. G. H. Jacoby & J. Barnes, 17
- Bird et al. (2012) Bird, A. J., Coe, M. J., McBride, V. A., & Udalski, A. 2012, MNRAS, 423, 3663
- Bowler (2010) Bowler, M. G. 2010, A&A, 516, A24
- Bozzo et al. (2018) Bozzo, E., Bahramian, A., Ferrigno, C., et al. 2018, A&A, 613, A22
- Brown et al. (2018) Brown, R. O., Ho, W. C. G., Coe, M. J., & Okazaki, A. T. 2018, MNRAS, 477, 4810
- Burrows et al. (2005) Burrows, D. N., Hill, J. E., Nousek, J. A., et al. 2005, Space Sci. Rev., 120, 165
- Casares et al. (2014) Casares, J., Negueruela, I., Ribó, M., et al. 2014, Nature, 505, 378
- Charles et al. (1983) Charles, P. A., Booth, L., Densham, R. H., et al. 1983, MNRAS, 202, 657
- Coe & Edge (2004) Coe, M. J. & Edge, W. R. T. 2004, MNRAS, 350, 756
- Cowley & Schmidtke (2003) Cowley, A. P. & Schmidtke, P. C. 2003, AJ, 126, 2949
- Ducci et al. (2018) Ducci, L., Romano, P., Malacaria, C., et al. 2018, A&A, 614, A34
- Edge & Coe (2003) Edge, W. R. T. & Coe, M. J. 2003, MNRAS, 338, 428
- Galache et al. (2008) Galache, J. L., Corbet, R. H. D., Coe, M. J., et al. 2008, ApJS, 177, 189
- Gehrels et al. (2004) Gehrels, N., Chincarini, G., Giommi, P., et al. 2004, ApJ, 611, 1005
- Hanuschik et al. (1995) Hanuschik, R. W., Hummel, W., Dietle, O., & Sutorius, E. 1995, A&A, 300, 163
- Harris & Zaritsky (2006) Harris, J. & Zaritsky, D. 2006, AJ, 131, 2514
- Haubois et al. (2012) Haubois, X., Carciofi, A. C., Rivinius, T., Okazaki, A. T., & Bjorkman, J. E. 2012, ApJ, 756, 156
- Kızıloǧlu et al. (2009) Kızıloǧlu, Ü., Özbilgen, S., Kızıloǧlu, N., & Baykal, A. 2009, A&A, 508, 895
- Laplace et al. (2017) Laplace, E., Mihara, T., Moritani, Y., et al. 2017, A&A, 597, A124
- Laycock et al. (2005) Laycock, S., Corbet, R. H. D., Coe, M. J., et al. 2005, ApJS, 161, 96
- Lewis et al. (2010) Lewis, F., Russell, D. M., Jonker, P. G., et al. 2010, A&A, 517, A72
- Malacaria et al. (2017) Malacaria, C., Kollatschny, W., Whelan, E., et al. 2017, A&A, 603, A24
- Maraschi et al. (1983) Maraschi, L., Traversini, R., & Treves, A. 1983, MNRAS, 204, 1179
- Maraschi et al. (1976) Maraschi, L., Treves, A., & van den Heuvel, E. P. J. 1976, Nature, 259, 292
- Martin et al. (2014a) Martin, R. G., Nixon, C., Armitage, P. J., Lubow, S. H., & Price, D. J. 2014a, ApJ, 790, L34
- Martin et al. (2014b) Martin, R. G., Nixon, C., Lubow, S. H., et al. 2014b, ApJ, 792, L33
- Martin et al. (2011) Martin, R. G., Pringle, J. E., Tout, C. A., & Lubow, S. H. 2011, MNRAS, 416, 2827
- McBride et al. (2008) McBride, V. A., Coe, M. J., Negueruela, I., Schurch, M. P. E., & McGowan, K. E. 2008, MNRAS, 388, 1198
- McGowan et al. (2008) McGowan, K. E., Coe, M. J., Schurch, M. P. E., et al. 2008, MNRAS, 384, 821
- Moritani et al. (2011) Moritani, Y., Nogami, D., Okazaki, A. T., et al. 2011, PASJ, 63, 25
- Moritani et al. (2013) Moritani, Y., Nogami, D., Okazaki, A. T., et al. 2013, PASJ, 65, 83
- Negueruela et al. (2001) Negueruela, I., Okazaki, A. T., Fabregat, J., et al. 2001, A&A, 369, 117
- Okazaki et al. (2002) Okazaki, A. T., Bate, M. R., Ogilvie, G. I., & Pringle, J. E. 2002, MNRAS, 337, 967
- Paczynski (1986) Paczynski, B. 1986, ApJ, 304, 1
- Porter (1998) Porter, J. M. 1998, A&A, 336, 966
- Rajoelimanana et al. (2011) Rajoelimanana, A. F., Charles, P. A., & Udalski, A. 2011, MNRAS, 413, 1600
- Reig (2011) Reig, P. 2011, Ap&SS, 332, 1
- Reig & Fabregat (2015) Reig, P. & Fabregat, J. 2015, A&A, 574, A33
- Reig et al. (2007) Reig, P., Larionov, V., Negueruela, I., Arkharov, A. A., & Kudryavtseva, N. A. 2007, A&A, 462, 1081
- Reig et al. (2010) Reig, P., Zezas, A., & Gkouvelis, L. 2010, A&A, 522, A107
- Rivinius et al. (2013) Rivinius, T., Carciofi, A. C., & Martayan, C. 2013, A&A Rev., 21, 69
- Roming et al. (2005) Roming, P. W. A., Kennedy, T. E., Mason, K. O., et al. 2005, Space Sci. Rev., 120, 95
- Russell et al. (2014) Russell, T. D., Soria, R., Motch, C., et al. 2014, MNRAS, 439, 1381
- Schmidtke et al. (2013) Schmidtke, P. C., Cowley, A. P., & Udalski, A. 2013, MNRAS, 431, 252
- Sheinis (2016) Sheinis, A. I. 2016, in Proc. SPIE, Vol. 9908, Ground-based and Airborne Instrumentation for Astronomy VI, 99081C
- Skowron et al. (2016) Skowron, J., Udalski, A., Kozłowski, S., et al. 2016, Acta Astron., 66, 1
- Townsend et al. (2017) Townsend, L. J., Kennea, J. A., Coe, M. J., et al. 2017, MNRAS, 471, 3878
- Udalski (2008) Udalski, A. 2008, Acta Astron., 58, 187
- Udalski et al. (2015) Udalski, A., Szymański, M. K., & Szymański, G. 2015, Acta Astron., 65, 1
- van Paradijs (1998) van Paradijs, J. 1998, in NATO Advanced Science Institutes (ASI) Series C, Vol. 515, NATO Advanced Science Institutes (ASI) Series C, ed. R. Buccheri, J. van Paradijs, & A. Alpar, 279
- Waters (1989) Waters, L. B. F. M. 1989, in ESA Special Publication, Vol. 296, Two Topics in X-Ray Astronomy, Volume 1: X Ray Binaries. Volume 2: AGN and the X Ray Background, ed. J. Hunt & B. Battrick
- Wilms et al. (2000) Wilms, J., Allen, A., & McCray, R. 2000, ApJ, 542, 914
- Yokogawa et al. (2000) Yokogawa, J., Imanishi, K., Ueno, M., & Koyama, K. 2000, PASJ, 52, L73