A tentative double-jet model for blazar OJ287
Abstract
Context. We try to propose a relativistic jet model for explaining the entire radio-optical phenomena observed in blazar OJ287, which has been observed quasi-periodically with a cycle of 12 yr in its optical light curve.
Aims. We investigate the currently available theoretical and observational studies on the phenomena observed in OJ287 and try to find clues to its double-jet structure.
Methods. It is found that the kinematic features of its superluminal components observed at 43 GHz and 15 GHz could be well interpreted in terms of a precessing double-jet nozzle model with non-ballistic trajectories. And the light curves of a few double-peaked optical outbursts could be interpreted in terms of relativistic jet models.
Results. Both jets precess with the same period of 12 yr, equal to the optical period and the precession of the jets could be originated from the orbital motion of the binary. Thus the masses of the binary black holes could be estimated.
Conclusions. We also tentatively suggest a comprehensive framework for understanding the entire phenomena in OJ287 in terms of relativistic jet models.
Key Words.:
galaxies: active – galaxies: jets – galaxies: nuclei – galaxies : individual OJ2871 Introduction
Research on blazars is an important field of extragalactic astrophysics. A number of prominent blazars (e.g., 3C279, 3C345, 3C454.3, 1510-089, S5 0836+710, OJ287, BL Lacertae etc.) have been studied through extensive observations of their emission at multi-wavelengths from radio through to -rays and very long-baseline interferometry (VLBI) observations of their relativistic jets. It is found that studies on the connection between the inner jet kinematics (formation and evolution of superluminal components) and broadband (flux and polarization) variability is particularly useful for understanding the mechanisms of blazar radiation and determining the location of emission regions in the relativistic jets.
Relativistic jets of blazars may be produced by the supermassive black hole-accretion disk systems existing in their nuclei and thus studies on relativistic jets of blazars involve black hole physics and general relativity.
OJ287 (z=0.306) is one of the prominent blazars which have been extensively studied. It is a low synchrotron peaked BL Lacertae object (BLO). It radiates across the entire electromagnetic spectrum from radio through optical and X-ray to -rays. Its emissions in all wavebands are strongly variable in brightness and polarization with timescales of hours/days to years.
OJ287 is one of the bright Fermi -ray sources (Nolan et al.No12 (2012), Ackermann et al. Ac11 (2011)). Multifrequency observations and studies of its spectral energy distribution (SED) have been used to investigate the emission mechanisms of its X-rays and -rays. Studies of the correlation between its -ray emission and the emergence of superluminal components have shown that -ray outbursts can be produced in the core region or in stationary features away from the core (Agudo et al. (2011b , Hodgson et al. Hod17 (2017)). OJ287 has a X-ray jet on Mpc scale discovered by Marscher & Jorstad (Ma10 (2010)).
OJ287 has been monitored for long times at multi-frequencies, especially in optical bands (e.g., Agudo et al. 2011a , 2011d , Villforth et al. Vil10 (2010), Valtaoja et al. Val20 (2000), Sillanpää et al. Si88 (1988), Marscher & Jorstad Ma10 (2010), Valtonen & Sillanpää Va11 (2011), Valtonen et al. Va09 (2009); Ciprini et al. Ci07 (2007), Agudo et al. 2011b , Agudo et al. 2011c ). Its optical variability behavior is remarkable and extraordinary, showing that optical outbursts in OJ287 occurred quasi-periodically with a period of 12 yr. Up to now five periodic outbursts with double-peaked flares have been observed in 1971–73, 1983–84, 1994–96, 2005–2007 and 2015–2019 (Valtonen et al. Va16 (2016)).111According to Valtonen et al. (Va16 (2016)) the second flaring will appear in 2019.7 with a time interval of 3.8 yr rather than 1-2 yr for the previous double-peaked outbursts. The long-lasting quasi-periodicity is believed to be related to the orbital motion of the binary black holes in its nucleus. A number of models have been proposed to interpret this phenomenon (e.g., Sillanpää et al. Si88 (1988), Lehto & Valtonen Le96 (1996), Katz Ka97 (1997), Sundelius et al. Su97 (1997), Villata et al. Villa98 (1998), Valtaoja et al. Val20 (2000), Villforth et al. Vil10 (2010), Tanaka Ta13 (2013), Qian Qi15 (2015)). Until now, the precessing binary black hole model proposed by Lehto & Valtonen (Le96 (1996)) (and its improved versions) may be the most detailed one to interpret the optical double-peaked outbursts observed in OJ287. The authors assumed that the secondary black hole impacts into the accretion disk of the primary hole twice per pericenter passage, causing the 12 yr periodicity and 1–2 yr time-intervals. This model requires (i) a large inclination of the orbital plane (); (ii) a total mass of with a mass ratio m:M 0.007:1; (iii) an orbital eccentricity e0.7. Recently, Tanaka (Ta13 (2013)) proposed an alternative model to explain the optical double peaked outbursts, suggesting that these outbursts are originated from the cavity-accretion processes in the binary system. This model has two substantial differences from the disk-impact model of Lehto & Valtonen (Le96 (1996)): (i) the total mass of the binary is in the order of with a mass ratio m:M=0.25:1; (2) the orbital plane is coplanar with the circumbinary disk.
Based on VLBI-observations, OJ287 has a core-jet structure with superluminal knots emerging from the core steadily. The structure and the kinematics of the jet are very complex: It has both stationary and superluminal features. Some superluminal knots move via the stationary ones. Jet position angle swings (with long-term and short-term time-scales) have been observed and studied (e.g., Agudo et al. Ag12 (2012), Tateyama & Kingham (Ta04 (2004), Moór et al. Mo11 (2011), Katz Ka97 (1997), Valtonen & Pihayoki Va13 (2013), Valtonen & Wiik Va12 (2012), Cohen Co17 (2017)). But no certain results of the jet precession have been obtained.
The correlation between the optical and radio variability and the connection between the optical outbursts and the emergence of superluminal radio components from the core have been extensively studied (e.g, Tateyama et al. Ta99 (1999), Valtaoja et al. Val20 (2000), Villata et al. Villa98 (1998), Vicente et al. Vic96 (1996)). However, it has been proved that this is a difficult task. Only recently, Britzen et al. (Br18 (2018)) re-analyzed the MOJAVE data (Monitoring of Jets in Active galactic nuclei with Very Long Baseline Array Experiments, Lister et al. Li09 (2009)) and found for the first time that the kinematics of the superluminal components can be explained in terms of jet precession plus rotation and the optical and radio light curves can be interpreted in terms of geometric effects under a black hole binary scenario.
In this paper we perform model fittings of the kinematics of the radio superluminal components and the light curves of optical outbursts in OJ287, and discuss an alternative possibility that OJ287 might have a double-jet structure, providing some new viewing aspects on the OJ287 phenomena. Observational data at optical, 43 GHz and 15 GHz are collected from the literature (Valtonen et al. Va08 (2008), Agudo et al. Ag12 (2012), Tateyama et al. Ta99 (1999), Britzen et al. Br18 (2018) and others).
2 Clues to a double jet and precession
We first investigate the theoretical and observational clues to the jet precession and double jet structure in OJ287.
2.1 Theoretical clues
We first discuss the theoretical clues for double precessing jets in blazars.
(1) According to the -cold dark matter cosmological paradigm, galaxies grow hierarchically through mergers. (Kormendy & Richtone Ko95 (1995), Ferrarese & Ford Fe05 (2005)). Hierarchical structure formation inevitably leads to the formation of supermassive binary black holes with subparsec separation in galactic nuclei (Roedig et al Ro12 (2012), Cuadra et al. Cu09 (2009), Shi et al. Sh12 (2012), Hayasaki et al. Ha08 (2008), D’Orazio et al. Do13 (2013)). If there is sufficient accretion onto both SMBHs, then two jets would be formed and the source would become a blazar if these jets occasionally direct toward us.
(2) The optical light curve of OJ287 shows prominent flarings with roughly 12 yr cycles. This quasi-periodicity has been suggested to be related to the orbital motion of a binary black hole at its center. Thus OJ287 is one of the most prominent candidates of black hole binary. If both holes produce a relativistic jet forming a double jet structure, there will naturally exist two groups of superluminal knots ascribed to the two jets, respectively.
(3) According to the interpretation of the double-peaked optical outbursts in terms of the precessing binary model, Valtonen et al. (Va16 (2016)) found that the strong thermal optical outburst in 2015.87 was followed by a synchrotron flare within 20 days. Since the impacting of the secondary hole onto the primary hole disk occurred near its apocenter passage located at about 20,000 AU (0.1 pc) away from the primary hole, thus this short time delay seems implying that the synchrotron flare was originated from the relativistic jet produced by the secondary black hole. Such an interpretation might be regarded as a useful clue to the double jet structure in OJ287, although the disk-impact model proposed by Lehto & Valtonen (Le96 (1996)) still needs to be confirmed.
(4) A further clue comes from the studies of the origin of the precursor flares occurred before the major double-peaked outbursts in the optical light curve (Kidger et al. Kid95 (1995), Valtonen et al. Va06 (2006), Pihajoki et al. 2013a , 2013b ). These authors suggested that the prominent flares prior to the major double-peaked outbursts are produced in the jet of the secondary black hole. Pietilä (Pie98 (1998)) investigated the essential aspects of the precessing binary model: the kinematics of the binary orbital motion and the disk impactings. The author suggested that the secondary black hole may be a source emitting optical synchrotron, because it undergoes enhanced accretion when it penetrates the primary disk and passes the pericenter, leading to the formation of a temporary accretion disk and jet in the secondary hole.
(5) Villata (Villa98 (1998)) proposed a double jet model to interpret the quasi-periodic optical double-peaked outbursts, assuming that the two relativistic jets are created by the putative binary black holes. This model simulated the observed light curve quite well. This is the first model attempting to interpret the phenomena in OJ287 in terms of a double jet scenario.
(6) As a supplementary clue, Qian et al. (Qi18 (2018)) find some evidence of the possible existence of a double-jet structure in blazar 3C279 through the model-fitting of the kinematics for its thirty-one superluminal components in terms of a precessing double-jet nozzle model. Having obtained some new significant findings for the QSO-type blazar 3C279, we may pose the question: if the BLO-type blazar OJ287 could also have a double-jet structure? We shall try to discuss this possibility in this paper.
2.2 observational clues
We shall summarize the various results from the previous studies on multi-frequency variability and VLBI observations of the jet in OJ287 and show some observational clues for the existence of a double jet and the 12 yr precession.
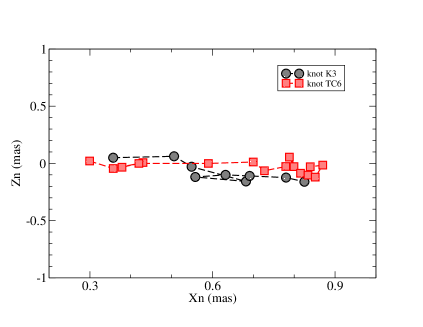
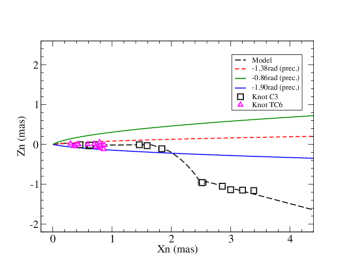
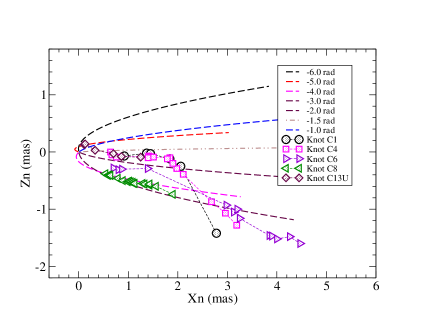
(1) The ejection of the superluminal components in OJ287 has been monitored for a quite long period. Similar trajectories have been registered for ejection times different by 11–12 yrs. An example is shown in Figure 1: Vicente et al. (Vic96 (1996)) reported the ejection of knot K3 which was ejected at 1984.0. Tateyama et al. (Ta99 (1999)) reported a superluminal knot (designated as TC6 here) ejected at 1995.4. Interestingly, the two knots moved along very similar position angles and trajectories with an ejection time difference of 11.4 yr, almost equal to the optical period of 11–12 yr found in the optical light curve.
(2) Tateyama & Kingham (Ta04 (2004)) investigated the VLBI structure of OJ287 at 8 GHz during the period [1994,2002], showing that the jet position angle swung in the range (from to ). They interpreted this behavior in terms of a ballistic precessing jet model with a precession period of 11.6 yr, similar to the optical variability period. This precessing jet model was confirmed by Moór et al. (Mo11 (2011)) and Piner et al. (Pin07 (2007)) for the similar period (before 2002).
(3) The phenomenon of ”sudden jump of JPA (jet position angle)” observed in OJ287 could be another clue to the activity of a double jet. Based on the 43 GHz VLBA (Very Long Baseline Array) observations during [1995, 2011], Agudo et al. (2012) found a sharp swing of the jet PA (position angle) in 2004 from PA to PA. They explained this phenomenon as the innermost jet having a very small viewing angle and swinging across the line of sight during a relatively short time interval (1 yr). However, following the method of Jorstad et al. (Jor05 (2005)), they derived the viewing angle range =[, ], which did not verify the crossing of the jet from one side of the line of sight to the other. Similar position PA jumps were observed by D’Arcangelo et al. (Da09 (2009)) and Britzen et al. (Br18 (2018)). As for the explanation of the jet position angle jump observed in 3C279, we interpret this behavior in OJ287 as the ejections of superluminal components from two jets along different directions.
(4) Tateyama (Ta13 (2013)) investigated the structure of the inner jet of OJ287 at 15 GHz (during time-interval 1995–2012) in a super-resolution mode (Tateyama et al. Ta99 (1999)) along with the 43 GHz VLBA maps. The author identified the core position different from that identified by Agudo et al. (Ag12 (2012)) and suggested that the innermost jet has a southeast/core/northwest configuration of a fork-like shape. Superluminal knots are ejected from the core via stationary components in both southeast and northwest directions, forming a very broad opening angle (or jet cone aperture) at its base. This study implicitly indicated that two jets may possibly be produced at the center of OJ287 and is fully consistent with our assumptions in our double jet scenario below. The broad fork-like jet morphology is extraordinary and could be formed by the superposition of two parabolic jets (e.g., in M87, Hada et al. Had11 (2011), Asada & Nakamura As12 (2012), Doeleman et al. Do12 (2012), Nakamura & Asada Na13 (2013) for single jets; also Polko et al. Po13 (2013)).
(5) Cohen (Co17 (2017)) investigated the jet structure and analyzed the evolution of the jet ridgelines, based on the 15 GHz VLBA images obtained during the time interval [1995, 2015]. The author suggested that the jet of OJ287 is rotating with a period of 30 years. Although the jet ridgelines do not reflect the real distribution of the jet flows in the 3-dimensional space (distinct from the trajectories of the superluminal components), the observed distribution and evolution of the jet ridgelines seems revealing some clues for a double jet structure. For example, (i) The observed distribution of the ridgelines show two bundles of ridgelines (northern and southern bundles) within a core separation of 1.2 mas which are roughly divided by the ”source axis” (designated by Cohen Co17 (2017)) at a position angle with a gap where the density of ridgelines is very low (Figure 2 of that paper). This division of ridgeline bundles is also prominent in Figure 4 of Britzen et al. (Br18 (2018)); (ii) Cohen (Co17 (2017)) showed that the jet ridge close to the core appears to split into two ridges at different position angles and sustained for several years; (iii) The 15 GHz polarization map (Figure 5 of that paper) shows two highly-polarized regions respectively at the northern ridge and southern ridge. Cohen suggested that the southern highly-polarized ridge may be produced by a separate jet. Thus the division of the ridgeline bundles within separation 1.2 mas could represent a double jet structure. And the superposition of the two ridgeline bundles leads to an apparent rotation period of 30 yr, as suggested by Cohen (Co17 (2017)).
(6) Hodgson et al. (Hod17 (2017)) reported that the 43 GHz VLBI-observations during the period of 2007–2013 reveal two strong, compact and highly variable stationary components: southern-most component-C and northern component-S. They noted that there exists two trajectories at position angles different by . If taking component-C as the only core, then the ejection direction of the superluminal components would have changed from – to – during a period of 1 yr. Alternatively, this sudden “jet PA Jump” could imply a double jet structure in OJ287: both component-C and component-S are jet cores, from which superluminal components are ejected respectively. Thus the problem of differential trajectories could be removed: knot-X1 ejected from core C and knot X2/X3 from core S. Observational facts given in Hodgson et al. seem to support this assumption: (i) Component-S and component-C have very similar properties in compactness and brightness temperature, spectrum (15–86 GHz), and flux/spectral variability; (ii) both were regarded as standing shocks with some wanderings; (iii) both have similar -ray activities. This putative double-core structure could be understood in terms of the ”Phoenix fire mechanism” proposed by Meier (Mei13 (2013)), if the source has two jets.
(7) Krichbaum et al. (Kr13 (2013)) analyzed the parsec scale jet structure observed in October 2009 at 15, 43, and 86 GHz. They found that at 15 and 43 GHz, OJ287 shows a bent core-jet structure curved toward the southwest direction. At 86 GHz, its core region reveals a double structure consisting of component C1 and component C2. According to this bent jet structure the northern component C1 should be identified as the core, because it is the unresolved base of a synchrotron self-absorbed jet. However, the southern component C2 has a more inverted spectrum, implying that C2 might be the core. Using the 43GHz and 86 GHz data given in Hodgson et al. (Hod17 (2017)) we found that during the period of 2007.45–2010.75, in 65% cases component C1 were stronger and had smaller angular sizes (thus higher brightness temperatures) than component C2, suggesting that component C1 should be more qualified as the core. Thus the dilemma in the identification of the core might be regarded as a clue to the double core structure in OJ287.
(8) As a supplementary clue, Qian et al. (Qi18 (2018)) have recently found evidence of a supermassive black hole binary with two radio jets in blazar 3C279. They showed that the parsec-scale kinematics of 31 superluminal knots could well be interpreted in terms of a precessing double jet-nozzle model: the jets produced by the primary and secondary supermassive black holes are precessing with the same precession period of 25 yr. The model-predicted properties of the relativistic jet produced by the secondary black hole are well consistent with those of its kpc-jet counterpart and the milliarcsecond jet observed in 1970s and 1980s, strongly supporting the precessing double jet scenario.
(9) In this paper we would perform detailed analysis and model-fittings of the parsec-scale kinematics for the 14 superluminal components observed in OJ287 and show that a double jet scenario can well interpret the source kinematics and can provide important information on the the physical processes occurring in OJ287. We emphasize that in both 3C279 and OJ287 the properties of double-jet structure are consistent with the HD/MHD theories and numerical simulations for the cavity-accretion in binary black hole systems.
3 Working assumptions
The arguments given above indicate the possibility that OJ287 may harbor a black hole binary and both holes (primary and secondary) produce a respective relativistic jet, which ejects superluminal components. A schematic plot for the double jet structure is shown in Figure 2. In the left panel the two jets have a single (common) apex which is designated as k-component in Britzen et al. (Br18 (2018)). In the right panel the two jets have their respective apex: one is at k-component in BFW18 (for the northern jet) and the other is at C-component (for the southern jet) designated in Hodgson et al. (Hod17 (2017)).222We assume that the mean position of the S-component (Hodgson et al. Hod17 (2017); 43 GHz) relative to the C-component is (=0.091 mas, =0.173 mas). We have found that the mean position of the S-component relative to C-component is coincided with the position of the k-component. These schemes represent two comparatively extreme cases to investigate the double jet structure. We have performed the model-fitting of the source kinematics under both schemes and obtained very similar results. Thus for brevity and clarity, here we will only present the model-fitting results for the first scheme: two jets with a single apex. The mode fitting results for the second scheme will be presented elsewhere.
We will divide the fourteen superluminal components into two groups, ascribed to two jets: northern jet and southern jet, respectively. Model fitting of the kinematics will be performed for each group in terms of the precessing nozzle model, which originally proposed by Qian et al. (Qi91 (1991)) and has been applied to study the parsec-scale kinematics for a few blazars (e.g., 3C345, Qian et al. Qi09 (2009); 3C279, Qian Qi13 (2013), Qi19 (2019); 3C454.3, Qian et al. Qi14 (2014); NRAO 150, Qian Qi16 (2016); B1308+326, Qian et al. Qi17 (2017); and PG1302-302, Qian et al. Qi18 (2018)).
The precessing nozzle model contains a number of assumptions: (1) superluminal components are ejected from the jet nozzle and move along the jet axis which may be described as having rectilinear, helical or parabolic shapes; (2) the jet axis precesses with a certain precession period and the knots ejected at different times are moving along a precessing common trajectory; (3) The change of the ejection direction and trajectory of the knots lead to the observed evolution of their position angle; (4) The structure and evolution of the whole jet (jet body) exhibited on the VLBI maps are constructed by the distribution of the isolated knots sequentially ejected by this precessing nozzle; (5) In general, this regular kinematic pattern can only be applied to the inner jet regions and the outer trajectories may deviate from this regular pattern with curvatures occurring at different separations; (6) in addition to the ejection of superluminal knots from the precessing nozzle, magnetized plasmas could also be ejected from the precessing nozzle. The assembly of the kinematics and brightness evolution of these superluminal knots and magnetized plasmas will form the entire jet structure revealed on VLBI-maps; (7) Following the MHD (magnetohydrodynamic) nozzle model proposed by Nakamura & Asada (Na13 (2013)), we will assume that the precessing common trajectory has a parabolic form, that is, we will utilize a parabolic precessing nozzle model. The double jet structure is specified through the trial model fittings described in the text and shown in Figure 2.
Precessing jet models have been investigated and applied to interpret the parsec-scale kinematics in blazars by many authors (e.g., Stirling et al. St03 (2003); Roland et al. Rol08 (2008); Britzen et al. Br18 (2018); Qian et al. Qi18 (2018) and others). While most of these models deal with ballistic motions in the sources, our precessing jet models (including the precessing double-jet model for 3C279 and OJ287 (this paper)) deal with non-ballistic (helical or parabolic) motions.
We point out that the results obtained in this paper are only tentative and our aim is to demonstrate an alternative scenario to understand the VLBI-kinematics in OJ287. Our study may have some advantages, helping to solve some unsolved issues about the jet structure, jet precession, the connection of the optical outbursts with the emergence of the superluminal components and others, leading to a deeper understanding of the entire phenomena in OJ287.
4 Formalism of Model Simulation
In order to investigate the kinematics of the superluminal components in blazar OJ287 in terms of a parabolic precessing jet model, we have to introduce a special geometry. Qian et al. (Qi91 (1991)) proposed a precessing helical jet model, which has been applied to study the trajectory distribution/evolution and jet swing in a few blazars: e.g., 3C345 (Qian et al. Qi09 (2009)), 3C454.3 (Qian et al. Qi14 (2014)), 3C279 (Qian Qi12 (2012), Qi13 (2013), Qian et al. Qi19 (2019)), NRAO 150 (Qian Qi16 (2016)), B1308+326 (Qian et al. Qi17 (2017)), PG 1302-102 (Qian et al. Qi18 (2018)). Here we further generalize the model as follows.
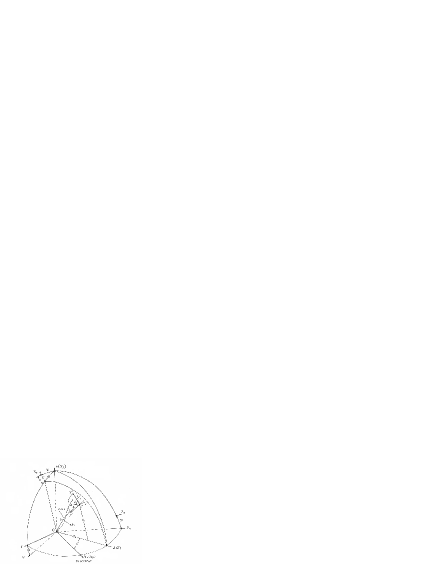
Five coordinate systems are introduced: (), (), (), () and (). The geometry of the model is shown in Figure 3. () axis directs toward the observer. The planes () and () define the plane of the sky with -axis directing the negative right ascension and -axis the north pole. The angle between the and is . We assume that the jet-axis locates in the plane () and is described by a function which is assumed to be a parabolic function. Here we choose a parabolic shape for the precessing jet axis, following Asada & Nakamura’s observations of the giant radio galaxy M87 and their modeling results (Asada & Nakamura As12 (2012), Nakamura & Asada Na13 (2013), Polko et al. Po13 (2013)):
| (1) |
and are constants.333Nakamura & Asada (Na13 (2013)) take =1.0–0.5 for their magnetic nozzle model and Polko et al. (Po13 (2013)) adopt =3/4 in their model simulations. Angle (t) between the plane () and plane () represents the precession of the jet axis around the -axis. The angle between and is , describing the viewing angle of the of precession axis . The precession axis is defined by parameters (, ).
Generally, helical motion of a knot around the precessing jet axis can be described by the parameters (, ) in the coordinate system (). The axis is along the tangent to the jet axis and the () plane is perpendicular to the local jet axis. represents the phase of the helical motion of a knot. The trajectory of a superluminal knot is described in cylinder coordinates (, ): – distance from the origin along the precession axis (Z). represents the amplitude of the knot’s path; is the azimuthal angle or the phase of the knot. denotes the arc length along the jet axis:
| (2) |
and are measured in units of milliarcsecond (mas) and is measured in units of radian. For studying helical motion of a knot around the jet axis the orbital phase and amplitude function should be given. In this paper we do not discuss knot’s helical motion and set =0.
In the case knots move along the jet axis, when their coordinates = and the coordinates of the jet axis are:
| (3) |
| (4) |
| (5) |
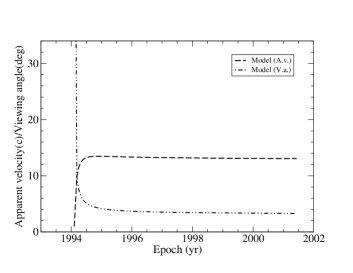
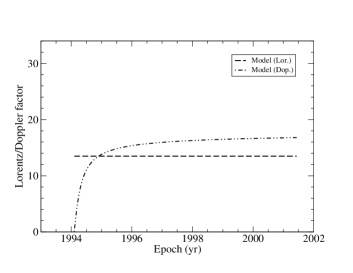
When parameters , , , , and (bulk Lorentz factor of the knot) are set, the kinematics of the knot (projected trajectory, apparent velocity and Doppler factor, viewing angle as functions of time ) can then be calculated. The formulas are listed as follows.
The projected trajectory on the plane of the sky is represented by:
| (6) |
| (7) |
Introducing the following functions:
| (8) |
| (9) |
| (10) |
We then can calculate the elapsed time (at which the knot
reaches an axial distance Z), apparent velocity
, Doppler factor , and viewing angle
of the knot:
| (11) |
| (12) |
| (13) |
| (14) |
where =v/c (v–speed of the knot) and =.
We point out that in the scenario of the precessing nozzle model described in Figure 3, the precessing common trajectory is defined in the coordinate system (X, Y, Z) and described by three parameters (, , ). But in the observer system (, , ), the trajectory is defined by five parameters (, , , , ). Generally, changes in any parameter or in their combination will introduce the change of the trajectory pattern with respect to the observer’s system. In particular, for simplicity, in the following model simulations of the superluminal knots, changes in single parameter will be introduced to study the knots’ trajectory curvatures in the outer jet regions, while in their inner jet regions parameter will remain to be a constant value to demonstrate the jet precession. The change in single parameter parameter implies that the knot’s trajectory rotates around the viewing axis (Note that parameter remains to be a constant).
In this paper, we adopt the concordant cosmological model (CDM model) with =0.27, =0.73 and Hubble constant = (Spergel et al. Sp03 (2003)). Thus for OJ287, z=0.306, its luminosity distance is =1.58Gpc (Hogg Ho99 (1999), Pen Pe99 (1999)) and angular diameter distance =0.9257Gpc. The angular scale 1mas=4.487 pc, and the proper motion of 1mas/yr is equivalent to an apparent velocity of 19.1c (c is the speed of light).
5 Selection of model parameters
In this paper we try to interpret the source kinematics of OJ287 in terms of the precessing jet model originally proposed by Qian et al. (1991, 2009, 2014) in the framework of a double jet scenario. In order to perform the model-fitting of the kinematics of the knots, we need to select model parameters for both the jets, separately. For each jet two sets of model parameters are required.
For a single jet the approach of selecting the model parameters has been described in detail in Qian et al. (Qi17 (2017), Qi18 (2018)) where the VLBI-kinematics of the superluminal components of QSO B1308+326 and PG 1302-102 were model fitted. In the case of OJ287 it involves more and new parameters (e.g., parameters and for the common parabolic trajectory pattern) and we have to define them separately for the two jets. Here we briefly iterate our procedure of selecting model parameters as follows (see Qian et al. Qi17 (2017), Qi18 (2018), Qi19 (2019)).
-
•
Geometric and kinematic parameters: these include parameters and defining the orientation of the precession axis, parameters and defining the shape of the common precessing trajectory and Lorentz factor for each of the knots. We can derive a preliminary set of the parameters. For example, if the viewing angle of the jet is given, then (i) the parameters and can be approximately determined from the observed trajectories of the knots; (ii) from the observed distribution of the knots’ trajectories, the position angle of the precession axis and its orientation in space (parameter ) can be approximately derived; and (iii) Lorentz factors of the knots can be estimated from their observed apparent velocities. The selection of these parameters are not unique, mostly depending on the viewing angle (parameter ) of the precession axis. Using the formalism described in Sect. 3, appropriate parameters can finally be chosen through trial model fittings of the kinematics of the knots (see Qian et al. Qi19 (2019)). Since different viewing angles chosen for the precession axis would lead to different projection effects we would firstly select an appropriate value for parameter . In this paper we take = (see Cohen 2017, Hovatta et al. 2009, Agudo et al. 2012).
-
•
Parameters describing the time-dependent kinematic behaviors of the knots: ejection times () of the knots and the jet precession period . In the case of OJ287, the 12 yr periodicity found in the optical light curve might be used as the precession period of the jet axis for both the jets, because this period is the only one having been determined in the optical variability observed in OJ287. And this assumption will be justified by the studies in this paper (see below). Thus for OJ287 the precession period is a known parameter which constrains the observed aperture of the jet cone and the distribution of the trajectories of the knots. What should be done is to model fitting the observed knots’ trajectories and their ejection times under the precessing jet nozzle scenario. Although the geometric and kinematic parameters are not uniquely chosen, the modeled ejection epochs () and the precession period are strictly constrained by the measured ejection epochs () and the observed distribution of the knots’ tracks for both jets. The ejection times measured from the VLBI observations can be used as the initial values for the modeled times , and then we can determine their final values through trial model fitting of the observed distribution of the trajectories of the knots. Usually, of a knot is measured by extrapolating its separation from the core to zero through linear regression. If the motion of the knot is non-radial (having a curved trajectory) or initially accelerated (or decelerated), this method could induce significant errors in .444Opacity effects of a knot at its emergence from the core could also induce errors in the measurements of by this method (see Qian et al. 2017). Therefore, during the process of trial model fitting for the kinematics of the knots we determine the model ejection times to be close to the values derived from the VLBI measurements as possible and constrain their differences from the within 1 yr. It can be seen below (Tables 1 and 2) that for the twelve knots which are model fitted, only two knots (C6 and C9) 0.5–1.0 yr. This difference can be regarded as the maximal uncertainties of the model fitting results in this paper.
6 Model-fitting results for southern jet
Through analyzes and trial model-fittings we have found that the southern jet comprises six knots (C7, C9, C10, C11, C12 and C13L), forming the southern group of superluminal components. We select the model parameters for the southern jet as:
| 12 yr | |
| 0.0524 rad= | |
| 0.65 rad= | |
| 0.0536 | |
| 0.5 |
=12 yr, =, =0.65 rad, =0.0536, =0.5 which are listed in Table 1.
The ejection time is related to the precession phase:
| (15) |
Here =5.70 rad corresponds to the ejection epoch for knot C7 at 1998.55. =12 yr. In Table 2 some modeled parameters and relevant observation data are listed. Our modeled ejection times () are consistent with the ejection times () derived from VLBI measurements.
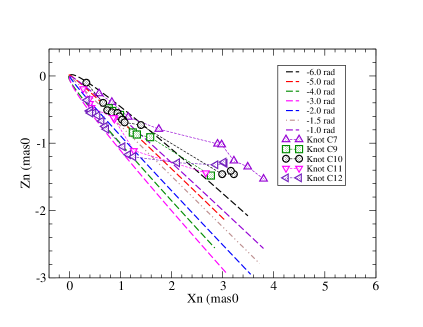
The entire structure of the southern jet and the distribution of the knots’ trajectories are shown in Fig.4.
| Knot | (rad) | (deg.) | (deg.) | ||||
|---|---|---|---|---|---|---|---|
| C7 | 1998.55 | –5.70 | 10.3 | 1998.9 | 8.80.2 | -115.3 | +4.8 |
| C9 | 2001.80 | –7.40 | 13.0–9.0 | 2000.8 | 7.50.2 | -121.9 | +3.8 |
| C10 | 2002.34 | –7.68 | 9.2 | 2002.5 | 8.20.2 | -120.2 | +5.3 |
| C11 | 2003.10 | –8.08 | 8.0 | 2002.9 | 6.10.2 | -129.8 | +11.4 |
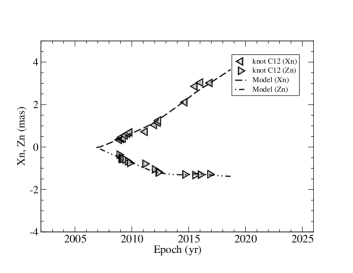
| C12 | 2006.90 | –10.08 | 8.8 | 2007.3 | 6.50.4 | -137.2 | +23.6 |
| C13L | 2004–2005 | – | – | – | – | -185.7 | – |
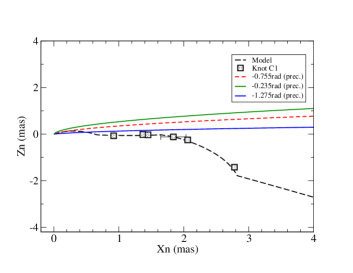
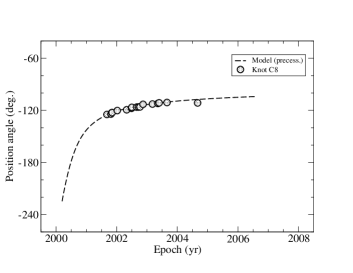
6.1 Knot C7
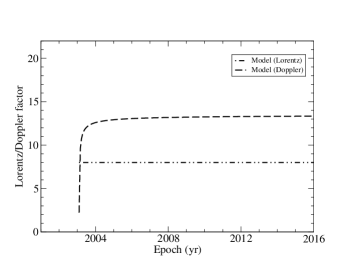
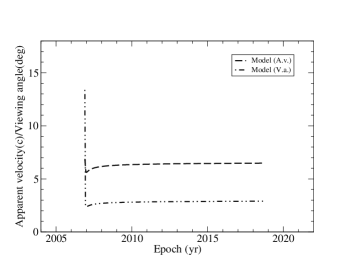
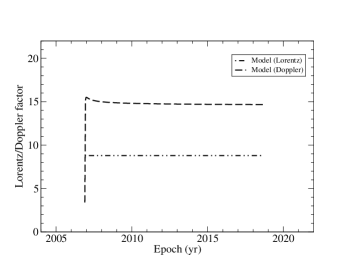
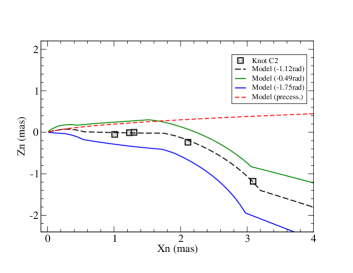
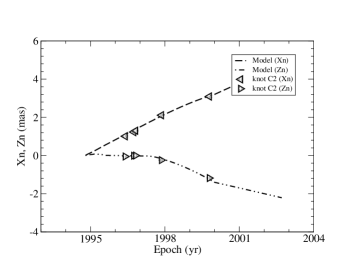
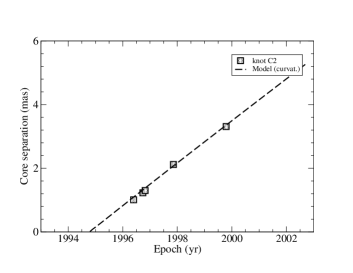
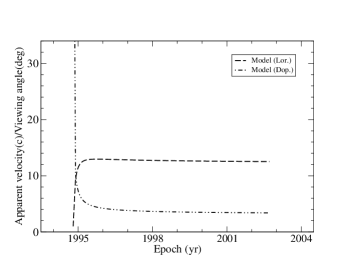
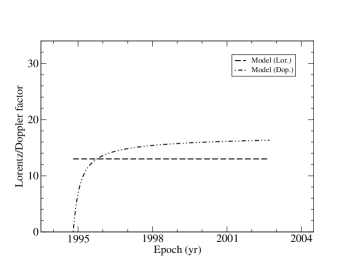
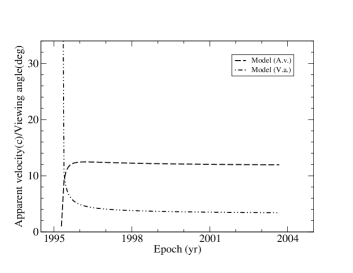
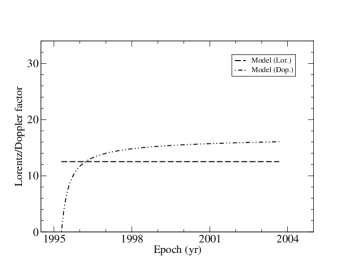
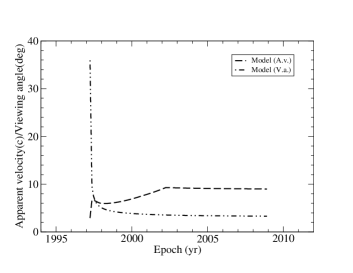
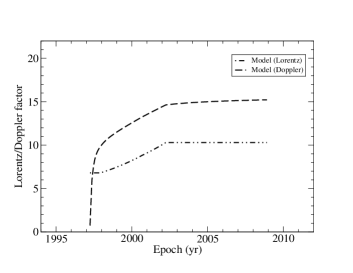
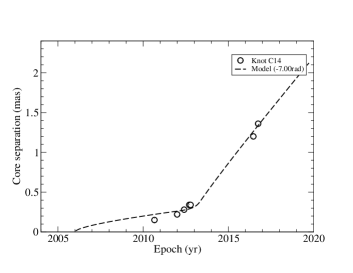
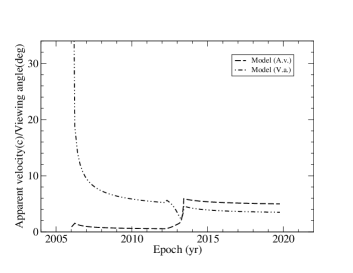
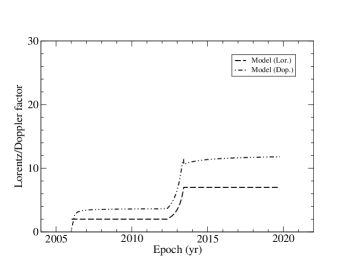
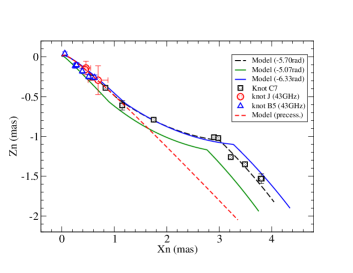
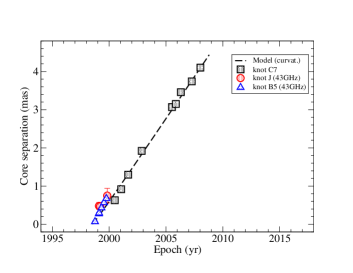
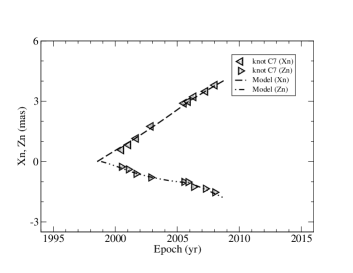
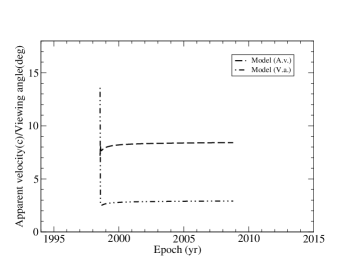
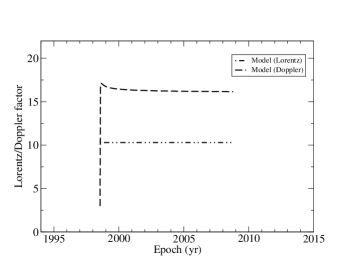
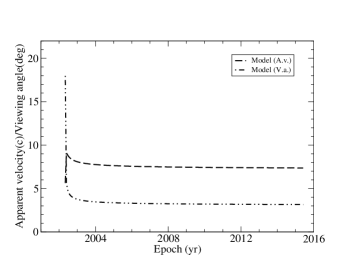
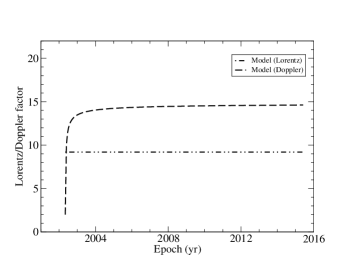
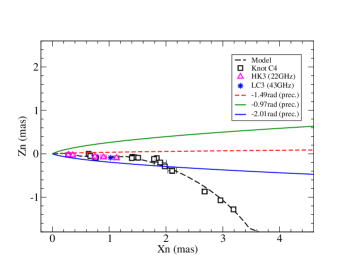
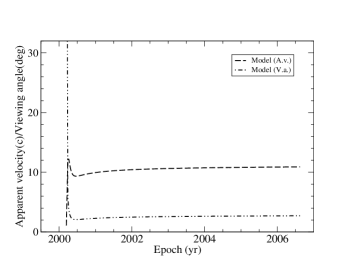
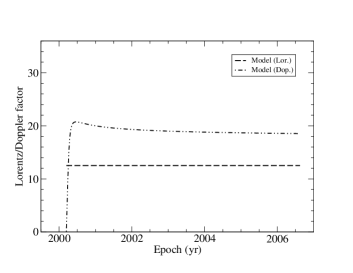
The model-fitting results are shown in Figure 5 , including trajectory , coordinates and , core separation (t), the modeled apparent velocity and viewing angle, the modeled Lorentz factor and Doppler factor.
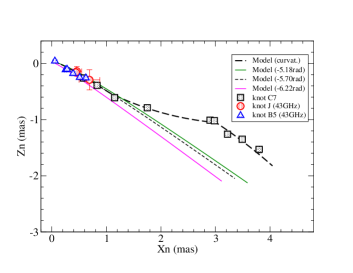
Its modeled ejection time =1998.55 and the corresponding precession phase =–5.70 rad. Within core separation =1.18 mas (or radial distance Z=25 mas=112 pc) knot C7 is modeled to move along the precessing common parabolic trajectory (=0.65 rad) and its kinematics can be well interpreted in terms of the precessing nozzle model with a precessing period of 12 yr. The 43 GHz data points given by Agudo et al. (Ag12 (2012), for knot-J) and by Jorstad et al. (Jor05 (2005) for knot B5) are also well fitted by the precessing model. In particular, Agudo et al. and Jorstad et al. measured its ejection epoch to be 1998.020.24 and 1998.610.12. The latter is extremely well consistent with our fitted value 1998.55. As Agudo et al. commented that the 43 GHz observations made by Jorstad et al. had better time sampling producing better kinematic estimates.
Beyond separation =1.18 mas its trajectory deviates from the precessing nozzle model and changes in parameter (or trajectory curvatures) have to be introduced to fit the outer trajectory: For Z=25–65 mas (rad)=0.65–0.20(Z–25)/(65–25); For Z=65–90 mas (rad)=0.45+0.07(Z–65)/(90–65); For Z90 mas =0.52 rad.
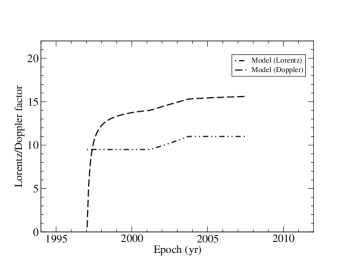
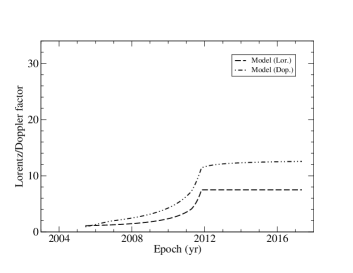
Its motion is assumed to be uniform: The modeled Lorentz factor =const.=10.3. The modeled apparent speed (shown in middle right panel of Figure 5) is consistent with the VLBI-measured proper speed 0.460.01 mas/yr (8.80.2c) given in Britzen et al. (Br18 (2018)).
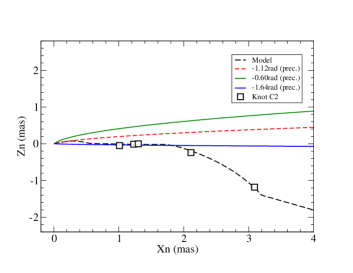
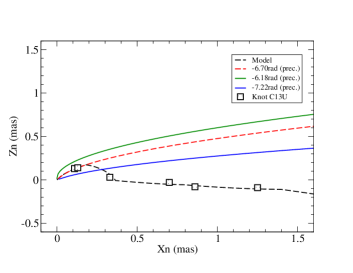
In the top left panel of Figure 5, the green and blue lines represent the modeled trajectories calculated for precession phases 0.63 rad, showing the data-points being within the position angle range defined by the two lines and indicating the precession period having been determined within an uncertainty of 1.2 yr. In the bottom right panel, the green and blue lines represent the precessing common trajectories calculated for 0.52 rad, showing a number of the data-points being within the position angle range defined by the two lines and indicating its innermost precessing common parabolic trajectory having been observed. Thus knot C7 is designated by symbol “+” in Table 3. We note that these fitting results have been used as criteria in this paper to judge the validity of our precessing nozzle scenario to investigate the kinematics of all the knots.
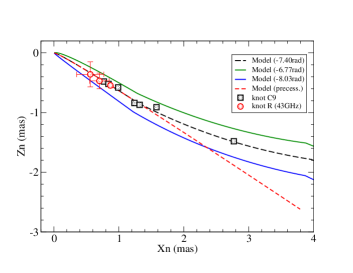
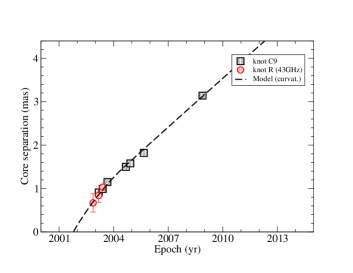
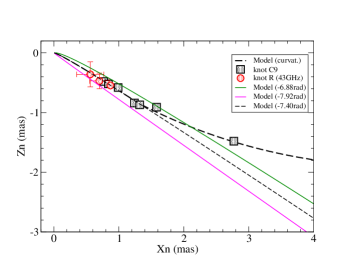
6.2 Knot C9
The model-fitting results are shown in Figure 6, including trajectory , coordinates and , core separation , the modeled apparent velocity and viewing angle and the modeled Lorentz factor and Doppler factor. Its ejection time is modeled as =2001.80 and the corresponding precession phase =–7.40 rad.
Within core separation =1.55 mas (radial distance Z=25 mas=112 pc) the observed trajectory can be well fitted by the precessing common parabolic trajectory (=0.65 rad; red dashed line in top left panel) and its kinematics can be well interpreted in terms of the precessing nozzle model. Interestingly, the 43 GHz data points measured by Agudo et al. (Ag12 (2012), for knot-R) are also well fitted. These 43 GHz data points extend its trajectory to the innermost region. Moreover, Agudo et al. derived the ejection epoch to be 2001.920.12, which is extremely well consistent with our modeled ejection time 2001.80, verifying the validity of our precessing nozzle model and confirming the precession period of 12 yr.
Thus combined with the fitting results for knot C7, we have found that for two knots (C7 and C9), both the 43 GHz and 15 GHz observations yielded similar ejection epochs, verifying the applicability of the precessing model with a precession period of 12 yr. This is really encouraging, because we only made use of the 15 GHz data to construct our precessing nozzle model and did not use the 43 GHz data in the fitting process. So the confirmation of the model-fits for knots C7 and C9 by the 43 GHz observation data points are really posterior confirmation.
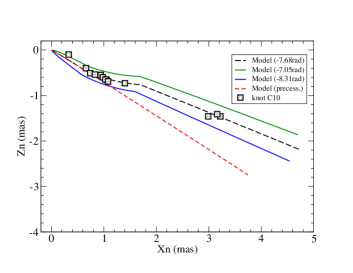
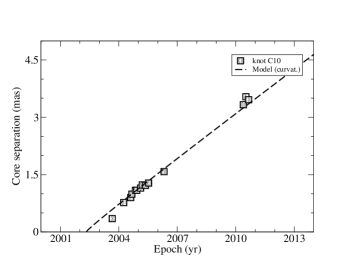
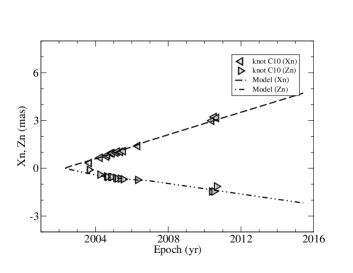
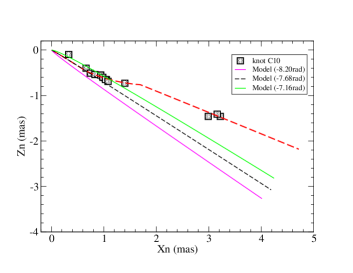
6.3 Knot C10
The model-fitting results of the kinematic features for knot C10 are shown in Figure 7, including trajectory , coordinates and , core separation , modeled apparent velocity and viewing angle, and modeled Lorentz factor and Doppler factor.
The ejection time is modeled as =2002.34, the corresponding precession phase =–7.68 rad. Within core separation =0.81 mas (radial distance Z=12 mas= 53.9 pc) knot C10 is modeled to move along the precessing common parabolic trajectory (red dashed line in top left panel). The entire modeled trajectory is shown by the black dashed line. The green and blue lines represent the modeled trajectories calculated for precession phases 0.63 rad, showing all the data-points being within the position angle range defined by the two lines and indicating the precession period having been determined within an uncertainty of 1.2 yr. In the bottom right panel the green and blue lines represent the precessing common trajectories calculated for precession phases 0.52 rad, showing a number of data-points being within the position angle range defined by the two lines and indicating its innermost precessing common parabolic trajectory having been observed. Thus knot C10 is designated by symbol “+” in Table 3.
6.4 Knots C11 and C12
We now come to discuss the model fitting of the kinematic features of knots C11 and C12.
The model-fitting of the kinematics of both knots C11 and C12 is a real challenge to our precessing jet scenario for the southern jet. The fitting results are particularly important and also a good example to reveal the advantage of our precessing jet model.
According 15 GHz VLBI-observations, knots C11 and C12 have initial position angles of and (within core separation 1.5 mas), differing only by , but their ejection time differs by 4.4 years. This feature (the small change in position angle during a large time-interval) seems very difficult to be explained in a single jet scenario with a rotation period of 20–30 yr. However, in our double jet scenario knots C11 and C12 belong to the southern jet which precesses with a period of 12 yr and the kinematics of both knots C11 and C12 can be consistently interpreted.
The model-fitting results of the kinematic features for knots C11 and C12 are shown in Figures A.1 and A.2 of the Appendix, respectively.
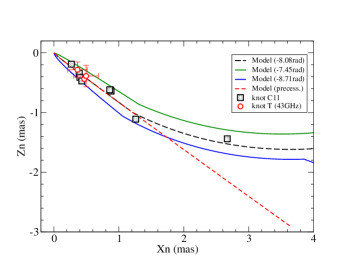
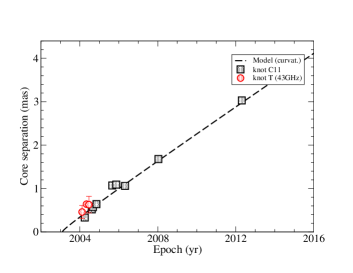
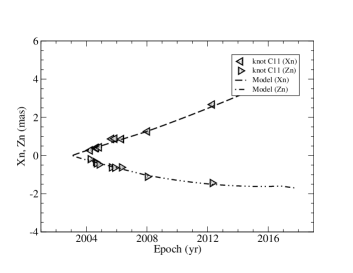
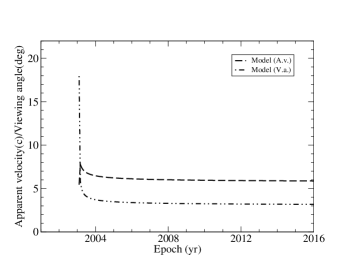
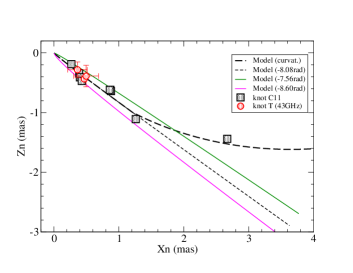
For knot C11, the model-fitting results are shown in Fig. A.1, including trajectory (), coordinates (t) and (t), core separation , the modeled apparent velocity and viewing angle, the modeled Lorentz factor and Doppler factor. Its ejection time is modeled as =2003.10 and the corresponding precession phase =–8.08 rad.
Within core separation =1.57 mas (or radial Z=25 mas=112 pc) the motion of knot C11 is modeled to follow the precessing common parabolic trajectory (=0.65 rad) and its inner kinematics can be interpreted in terms of the precessing nozzle model with a precession period of 12 yr. The entire modeled trajectory is shown by the black dashed line in the top left panel. Interestingly, the 43 GHz VLBI-observation data-points measured by Agudo et al. (Ag12 (2012), for knot-T) are also well fitted. 555Here we only adopted the three data points for knot-T before the appearance of knot-a in Agudo et al., because the appearance of knot-a might cause an uncertainty in the core identification, see Tateyama Ta13 (2013). Agudo et al. derived the ejection epoch 2003.220.34 is well consistent with our fitted value 2003.10.
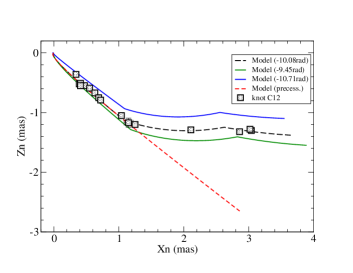
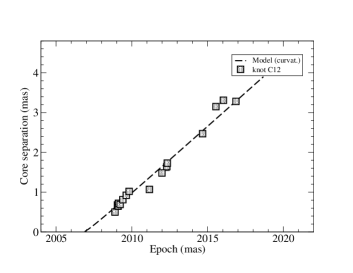
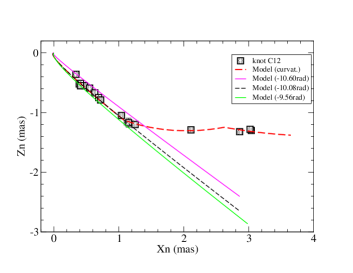
For knot C12, the model-fitting results are shown in Fig. A.2, including trajectory , coordinates (t) and (t), core separation , the modeled apparent velocity and viewing angle, and the modeled Lorentz factor and Doppler factor. Its ejection epoch is modeled as =2006.90 and the corresponding precession phase =–10.08 rad. Within core separation =1.56 mas (radial distance Z=33 mas=148 pc) the motion of knot C12 is modeled to follow the precessing common parabolic trajectory (=0.65 rad; red dashed line in the top left panel). Its entire modeled trajectory is shown by the black dashed line.
For both knots C11 and C12, their innermost precessing parabolic trajectories have been well observed, as shown in the bottom right panel of Fig.A.1 and Fig.A.2, respectively. Thus both knots are designated by symbol “+” in Table 3.
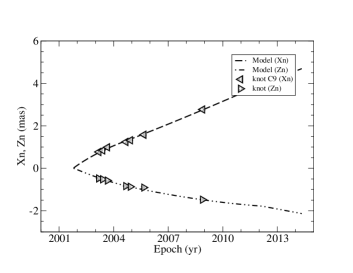
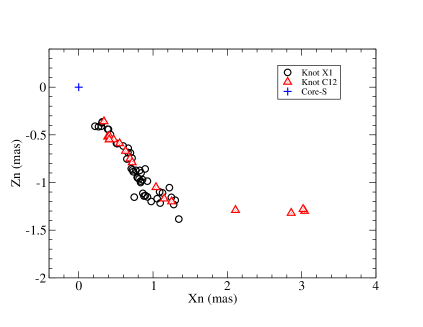
In Figure 8 we show that the trajectory of knot C12 observed at 15 GHz is coincided with that of the component-X1 observed at 43 GHz (Hodgson et al. Hod17 (2017)), if the 15 GHz core component-k (Britzen et al. Br18 (2018)) is assumed to be coincided with the 43 GHz component-S. The average position of component-S relative to the 43 GHz core (component-C) is taken to be (0.091 mas, 0.173 mas).
6.5 Knot C13L
In our double jet scenario component C13 designated by Britzen et al. (Br18 (2018)) has been divided into two components C13L and C13U, which are attributed to the southern and northern jets, respectively.
We will show that the kinematics of knot C13U can be consistently fitted with the other components of the northern jet in a precessing nozzle model. Component C13L was observed only at three epochs at position angles during (2009.09–2009.41) and seems to be quasi-stationary and disappeared rapidly. Thus it could not be taken into the model-fitting together with the other knots of the southern jet. As a possible explanation, knot C13L and the core component-k observed at 15 GHz might form a pair of cores, corresponding to the 43 GHz pair cores formed by components-C and -S designated in Hodgson et al. (Hod17 (2017)) and the component C13L was not observed after 2009.4 due to its opacity at 15 GHz.
| Knot | (mas) | Z(mas) | Z(pc) | status |
|---|---|---|---|---|
| C7 | 1.18 | 25 | 112 | + |
| C9 | 1.55 | 25 | 112 | + |
| C10 | 0.81 | 12 | 53.9 | + |
| C11 | 1.57 | 25 | 112 | + |
| C12 | 1.56 | 33 | 148 | + |
6.6 A brief summary for the southern jet
The kinematic features of all the superluminal components of the southern jet (C7, C9, C10, C11 and C12) are consistently fitted in terms of the precessing parabolic jet-nozzle model with a precession period of 12 yr, thus providing clear evidence for the jet precession and supporting the double jet scenario. We summarize briefly the model-fitting results as follows.
-
•
Within core separations 0.81.5 mas all the superluminal components (C7, C9, C10, C11 and C12) can be well modeled to move along the precessing common parabolic trajectory, indicating that their inner trajectories consistently to follow the precessing nozzle model (referring to Qian et al. Qi91 (1991), Qi09 (2009), Qi14 (2014), Qi17 (2017), Qian Qi11 (2011), Qi12 (2012), Qi13 (2013), Qi15 (2015), Qi16 (2016)).
-
•
Beyond these core separations their paths deviate from the model and changes in parameter are introduced to explain their outer trajectories. As shown in Table 1, their trajectory curvatures are all positive: =[(2 mas)– (2 mas)]0, i.e., their outer trajectories are curved upward. This is just opposite to the curvature direction for the superluminal components of the northern jet (see below).
-
•
The modeled precession period is 12 yr, similar to the period determined from the optical light curve (Sillanpää, Si88 (1988), Valtonen et al. Va16 (2016)), indicating that the periodic behavior in optical and radio regimes may originate from a common mechanism. As viewed along the line of sight the jet precesses clockwise (Figs 4 and 8).
-
•
The (projected) jet cone spans a position angle range from to with an aperture of and the viewing angle varies in a range from to (see Figure 14 below). The position angle of the precession axis is .
-
•
The modeled ejection times for knots (C7, C10, C11 and C12) are (1998.55, 2002.33, 2003.10, 2006.90), which are well consistent with those (1998.9, 2002.5, 2002.9, 2007.3) obtained from the 15 GHz VLBI- measurements with differences 0.20.4 yr (see Table 1). In particular, the modeled ejection epochs for knots C7 and C9 are confirmed by the 43 GHz observations (Agudo et al. Ag12 (2012), Jorstad et al. Jor05 (2005)). This strongly supports the modeled precession period of 12 yr for the southern jet.
-
•
For knots C7, C9 and C11 the 43 GHz data given in Agudo et al. (Ag12 (2012)) and Jorstad et al. (Jor05 (2005)) were used to extend the observations to smaller core separations and they were also well fitted by our precessing nozzle model. This is really a posterior test supporting the precessing parabolic trajectory model, because we did not use the 43 GHz data to construct the model. In particular, our modeled ejection epoch for knot C9 is 2001.80, being one year later than that (2000.80) obtained from the 15 GHz-VLBI measurements. But the modeled ejection epoch for knot C9 is closely consistent with the ejection epoch obtained by the 43 GHz VLBI measurements (Agudo et al. 2012, knot-R: =2001.920.12). This consistency of ejection epochs is significant, verifying our precessing jet nozzle model and the 12 yr precession period.
-
•
Knots C11 and C12 were observed at similar position angles, but their ejection epochs differ by four years. The interpretation of the kinematic features of both knots C11 and C12 in terms of our precessing jet nozzle model is a real success and particularly instructive, demonstrating the validity and flexibility of the model.
-
•
We find that knot C8 does not belong to the southern jet and reveals kinematic features distinct from knots C7 to C12. Its kinematic features will be interpreted consistently with the superluminal components of the northern jet in terms of another precessing nozzle model (see Sect.7 below). The division of knot C8 from the group of superluminal knots (C7, C9, C10, C11 and C12) is significant for understanding the entire phenomenon observed in OJ287.
-
•
In Table 3, we summarize the core separations and the corresponding axial distance (Z) within which the knots are modeled to follow the precessing common parabolic trajectory. It can be seen that for all the superluminal components (C7 to C12) their inner trajectories (in the axial distance range from 50 pc to 150 pc) have been observed to follow the precessing common parabolic trajectory. This indicates that the 12 yr precession period and the parabolic trajectory pattern may be really applicable to the southern jet.
7 Model-fitting results for northern jet
We now come to discuss the model fitting results for the northern jet components.
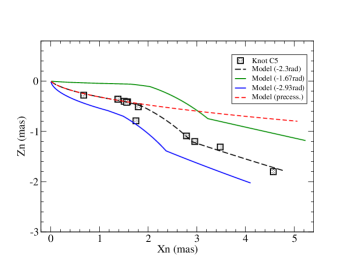
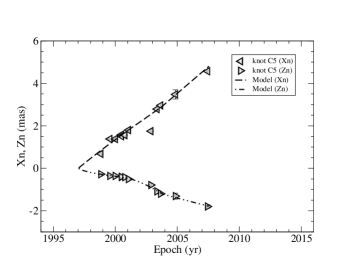
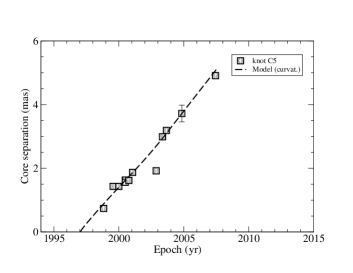
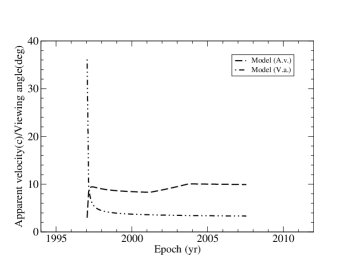
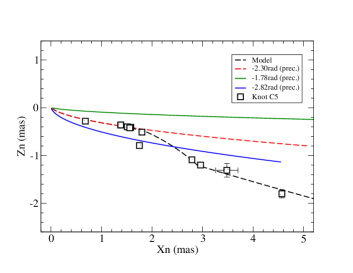
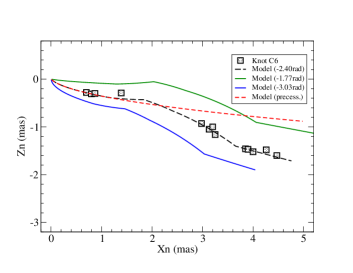
The entire structure of the northern jet is shown in Figure 9. It consists of nine superluminal components (C1, C2, C3, C4, C5, C6, C8, C13U and C14). We note that knots C1, C2, C3, C4, C5 and C6 all have downward curvatures in their trajectories beyond a core separation 2 mas (=[(2 mas)– (2 mas)]0). This is different from that in the southern jet, where all the knots have upward curvatures in trajectory. This can be regarded as another clue for the double jet structure.
Through analyzes and trial model-fittings of the kinematics for the northern jet components we select the model parameters as: =12 yr, =, =0.0 rad, =0.1340 and =0.5, which are listed in Table 4. The values for and are different from those assumed for the southern jet (=0.65 rad and =0.0536), implying the northern jet having a different orientation in space and a different precessing common parabolic trajectory pattern.
The ejection epoch () of the knots is related to the precession phase () as:
| (16) |
Here =–0.755 represents the precession phase of knot C1,
corresponding to its ejection epoch =1994.10. Some modeled parameters
and relevant observation data
are listed in Table 5.
| 12 yr | |
| 0.0524 rad= | |
| 0.0 rad= | |
| 0.1340 | |
| 0.5 |
| Knot | (deg.) | (deg.) | |||||
|---|---|---|---|---|---|---|---|
| C1 | 1994.10 | –0.755 | 13.5 | 1994.1 | 13.41.0 | -92.4 | -14.6 |
| C2 | 1994.80 | –1.12 | 13.0 | 1994.8 | 13.00.4 | -91.2 | -12.6 |
| C3 | 1995.29 | –1.38 | 12.5 | 1995.3 | 12.00.4 | -91.5 | -18.6 |
| C4 | 1995.50 | –1.49 | 11.4 | 1995.5 | 11.10.2 | -93.5 | -12.8 |
| C5 | 1997.05 | –2.30 | 9.5–11.0 | 1997.1 | 9.00.2 | -107.1 | -4.3 |
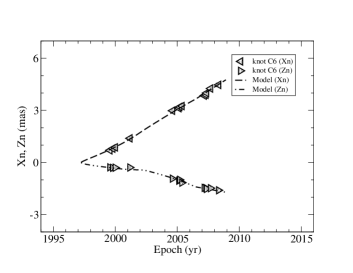
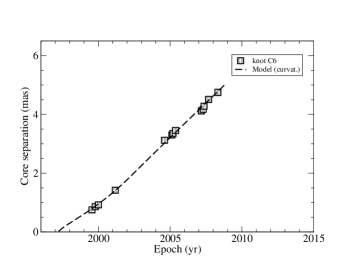
| C6 | 1997.24 | –2.40 | 6.8–10.3 | 1997.9 | 8.80.2 | -108.4 | -0.9 |
| C8 | 2000.20 | –3.95 | 12.5 | 2000.1 | 8.60.2 | -117.2 | +5.8 |
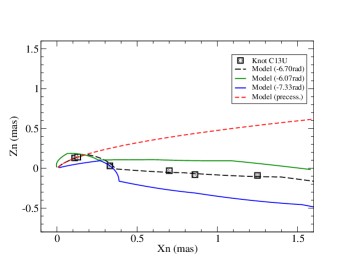
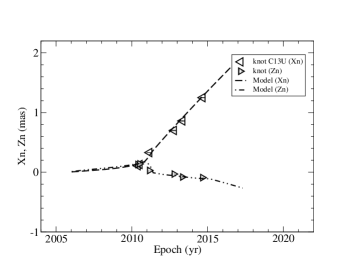
| C13U | 2005.45 | –6.70 | 1.1–7.5 | – | – | -75.3 | – |
| C14 | 2006.03 | –7.00 | 2.0–7.0 | – | – | -64.1 | – |
7.1 Knot C1
It is found that knots C1, C2, C3 and C4 have very similar trajectories within core separation 2 mas. This might imply that in order to explain their ejections at different times, their innermost tracks should deviate from the precessing common trajectory at different separations.
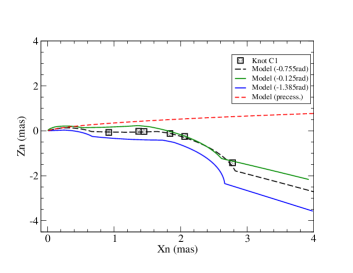
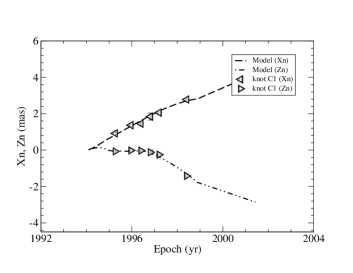
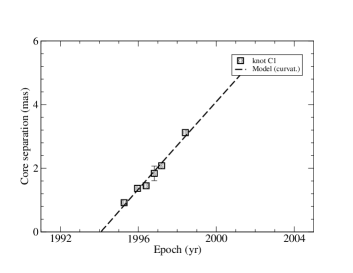
The model-fitting results for knot C1 are shown in Figure 10, including trajectory , coordinates and , core separation , the modeled apparent velocity and viewing angle, the modeled Lorentz/Doppler factor. Its ejection time is modeled as =1994.10 and the corresponding precession phase =-0.755 rad.
Within core separation =0.23 mas (radial distance Z=1.6 mas=7.18 pc) knot C1 is modeled to move along the precessing common parabolic trajectory (=0.0 rad; red dashed line in the top left panel of Fig.10). Beyond this separation changes in parameter (i.e. trajectory curvatures) are introduced to explain its outer path: For Z=1.6–7.0 mas (rad)=0.45(Z–1.6)/(7.0–1.6); For Z=7–22 mas (rad)=0.45–0.15(Z–7)/(22-7); For Z=22–25 mas (rad)=0.30+0.028(Z–22)/(25–22); For Z=25–50 mas (rad)=0.328+0.444(Z–25)/(50–25); For Z50 mas =0.772 rad. The entire modeled trajectory is shown by the black dashed line.
The modeled Lorentz factor =const.=13.5. The modeled apparent velocity is well consistent with the VLBI-measured proper speed 0.700.05 mas/yr (13.41.0 c) given in Britzen et al. (Br18 (2018)).
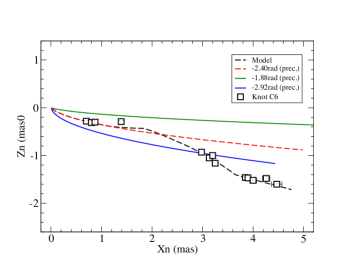
In the top left panel of Figure 10 two additional lines (green and blue) represent the modeled trajectories calculated for precession phases 0.63 rad, showing that most of the data-points are within the position angle range defined by the two lines and the precession period having been determined within an uncertainty of 1.2 yr. In the bottom right panel the green and blue lines represent the precessing common trajectories calculated for 0.52 rad, showing that no data-points are within the position angle range defined by the two lines and its innermost precessing common trajectory having not been observed (no observation data available). Thus knot C1 is designated by symbol “–” in Table 6.
7.2 Knots C2/C3 and C5/C6
The model-fitting results of the kinematic features for knots C2/C3 and C5/C6 are shown in Figures A.3/A.4 and A.5/A6 of the Appendix, respectively. These include trajectory , coordinates and , core separation , the modeled apparent velocity and viewing angle, the modeled Lorentz factor and Doppler factor.
The ejection times are modeled as =1994.80, 1995.29, 1997.05 and 1997.24 and the corresponding precession phases are =–1.12 rad, –1.38 rad, –2.30 rad and –2.40 rad.
As the model-fitting for knot C1, their motion in the innermost regions are modeled to follow the precessing common parabolic trajectory. But in the outer regions changes in parameter (or trajectory curvatures) are introduced to explain their outer trajectories. These model-fittings also indicate the precession period has been determined within an uncertainty of 1.2 yr and their initial parabolic trajectories have been observed. (See captions of Figs. A.3/A.4 and A.5/A.6).
7.3 Knot C4
The model-fitting results for knot C4 are shown in Figure 11. Its ejection epoch is modeled as =1995.50 and the corresponding precession phase =1.49 rad. The entire trajectory is model-fitted by the black dashed line in top left panel of Fig.11.
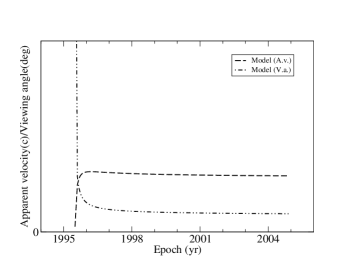
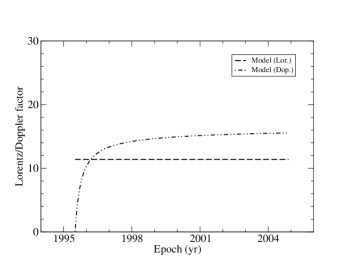
To fit its core separation versus time, its motion is modeled to be uniform: =const.=11.4. The modeled apparent velocity is consistent with the VLBI-measured proper speed 0.580.01 mas/yr (=11.10.2) given in Britzen et al. (Br18 (2018)).
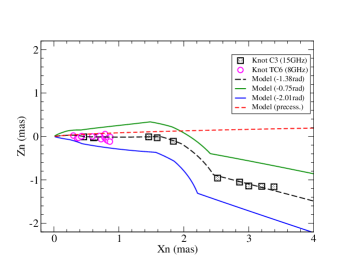
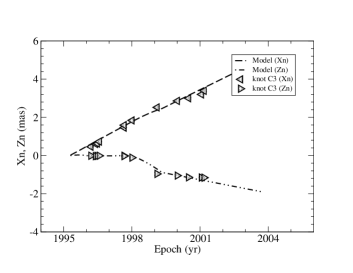
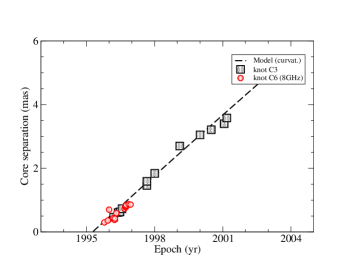
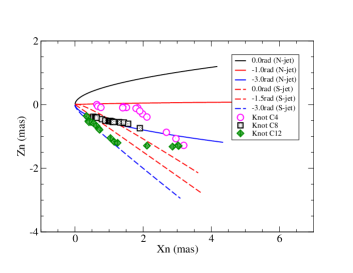
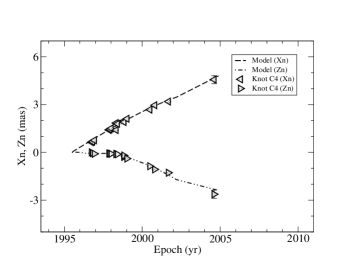
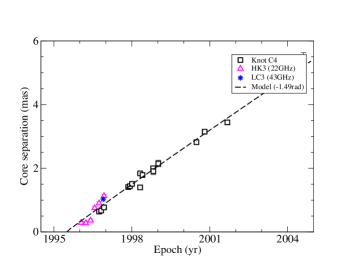
Interestingly, the data given in Homan et al. (Hom01 (2001), 22 GHz, for knot-K3) and in Lister et al. (Li98 (1998), 43 GHz for knot-C3) are also well fitted by the model. Moreover, Tateyama et al. (Ta99 (1999)) derived the ejection epoch to be =1995.4, which is quite similar to our modeled ejection epoch =1995.50. The consistency of these observations provides a strong support to our precessing nozzle model with a precession period of 12 yr.
In top left panel of Figure 11, the green and blue lines represent the modeled trajectories calculated for precession phases 0.63 rad, showing most of the data-points within the position angle range defined by the two lines and the precession period having been determined within an uncertainty of 1.2 yr. In bottom right panel of Fig.11, the green and blue lines represent the precessing common parabolic trajectories calculated for 0.52 rad, showing a number of data-points within the position angle range defined by the two lines and its innermost precessing common trajectory having been observed. Thus knot C4 is designated by symbol “+” in Table 6.
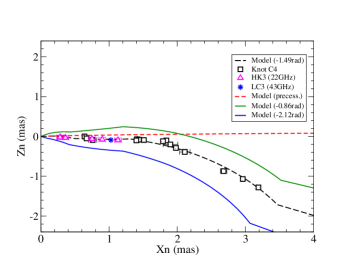
7.4 Knot C8
The model-fitting results of the kinematic features for knot C8 is particularly important for our double jet scenario.
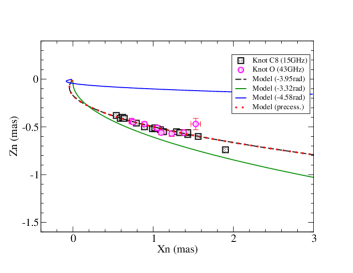
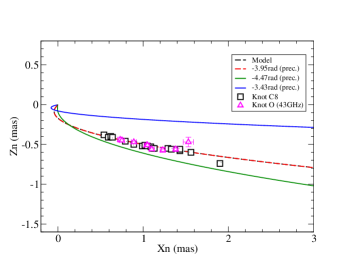
Firstly we note that knot C8 was observed to be ejected at 2000.1, and knots C9 and C10 were ejected at 2001.80 and 2002.33 . The three knots were observed to have similar position angles within 1.2 mas at 15 GHz: (knot C8), (knot C9) and (knot C10). This seems to indicate that they are ejected from the same jet consecutively. But through detailed analyzes we found that knot C8 has kinematic features distinct from those of knots C9 and C10: (i) It moves apparently across the paths of knots C9 and C10; (ii) At core separations between 1.0 mas and 1.6 mas its trajectory is curved becoming horizontal, typical for the components of the northern jet. This is different from the trajectories of the components C9 and C10 which move ballistically 666Knots C9 and C10 move along parabolic trajectories in space and their apparent ballistic motions are caused by projection effects onto the plane of the sky. within core separation 2 mas with position angles ; (iii) its kinematics can be consistently interpreted with the knots (C4, C5, C6, C13U and C14) of the northern jet in terms of a precessing jet nozzle model as shown in Figure 12. 777Note that the values of parameters and for the northern jet are different from those for the southern jet.; (iv) In particular, knot C8 moved non-ballistically and its path (in the observed separation range 0.65 mas to 2 mas) can be extremely well fitted by the precessing common parabolic trajectory assumed for the northern jet (top left panel in Fig.12); (v) Interestingly, its trajectory observed at 43 GHz by Agudo et al. (Ag12 (2012)) is extremely well coincided with the trajectory observed at 15 GHz. The consistency of the trajectories observed at 15 GHz and 43 GHz may imply that there is no opacity effects between the two frequencies in the outer jet regions (core separations from 0.5 mas to 2 mas).
The model-fitting results for knot C8 are shown in Figure 12. Its ejection epoch is model-fitted to be =2000.20 and the corresponding precession phase =3.95 rad. It can be seen that the trajectory, coordinates and core separation in the observed separation range 0.65 mas to 2.0 mas (Z=17.6 mas to 49.1 mas, or 79.0 pc to 220.5 pc) are all well fitted by the precessing nozzle model.
This is the best case verifying the validity of the parabolic trajectory pattern applicable to describe the knot’s trajectory within radial distance 200 pc.
In top left and bottom right panels of Fig.12, the 43 GHz observation data points measured by Agudo et al.(Ag12 (2012), for knot-O) are extremely well modeled. Combined with the 15 GHz data, they convincingly show its non-ballistic motion and entire trajectory fitted perfectly by the parabolic precessing nozzle model (red dashed line in the top left panel of Fig.12).
Moreover, the ejection epoch measured by Agudo et al. (Ag12 (2012)) was 2000.160.03, which is almost exactly equal to our modeled epoch for knot C8 (2000.20), providing a strong support to our precessing nozzle model with a precession period of 12 yr assumed for the northern jet.
In top left panel of Figure 12, the green and blue lines represent the modeled trajectories for precession phases 0.63 rad, indicating all the data-points within the position angle range defined by the two lines and the precession period having been determined within an uncertainty of 1.2 yr. In bottom right panel of Fig.12, the green and blue lines represent the precessing common trajectories calculated for 0.52 rad, showing all the data-points within the position angle range defined by the two lines and indicate its innermost precessing common trajectory having been observed. Thus knot C8 is designated by symbol “+” in Table 6.
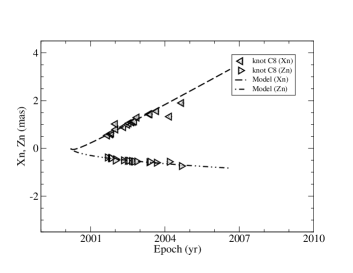
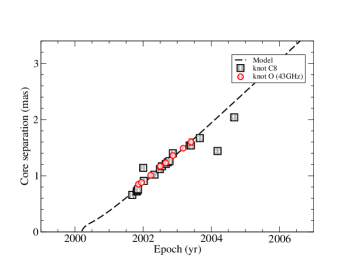
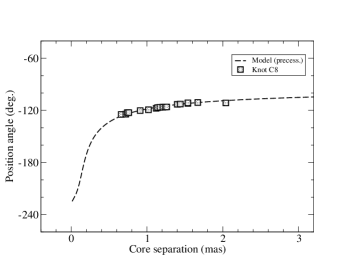
In Figure 13 the relations of the position angle vs core separation and the position angle vs time are shown, indicating that the position angle of knot C8 monotonically changed () along its trajectory during the observation period 2001.5–2004.0 (from –() to – (); Britzen et al. Br18 (2018)). Thus the motion of knot C8 is definitely non-ballistic. Ballistic precessing jet models seem inapplicable to OJ287.
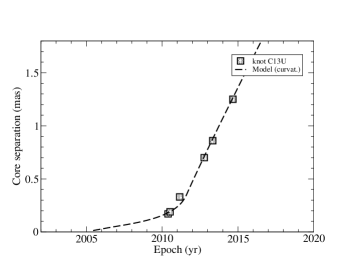
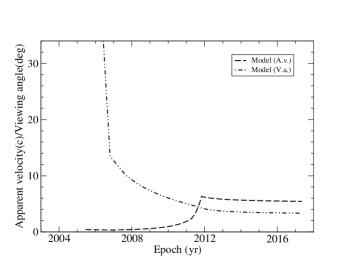
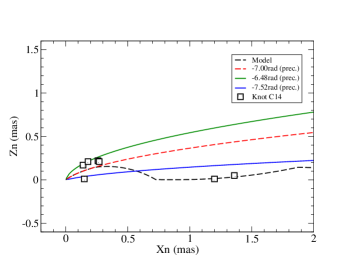
7.5 Knots C13U and C14
Knots C13U and C14 are very strong superluminal components. Their initial flux densities reached to 2–3 Jy (at 15 GHz), but with very slow apparent speeds. They might be associated with the optical double peaked outburst during the period of 2005–2007. The ejection of components C13U and C14 may represent the re-starting of the activity of the northern jet after a 5 yr quiescent period since the last ejection of knot C8.
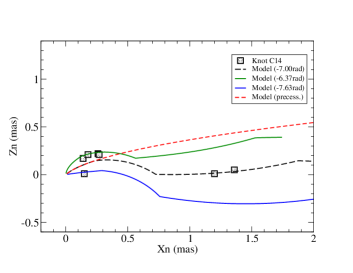
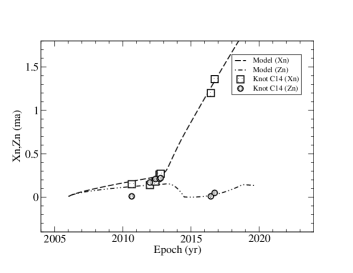
The model-fitting results of the kinematics for knots C13U and C14 are shown in Figures A.7 and A.8 of the Appendix, respectively. For knot C13U (Fig.A.7), its motion is modeled to follow the precessing common parabolic trajectory within core separation 0.25 mas 888As shown in Fig.A.7 (top left panel) a change of in the position angle of knot C13U was observed during the period 2010.39–2014.67 (Britzen et al. Br18 (2018).) Thus its motion was non-ballistic. and its innermost parabolic trajectory has been observed. For knot C14 (Fig.A.8), its motion is modeled to follow the precessing common parabolic trajectory within core separation 0.27 mas and its innermost parabolic trajectory has been observed. See captions of Fig.A.8 of the Appendix.
| Knot | (mas) | Z(mas) | Z(pc) | status |
|---|---|---|---|---|
| C1 | 0.23 | 1.60 | 7.18 | – |
| C2 | 0.25 | 1.60 | 7.18 | – |
| C3 | 0.25 | 1.60 | 7.18 | + |
| C4 | 0.16 | 0.8 | 3.59 | + |
| C5 | 1.55 | 20 | 89.8 | + |
| C6 | 1.19 | 15 | 67.4 | + |
| C8 | 2.0 | 49.1 | 220 | + |
| C13U | 0.25 | 2.0 | 9.0 | + |
| C14 | 0.27 | 2.0 | 9.0 | + |
7.6 A brief summary for northern jet.
The main results for the northern jet can be summarized as follows.
-
•
The kinematics of the nine superluminal components can be consistently model-fitted in terms of a parabolic processing jet-nozzle model with a precession period of 12 yr, same as that for the southern jet and the optical period (Sillanpää Si88 (1988), Valtonen et al. Va16 (2016)). The jet precesses clockwise, also similar to the southern jet.
-
•
The modeled jet cone spans from PA= to PA= (at core separation 0.5 mas) with the precession axis at PA=–, which is different from that of the southern jet precession axis at (see Figure 2).
-
•
Six out of the nine superluminal components (knots C1 to C6) have been observed downward curvatures in their outer trajectories (2 mas), opposite to the upward curvatures for the southern jet components.
-
•
For seven out of the nine knots (C3 to C14), their innermost motion have been observed to follow the precessing common parabolic trajectory (Table 6).
-
•
The modeled ejection times are well consistent with VLBI-measurements (Britzen et al. Br18 (2018)). In particular, the ejection times modeled for knots C3, C4 and C8 are extremely well confirmed by the VLBI-measurements at 43GHz, 22 GHz and 8 GHz (Agudo et al. Ag12 (2012), Homan et al. Hom01 (2001), Lister et al. Li98 (1998), Tateyama et al. Ta99 (1999)), providing convincing evidence of the 12 yr precession period. These are really posterior verifications, because we didn’t use these data in the construction of the precessing nozzle model.
-
•
The kinematics of knot C8 can be consistently model-fitted with the other eight components in terms of a precessing jet nozzle model with model parameters, different from those for the southern jet. Its outer trajectory (observed at 15 GHz and 43 GHz) was extremely well fitted by the modeled parabolic trajectory. Moving along the parabolic trajectory knot C8 should have changed its position angle from – to – after its emergence from the core (see Fig.13). Similar behavior has been observed in the motion of the superluminal knots in blazar 3C279 (e.g., knots C30–C32; Qian et al. Qi18 (2018), Jorstad et al. Jor17 (2017), Lu et al. Lu13 (2013)).
-
•
We find that during the period of 1997–2007, the northern jet and southern jet launched superluminal components alternatively. Our model-fitting procedure disentangled the kinematic features of these components, thus demonstrating the 12 yr precession period for both the jets.
8 Correlation between optical outbursts and radio knot ejections
As Britzen et al. (Br18 (2018)) and Tateyama et al. (Ta99 (1999)) point out that there is a notable similarity between the optical and radio light curves, even small variations on the radio light curves coinciding with the optical flares. And the optical double-peaked outbursts are associated with the emergence of superluminal components from the core (Valtaoja et al. Val20 (2000)). We collected relevant data from the literature (Gabuzda et al. Ga89 (1989), Tateyama et al. Ta99 (1999), Valtaoja et al., Val20 (2000), Valtonen et al. Va08 (2008), Britzen et al. Br18 (2018)) and made the Table 7 to investigate the association of the double-peaked optical outbursts and radio component ejections. It is found that all the double-peaked optical outbursts are associated with the emergence of superluminal components launched from the northern jet, which has been working for more than 40 years. In contrast, the emergence of knots C7–C12 launched from the southern jet had nothing to do with the appearance of the double-peaked optical outbursts.
| Starting times | radio knot | ejection epoch | ejection PA | jet ID |
| 1971.08/1972.94 | G–K1 | 1969.7 | N-jet | |
| 1982.96/1984.10 | T–K3 | 1982.3 | N-jet | |
| 1994.69/1995.84 | B–C1 | 1994.10 | N-jet | |
| B–C2 | 1994.80 | N-jet | ||
| B–C3 | 1995.29 | N-jet | ||
| B–C4 | 1995.50 | N-jet | ||
| 2005.75/2007.69 | B–C13U | 2005.45 | N-jet | |
| B–C14 | 2006.03 | N-jet | ||
| 2015.87 | B–X | 2014.67 | N-jet | |
| 2001–2003 | B–C8 | 2000.1 | N-jet | |
| B–C9 | 2000.8 | S-jet | ||
| B–C10 | 2002.5 | S-jet | ||
| B–C11 | 2002.9 | S-jet |
Here we would pose the interesting and important question: why the northern jet is much active than the southern jet? This phenomenon is very similar to that observed in blazar 3C279 (Qian et al. Qi18 (2018)) and may be explained similarly by HD/MHD theories for cavity-accretion processes in near equal-mass binary black hole systems. According to hydrodynamic and magnetohydrodynamical simulations of the dynamics for these supermassive binary systems (Tanaka Tan13 (2013), Shi et al. Sh12 (2012), Artymovicz Art98 (1998)), gas streams preferentially accrete onto the secondary black hole and the jet produced by the secondary hole will be much more active than the jet produced by the primary hole. Thus in our double-jet scenario for OJ287, the northern jet may be produced by the secondary hole. This attribution seems verified by the aperture width of the northern jet which is much larger than the aperture of the southern jet (ascribed to the primary hole).
9 Summary
Our precessing double-jet nozzle model involves two assumptions. (1) OJ287 has a double-jet structure and superluminal components are ejected form each of the precessing jet nozzle; (2) the superluminal knots move along respective common parabolic trajectories. 999Generally, precessing common trajectories can also be rectilinear, conical or helical. These assumptions are based on some available observations and can be understood in terms of magnetohydrodynamic theory for the formation, collimation and acceleration of relativistic jets in blazars (Qian et al. Qi17 (2017), Blandford & Znajek Bl77 (1977), Blandford & Payne Bl82 (1982), MacDonald & Thorne Mac82 (1982), McKinney et al. Mc12 (2012), Beskin & Zheltoukhov Be13 (2013), Asada & Nakamura As12 (2012), Nakamura & Asada Na13 (2013), Mizuno et al. Miz15 (2015), Marti et al. Mart16 (2016), Mutel & Denn Mu05 (2005), Stirling et al. St03 (2003), Cohen et al. Co16 (2016), Polko et al. Po13 (2013), Po14 (2014), Vlahakis & Königl Vl04 (2004)).
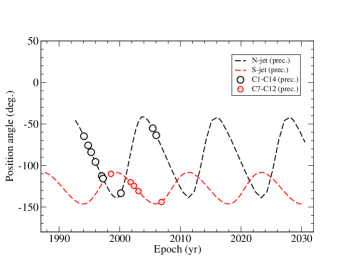
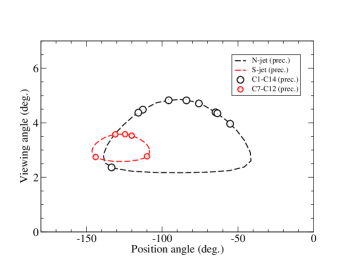
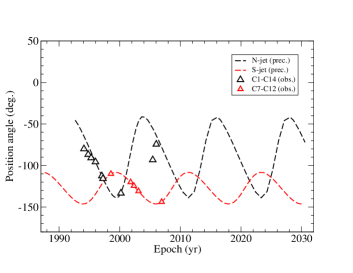
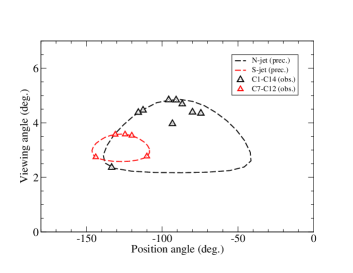
We suggest that blazar OJ287 may have a double-jet structure produced by a supermassive black hole binary. Its northern jet and southern jet have different orientations and cone sizes in 3-dimensional space. Both relativistic jets precess clockwise with the same period of 12 yr, closely equal to the period of optical double-peaked outbursts. In Figure 14 the modeled and observed relations of jet position angle vs time and vs viewing angle are shown to demonstrate the relative distributions of the ejection of the superluminal knots from the two jets.
It is particularly important to note that the northern jet is much more active than the southern jet, producing all the five optical double-peaked outbursts. This preferential behavior of the northern jet is very similar to the phenomenon observed in blazar 3C279 (Qian et al. Qi18 (2018), Cheung Che02 (2002), de Pater & Perley deP83 (1983)). In the double-jet structure of 3C279, one jet has been very active and extends to kpc-scales, but the other jet has no trails on kpc-scales.
The differential activities of the two jets derived for both 3C279 and OJ287 could be well understood in terms of HD/MHD theory for the accretion processes occurring in supermassive black hole binary systems. According to the HD/MHD simulation results for cavity-accretion processes in near equal-mass binary systems, gas streams preferentially accrete onto the secondary hole (Artymowicz & Lubow Ar96 (1996), Cuadra et al. Cu09 (2009), Shi et al. Sh12 (2012), Tanaka Ta13 (2013), D’Orazio et al. Do13 (2013)). This naturally explains why the northern jet of OJ287 has been highly active in producing all the major optical double-peaked outbursts during the past 45 years (see Table 7), if the northern jet is identified as the jet produced by the secondary hole.
| 0.88 | 2.96 | 4.32 | 13.7 | |
| 0.26 | 0.89 | 1.30 | 4.11 |
Since both jets have the same precession period of 12 yr, the precession of the jets may be originated from the binary motion: the direction of the jets is modulated by the change of their orbital velocity directions relative to the observer (e.g., Roos et al. Ro93 (1993), Kaastra & Roos Kaa92 (1992), Qian et al. Qi17 (2017), Qi18 (2018)). In this case the total mass and mass-ratio of the binary could be estimated from the observed jet apertures (see Fig.14), which depend on the parameter and the orbital velocities of the holes. If a jet produced in a binary system has a precession (or swing) caused by the orbital motion of its associated hole, then its jet-aperture should be approximately equal to / (–the orbital velocity of the hole and c–the velocity of the jet; e.g., Artymovicz & Lubow Ar96 (1996)). Thus the mass ratio q=m/M of the binary could be approximately estimated as the ratio of the observed jet apertures. For OJ287 this ratio is on order of 0.3 (see Fig.14). The total mass m+M of the binary could be estimated from the following formula (see Qian et al. Qi17 (2017), Qi18 (2018)):
| (17) |
is the orbital velocity of the secondary hole, approximately equal to , is half the northern jet cone aperture (de-projected). is the orbital period in the source frame. In the present model for OJ287 9.2 yr, . In Table 8 the estimations of the masses of the binary holes are listed as function of parameter . It can be seen that the total mass is 1.5, if . Obviously, we have found a new and independent method to determine the masses of a supermassive black hole binary through the measurement of its double jet precession.
As a supermassive binary system should emit gravitational waves (Einstein Ei16 (1916), Ei18 (1918)) during its in-spiral process and coalescence. Since the binary system in OJ287 may have an orbital motion on a sub-parsec scale, there might have the possibility to follow its orbital motion in the sky, e.g., by using GRAVITY instrument (Eisenhauer et al. Eis11 (2011)).
10 Discussion
The phenomena observed in OJ287 at optical and radio wavelengths have been extensively investigated and interpreted by many authors from various aspects (e.g., Sillanpää et al. Si88 (1988); Lehto & Valtonen Le96 (1996); Sundelius et al. Su97 (1997); Valtaoja et al. Val20 (2000); Villforth et al. Vil10 (2010); Villata et al. Villa98 (1998); Tanaka Ta13 (2013), Qian Qi15 (2015), Britzen et al. Br18 (2018)). But several basic issues still need to be clarified: e.g., the mass and mass-ratio of the binary system, jet precession period, nature of optical outbursts, interaction between the binary black holes and the accreting material and magnetic field, accreting flow patterns, correlation between the optical and radio variability, association of the optical outbursts with the formation and emergence of superluminal knots and so on (e.g., referring to the comments made by Villforth et al. Vil10 (2010) on most of the existing binary black hole models).
For demonstrating the main physical processes involved in the OJ287 phenomena, we will concentrate on the comparison of three existing models.
10.1 Precessing binary model
In the precessing binary model Lehto & Valtonen (Le96 (1996)) concentrated on the interpretation of the four distinct features of the OJ287 phenomena: (1) periodic double-peaked outbursts with a period of 11–12 yr; (2) the time-intervals of 1–2 yr between the two peaked outbursts; (3) the first flares of the double-outbursts having sharp rising phases with time-scales of 10 days and zero polarization; (4) non-periodic optical flares with high polarization degrees.
This is a binary black hole model with an extremely small mass ratio (m:M = 0.007:1) and a high orbital inclination. According to this model, the regular orbital motion of the secondary black hole around the primary provides the periodicity of 12 yr. The two disk-crossings per pericenter passage of the secondary hole penetrating the accretion-disk of the primary hole cause the double-peaked outbursts with a time interval of 1–2 yr. The first optical flares with steep rising phases are assumed to be produced by the evolving gas-bubbles torn out from the primary disk. The emission of the gas-bubbles are originated from bremsstrahlung mechanism and is non-polarized (zero polarization degree). For interpreting the non-periodic optical outbursts, the model assumes that the tidal disturbances in the primary disk induced by the secondary hole impactings during its pericenter passages provide enhanced mass-accretion onto the primary hole, resulting in the ejection of superluminal components from the primary jet and producing synchrotron flares. Thus these non-periodic outbursts are highly polarized. However, this ”double-mechanism” (bremsstrahlung-synchrotron) model can not explain the extreme stability of the V–R color index observed during the the OJ-94 project (Takalo Tak96 (1996)), as pointed out by Sillanpää et al. (1996a , 1996b ) and Pietilä (Pie98 (1998)). This model has been claimed to be able to test the general relativity effects possibly occurred in the binary system of OJ287, because the motion of the secondary and the timing of the impactings can be precisely determined by the post-Newtonian orbital solution (Valtonen et al. Va11 (2011)).
10.2 Cavity-flare model
Tanaka (Tan13 (2013)) proposed a cavity-flare model to explain the periodic double-peaked optical outbursts. This is a binary black hole model with a moderate mass ratio (m:M = 0.25:1) and a coplanar orbital motion. This model is based on HD/MHD simulations for near equal-mass binary black hole systems (e.g., Artymovicz Art98 (1998), Hayasaki et al. Ha08 (2008), Cuadra et al. Cu09 (2009), Shi et al. Sh12 (2012), Sesana et al. Se12 (2012), Roedig et al. Ro12 (2012), D’Orazio et al. Do13 (2013), Tanaka Tan13 (2013)). Numerical simulations of the interaction between a supermassive black hole binary and its circumbinary disk show that (1) triple disks could exist in the supermassive binary system, because the mass transfer from the circumbinary disk would form accretion disks around both black holes and relativistic jets launched from both the holes; (2) The tidal torques of the binary during the orbital motion would suppress the accretion rates onto the binary black holes surrounded by a low-density cavity. During the pericenter passage of the secondary hole two elongated accretion gas streams would leak into the cavity, accreting onto one or both SMBHs and producing a double-peaked thermal optical outburst (per orbital period of 12 yr). However, Tanaka’s model didn’t discuss the explanation of the non-periodic optical flares and timing of the outbursts. For understanding the entire phenomena observed in OJ287 in terms of cavity-flare model, more HD/MHD simulations and theoretical research are imperatively needed.
10.3 Relativistic jet models
In contrast to the precessing binary model and the cavity-flare model, both of which invoke a combination of bremsstrahlung and synchrotron mechanisms to explain the optical outbursts (periodic and non-periodic), relativistic jet models only invoke synchrotron mechanism to explain the optical outbursts. That is, all the optical outbursts (periodic doubled-peaked flares and non-periodic flares) are assumed to be originated from the relativistic jets produced by the primary and secondary black holes. Villata et al. (Villa98 (1998)) proposed a double jet model to explain the periodic double-peaked optical outbursts, regarding both outbursts being synchrotron flares originated from the double jets. Qian (Qi15 (2015)) investigated the possibility that the double-peaked optical outbursts could be produced by light-house effects in the jet or superluminal knots moving across two re-collimation shocks. Villforth et al. (Vil10 (2010)) suggested a “disk magnetic-breathing” model and assumed that the massive accretion of poloidal field causes the optical double-peaked outbursts.
Recently, Britzen et al. (Br18 (2018)) proposed an elaborated jet model to explain the phenomena in OJ287. They suggested that the radio jet produced by the primary black hole is precessing and rotating, and discussed a precession/nutation mechanism, showing that the jet kinematics as well as the optical and radio light curves can be interpreted in terms of geometric effects and Doppler beaming. Newtonian-driven precession and/or Lense-Thirring effect are suggested to explain the time scale of the jet precession.
Relativistic jet models assume that the periodic double-peaked optical outbursts are originated from jet synchrotron emission. Except this assumption distinct from the precessing binary model (Lehto-Valtonen model) and the cavity-flare model (Tanaka-model), relativistic jet models are similar to these binary models in understanding the other aspects of the phenomena in OJ287. Thus we will concentrate on the interpretation of the periodic double-peaked optical outbursts in terms of relativistic jet models and propose a tentative framework to understand the entire phenomena in OJ287.
10.4 implications of present work
The present work may have provided some new aspects viewing the OJ287 phenomena, helping to investigate the interpretation of the origin of the periodic double-peaked optical outbursts.
10.4.1 Periodicity and double structure
As shown in Sec. 9, in our double-jet scenario proposed for OJ287, the mass ratio m:M of the binary is estimated to be in the order of 0.3:1. Therefore the phenomena observed in OJ287 should be investigated by applying HD/MHD theories of the physical processes (e.g., cavity-accretion/jet-formation) in near equal-mass supermassive black hole systems. We would use the results obtained in Tanaka (Ta13 (2013)) for reference.101010Unfortunately, theoretical research and numerical simulations for physical processes in near equal-mass binary systems are far from sufficient for studying the phenomena in OJ287 and other blazars.
We suggest speculatively that the periodic double-peaked optical outbursts are produced through the cavity-accretion processes, in which two gas-streams leaked from the circumbinary disk (per periastron passage of the secondary hole) accrete onto the binary holes consecutively, causing double-peaked optical outbursts with time interval 1–2 yr (e.g., Hayasaki et al. Ha08 (2008), Artymovicz Art98 (1998)). Different from the Tanaka’s cavity-flare model (Tan13 (2013)), here we might assume that the enhanced mass-accretion onto the binary holes could be converted to the ejection of superluminal components from both jets through jet-formation mechanisms (e.g., mechanisms suggested by Blandford-Znajek Bl77 (1977) and Blanford-Payne (Bl82 (1982)), causing a pair of synchrotron optical outbursts. Because the precession of the jets are caused by the orbital motion of the binary, the orbital motion of the binary holes naturally provides the 12 yr precession period of the jets. Occasionally, gas streams accreted onto the binary might produce the non-periodic flares.
This “single-mechanism” scenario seems to be supported by the radio/optical variability studies. It has been found that the optical variability is highly correlated with the radio variability and the emergence of the superluminal components (Tateyama et al. Ta99 (1999), Britzen et al. Br18 (2018)). Upon detailed inspection it has been found that the optical double-peak outburst structures had correspondent radio double-bump burst structures, as summarized in Table 9. The optical and radio light curves given in Britzen et al. (Br18 (2018)) reveal that the non-periodic optical double-peaked outburst during 2001.8–2003.1 also had a corresponding radio double-bump burst structure. This seems to imply that the nature of the periodic optical double-peaked outbursts could be essentially similar to that of the non-periodic double-peak outbursts. Both periodic and non-periodic optical outbursts could be produced by the same mechanism: synchrotron radiation. The most persuasive argument for this “single mechanism scenario” had already been suggested by Sillanpää et al. (1996a ): the extreme stability of the V-R color index measured by the OJ-94 monitoring project (Takalo Tak96 (1996)) supporting the same energy production mechanism during a period of 2.3 yr (1993.8–1996.1). We note that during the OJ-94 project the major double-peaked optical outbursts (starting at 1994.65 and 1995.75 and claimed as thermal flares) were contemporarily observed with many synchrotron flares. The stability of the V-R color index seems to clearly imply that all the optical flares observed during the OJ-94 project should be originated from the same energy production mechanism. The solely possible mechanism is synchrotron with a power-law electron energy spectral index of 2.90 at V-R band. Any suggestion of dual mechanism (e.g. a combination of bubble-producing thermal flares and synchrotron flares) would be difficult to explain this color stability, as Sillanpää et al. (1996a ) and Pietilä (Pie98 (1998)) commented.
10.4.2 Interpretation of optical light-curves
In this work we have found that the superluminal knots ejected from both the relativistic jets are moving along trajectory of parabola-like shape. This would result in large changes of their Doppler factor near the core.
| optical | radio | jet ID |
|---|---|---|
| 1971.2–1974.0 (three peaks) | 1971.5–1976.6 (three bumps, 8 GHz) | N-jet |
| 1971.2–1972.7 (double peak) | 1971.5–1974.3 (double bump, 8 GHz) | N-jet |
| 1983.0–1984.5 (double peak) | 1983.0–1984.5 (double bump, 15 GHz) | N-jet |
| 1994.6–1996.3 (double peak) | 1994.6–1996.5 (double bump, 15 GHz) | N-jet |
| 2005.8–2008.5 (double peak) | 2005.8–2009.5 (double bump, 15 GHz) | N-jet |
| 2015.9–2016.5 (first peak) | 2016.0–2017.1 (first bump, 15 GHz) | N-jet |
| 2001.8–2003.1 (double peak) | 2002.0–2005.1 (double bump, 15 GHz) | S-jet |
| Model type | orbit-1 | orbit-2 | non-GR | new model |
|---|---|---|---|---|
| Impacting time | 2013.53 | 2014.58 | – | 2013.45 |
| Time-delay (yr) | 2.82 | 1.35 | – | 2.42 |
| Predicted time | 2016.35 | 2015.93 | 2015.82 | 2015.87 |
| Observed | 2015.87 | 2015.87 | 2015.87 | 2015.87 |
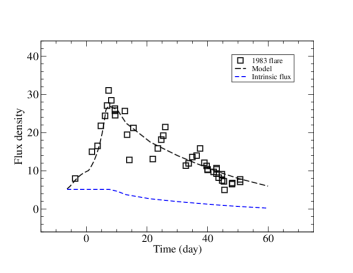
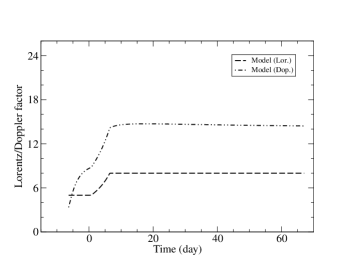
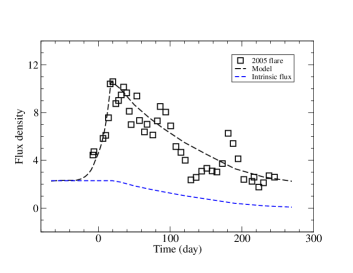

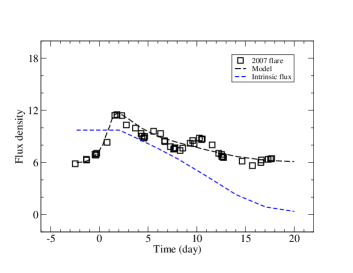
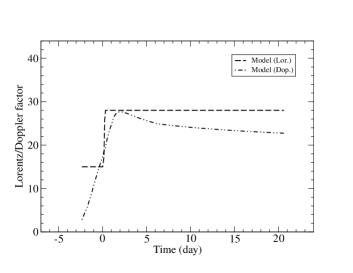
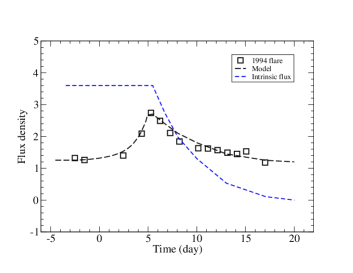
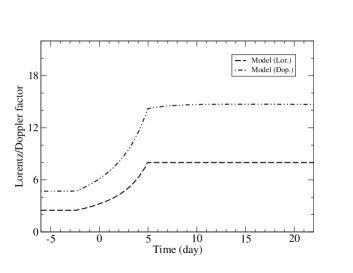
Thus the sharp rise phase of the periodic double-peaked optical outbursts could be interpreted in terms of Doppler boosting. In Figure 15 we show the results of our simulations by relativistic jet models for the light curves of the three optical outbursts occurred at 1983.0, 2005.76, 2007.70. 111111The data are collected from Valtonen et al. (Va08 (2008)).
In fact,
using relativistic jet models, the evolution of the optical flux density
of a superluminal knot can be write as:
| (18) |
(t) is intrinsic flux density, p=3 for individual knots (Lind & and Blandford Lin85 (1985)) and 1.0 is optical spectral index : . We assume that the optical knots are ejected along parabolic trajectories as the radio knots, but having smaller scale sizes. We choose a model trajectory for the optical knot having parameters similar to those for radio knot C8 of the northern jet (=, =0.0 rad, =-3.95 rad, =0.5), but a smaller scale size =0.0402. We also assume that during the rising phases the intrinsic optical flux densities are constant and thus the sharp rises of the flux density are fully determined by the Doppler boosting. But after reaching the maxima of the light curves the optical flux variations could be explained in terms of the intrinsic evolution (t) of the optical knots (due to constant.).121212Intrinsic optical variations are usually caused by particle acceleration, energy dissipation due to expansion and synchrotron/inverse-Compton losses within the optical knots and other processes, referring to Qian 1996a , 1996b , Qi97 (1997). Generally, in order to decompose the contributions from Doppler boosting and intrinsic variations, multi-wavelength light curves are required. The model-fitting results of the light curves for the three optical outbursts observed in 1983.0, 2005.76 and 2007.70 are shown in Figure 15. It can be seen that the entire optical light curves of the three flares (all claimed to be thermal outbursts) can be well interpreted in terms of relativistic jet models. This is the first time that the double-peaked optical outbursts are interpreted in terms of the superluminal motion of optical knots ejected from the optical core. In Figure 16 we also show the model-fitting results of the optical light curve for the typical synchrotron flare observed in 1994.02 (Fig. 4 in Sillanpää et al. 1996b ; OJ-94 project data). Obviously, the four flaring events have very similar behaviors and can be interpreted in terms of the evolution of superluminal knots ejected from relativistic jets.
We point out that the results shown in Figures 15 and 16 may be instructive and significant. In the precessing binary model (Lehto & Valtonen Le96 (1996), Valtonen et al. Va17 (2017)), the 2005.76 and 2007.70 outbursts (as a double-peaked outburst) and the 1983.0 outburst were all assumed to be originated from the bremsstrahlung (thermal emission) of the gas-bubbles torn out from the disk of the primary hole when the secondary impacting onto the primary disk. Very complicated calculations of the disk-crossing processes and the formation and evolution of the gas-bubbles were made for model-fitting their light curves (e.g., Lehto & Valtonen Le96 (1996), Pihajoki Pi16 (2016), Pihajoki et al. 2013a ). But in our relativistic jet models their optical light curves can be relatively simply explained in terms of the flux evolution of the optical knots ejected from the central supermassive binary black hole system along parabolic trajectories with Lorentz factors consistent with those obtained by radio VLBI-measurements. Moreover, the rising phase of the 2007 outburst had a very short time-scale of 5 days and the 2005 outburst had a rising time-scale of 50 days. This difference in rising time-scales could be simply explained in terms of the optical knots having different Lorentz factors.
10.4.3 Low polarization degrees
The interpretation of the light-curves for the four outbursts in terms of relativistic jet models given above is very encouraging. We then can consider the possibility of low polarization degrees for the double-peaked optical outbursts. This might occur during the pericenter passages of the secondary hole, when the gravitational (tidal) torques induce strong turbulent magnetized mass flows accreting onto both black holes and, through jet-formation processes, result in ejection of superluminal knots (plasmons or shocks, Marscher & Gear Ma85 (1985), Pacholczyk Pa70 (1970), Qian Qi97 (1997)) with almost random magnetic fields (turbulent energy magnetic energy). The optical flares produced by these knots will be synchrotron flares with very low polarization (e.g., a few percent, but not zero; Marscher et al. Ma08 (2008), Marscher Ma14 (2014), Burn Bu66 (1966)): in this case polarization degree p=/(+), and are ordered and random field strength, respectively, 0.75 – typical polarization degree of a synchrotron source with a uniform field (Burn Bu66 (1966), Pacholczyk Pa70 (1970)). 131313This is just a tentative suggestion and should be tested by further polarization observations.
We have noticed that there are some clues supporting this consideration. For example, the radio bursts associated with the major optical outbursts occurred in 1983.0, 1994.7 and 1995.9 were all low-polarized flares, showing distinct minimal polarization degrees of 2% (Figs. 5 and 7 in Valtaoja et al. Val20 (2000)), possibly indicating the extremely turbulent conditions of the radio knots (Pacholczyk Pa70 (1970)). Moreover, the 2015.87 major optical outburst was observed to have an almost constant polarization degree of 6% that is quite different from the extremely low polarization degrees of 2% observed for the previous optical outbursts. A superposition of three constituents are assumed to explain this polarization degree: the major bremsstrahlung (thermal) outburst with zero polarization (as predicted by the disk-impact model), a synchrotron flare with a polarization of 40% and a base-level component with a polarization of 10% (Valtonen et al. Va16 (2016), Va17 (2017)). This assumption of multi-component polarization structure might pose questions: is it this decomposition unique? Is it possible that the optical outburst itself has a low (but not purely zero) polarization degree? This problem seems not easily solved and more polarization observations in radio and optical bands are needed to investigate this possibility.
10.4.4 Timing of outbursts
As shown by Tanaka (Ta13 (2013)), cavity-accretion models could provide interpretation for the double-peaked optical flares per binary orbit: that is, the 12 yr periodicity and the 1–2 yr time–interval. However, due to the temporal stochasticity in the accretion dynamics they cannot precisely constrain the flare timing. This is quite different from the precessing binary model of Lehto & Valtonen (Le96 (1996)), which strongly constrains the flare timing based on the binary orbit solution. In order to interpret the phenomena in OJ287 in terms of cavity-accretion (or cavity-flare) models, more MHD-simulations and investigations of the physical processes in near equal-mass binary systems would be required to search for appropriate “multi-parameter solutions”, including those parameters describing the binary orbit, black hole masses, circumbinary-disk structure, interaction between the binary and circumbinary disk, formation of black hole disks, leakage of a pair-stream per periastron passage and periodically enhanced mass accretion onto the binary holes (referring to Hayasaki et al. Ha08 (2008) and references therein). In fact, in the precessing binary model (Valtonen et al. Va07 (2007), Valtonen et al. Va16 (2016)), the timing of optical outbursts not only depends on the binary orbit model, but also on the choice of the disk model for estimating the delay times, especially for the disk crossings faraway from the primary hole (Pietilä Pie98 (1998), Pihajoki Pi16 (2016)). This can be seen in Table 9, where the predictions of the 2015.87 flare by four different models are compared. It clearly shows that the flare-timing prediction by the non-gravitational model being better than that by both the models ’orbit-1” and ”orbit-2”, and also indicates that the ”new model” adopted a delay time of 2.42 yr (instead of 2.82 yr of model ”orbit-1”), making it to get a more accurate timing of the 2015.87 optical outburst. Thus more HD/MHD studies and numerical simulations on the physical processes in supermassive binary systems are imperatively required to search multi-parameter solutions, specific for the phenomena in OJ287. Actually, some studies performed (e.g.) by Hayasaki et al. (Ha08 (2008)) and D’Orazio et al. (Do13 (2013), Farris et a. Fa14 (2014)) are promising to solve the problems involved in OJ287. It seems that spin of the binary holes should be included in MHD simulations, because holes’ spins may play important roles in sustaining hole-disks and forming holes’ magneto-spheres, and thus forming relativistic jets (or AGN).
11 Conclusion
In a brief summary, this work may have provided a new and alternative insight into the phenomena in OJ287 and significant information about its physical processes.
Based on the results obtained in this paper, it seems that relativistic jet models, as described above, may be potentially able to provide a fully and reasonable explanation of the entire emission properties and kinematic features observed in blazar OJ287 in a compatible framework. Actually, we have proposed a comprehensive framework of relativistic jet models to understand the phenomena observed in blazar OJ287. It contains the following ingredients.
-
•
OJ287 may have a supermassive black hole binary in its center with a moderate mass ratio and two relativistic jets are produced by the primary and secondary holes;
-
•
Through the cavity-accretion mechanism, the orbital motion of the binary in an eccentric orbit creates periodic (or regular) enhanced-accretion events (of mass and magnetic field) per periastron passage (due to disturbances induced by gravitational torques) with two gas-streams accreting onto the binary. Occasional and non-periodic accretion events are also occurring during the orbital motion.
-
•
The periodic accretion events, through jet formation mechanisms, will be converted into the consecutive ejections of two superluminal optical knots, resulting in the periodic double-peaked optical outbursts of a period 12 yr with an double-peak time-interval of 1–2 yr. Similarly, the non-periodic accretion events will also produce usually observed superluminal knots and their synchrotron emission;
-
•
All the superluminal optical knots produced by these enhanced accretion events are ejected from the optical core along precessing parabolic trajectories, thus their light curves, especially the fast rising phases, can be explained by Doppler boosting, taking their intrinsic flux evolution into account (Figures 15 and 16);
-
•
Both the optical and radio outbursts are produced in the relativistic jets and originated from synchrotron emission. The optical variations are tightly correlated with the radio variations and the the emergence of superluminal radio knots.
-
•
In addition to the optical outbursts, there is a base-level emission varying with longer time-scales, which could be related to the “quiescent jet” (or “optical polarization core”) suggested by Villforth et al. (Vil10 (2010)). Thus the observed optical (and radio) light curves are constructed from the summation of the light curves of the individual superluminal knots and the base-level emission.
Although this framework is mostly qualitative, it satisfies the requirement of “single mechanism” and the entire phenomena observed in blazar OJ287 are ascribed to the relativistic jets and unified with the physics in other blazars. However, detailed investigations of HD/MHD processes of cavity-accretion, periodic gas-streaming onto the binary holes and interaction between the accretion and jet formation in the binary black hole systems for near equal-mass cases are required, especially for understanding the mechanism of the double-peaked optical outbursts. In addition, seeking suitable multi-parameter solutions for orbital motion and flare-timing, and studying outburst polarization, accretion and knot ejection, etc. are also needed. Certainly, for interpreting the OJ287 phenomena, the main subjects would be: (1) how to take the effects of spins of the binary into consideration in the cavity-accretion scenario. Spin of the binary holes may play important role in sustaining the disks around the binary holes and re-collimating the material flung out from the cavity along the direction perpendicular to the circumbinary disk; (2) how to deal with the accretion of magnetic field onto the holes and the structure of the magneto-spheres around the binary holes; (3) how to deal with the formation of relativistic jets from both black holes; (3) how to deal with the interaction between the cavity-accretion and the relativistic jets.
We would like to emphasize that the model-fitting results of the parsec-scale kinematics for OJ287 given in this paper were obtained only from the detailed analysis of the kinematics of the radio superluminal components and thus are independent of any existing proposed theoretical models for interpreting the optical phenomena observed in OJ287 (light curves and variability in polarization). These results, if correct, may be worth being taken into consideration in constructing better theoretical models.
Acknowledgements.
I gratefully thank Dr. S. Britzen (Max-Planck Institute für Radioastronomie) for providing the 15 GHz VLBI-data on OJ287.References
- (1) Ackermann M., Ajello M., Allafort A., et al., 2011, ApJ 743, 171
- (2) Agudo, I., Jorstad, S.G., Marscher, A.P., et al. 2011a, ApJ, 726, L13
- (3) Agudo I., Jorstad S.G., Marscher A.P., et al., 2011b, Proceedings of Fermi symposium, arXiv-1110.6463
- (4) Agudo, I., Marscher, A.P., Jorstad, S.G., et al. 2011c, IJMPS, 8, 271
- (5) Agudo, I., Marscher, A.P., Jorstad, S.G., et al. 2011d, ApJ, 735, L10
- (6) Agudo, I., Marscher, A.P., Jorstad, S.G., et al. 2012, ApJ, 747, 63
- (7) Artymovicz, P., Lubow, S.H. 1996, ApJ, 467, L77
- (8) Artymovicz, P. 1998, in: Theory of black hole accretion disks, eds. M.A. Abromowicz, G. Bjornsson, J.E. Pringle, p202
- (9) Asada , K., & Nakamura, M. 2012, ApJL, 745, L28
- (10) Beskin, V.C., & Zheltoukhov, A.A. 2013, Astron. Lett., 39, 215
- (11) Blandford, R.D., & Znajek, R.L. 1977, MNRAS, 179, 433
- (12) Blandford, R.D., & Payne, D.G. 1982, MNRAS, 199, 883
- (13) Britzen, S., Qian, S.J., Steffen, W., et al. 2017, A&A, 602, 29
- (14) Britzen, S., Fendt, C., Witzel, G., Qian, S.J., et al. 2018, in press (MNRAS, BFW18)
- (15) Burn, B.J. 1966, MNRAS, 133, 67
- (16) Cheung, C.C. 2002, ApJ, 581, L15
- (17) Ciprini S. Raiteri C.M., Rizzi N., et al., 2007, Mem.S.A.It. 78, 741
- (18) Cohen, M.H., Meier, D.L., Arshakian, T.G., et al. 2014, ApJ, 787, 151
- (19) Cohen, N.H., Meier, D.L., Arshakian, T.G., et al. 2016, ApJ, 803, 3
- (20) Cohen, M.H. 2017, Galaxies, 5, 12
- (21) Cuadra, J., Armitage, P.J., Alexander, R.D., Begelman, M.C. 2009, MNRAS, 393, 1423
- (22) D’Arcangelo, F.D., Marscher, A.P., Jorstad, S.D., et al. 2009, ApJ, 697, 985
- (23) Doeleman, S.S., Fish, V.L., Schenck, D.E., et al. 2012, Science, 338, 355
- (24) de Pater, I., Perley, R.A. 1983, ApJ, 273, 64
- (25) D’Orazio, D.L., Haiman, Z., & Macfadyen A. 2013, MNRAS, 436, 2997
- (26) Einstein, A. 1916, Sitzungberichte der Königlich Presssichen Akademie der Wissenshafte (SPAW, Berlin), 688
- (27) Einstein, A. 1918, Sitzungberichte der Königlich Presssichen Akademi der Wissenshafte (SPAW, Berlin), 154
- (28) Eisenhauer, F., Perrin, G., Brandner, W., et al. 2011, Msngr, 143, 16
- (29) Farris, B.D., Duffell, P., MacFadyen, A.I., et al. 2014, ApJ, 783, 134
- (30) Ferrarese, L., Ford, H. 2005, Space Sci. Rev., 116, 523
- (31) Gabuzda, D.C., Wardle , J.F.C., Roberts, D.H. 1989, ApJ, 336, 59
- (32) Hada, K., Akihiro, D., Motoki, K., et al. 2011, Nature, 477, 185
- (33) Hardee, P.E. 1987, ApJ, 318, 78
- (34) Hardee, P.E. 2000, ApJ, 533, 176
- (35) Hayasaki, K., Mineshige, S. & Ho, L.C. 2008, ApJ, 682, 1134
- (36) Hodgson, J.A., Krichbaum, T.P., Marscher, A.P., et al. 2017, A&A, 597, 80
- (37) Hogg, D.W. 1999, astro-ph/9905116
- (38) Homan, D.C., Ojha, R., Wardle, J.F.C., et al. 2001, 549, 840
- (39) Homan, D.C., Kadler, M., Kellermann, K.I., et al. 2009, ApJ, 706, 1253
- (40) Homan, D.C., Lister, M.L., Kovalev, Y.Y., et al. 2015, ApJ, 798, 134
- (41) Hovatta T., Valtaoja E., Tornikovski M., et al., 2009, A&A 498, 723 (arXiv0811.4278)
- (42) Jorstad, S.G., Marscher, A.P., Lister, M.L., et al. 2005, AJ, 130, 1418
- (43) Jorstad, S.G., Marscher, A.P., Morozova, D.A., et al. 2017, ApJ, 846, 98
- (44) Kaastra, J.S. & Roos, N. 1992, A&A, 254, 96
- (45) Katz, J.I. 1997, ApJ 478, 527
- (46) Kidger, M.R., Gonzalez-Perez, J.N., de Diego, J.A., et al. 1995, A&AS, 113, 431
- (47) Kormendy, J., & Richstone, D. 1995, ARA&A, 33,581
- (48) Krichbaum, T.P., Roy, A., Wagner, J., et al. 2013, PoS (Proceedings of Science)
- (49) Lehto, H.J., & Valtonen, M.J. 1996, ApJ, 460, 207
- (50) Lind, K.R. & Blandford, R.D. 1985, ApJ, 295, 358
- (51) Lister, M.L., Marscher, A.P., & Gear, W.K. 1998, ApJ, 504, 702
- (52) Lister, M.L., Cohen, M.H., Homan, D.C., et al. 2009, AJ, 138, 1874
- (53) Lu, R.S., Fish, V.L., Akiyama, K., et al. 2013, ApJ, 772, 13
- (54) MacDonald, D., & Thorne, K.S. 1982, MNRAS, 198, 345
- (55) Marscher, A.P. & Gear, W.K. 1985, ApJ, 298, 114
- (56) Marscher A.P., Jorstad, S.G., D’Arcangelo, F. D., et al. 2008, Nature, 452, 966
- (57) Marscher A.P., Jorstad S.G. 2010, ApJ, 729, 26
- (58) Marscher A.P., 2014, ApJ 780, 87
- (59) Marti, J.M., Perucho, M., Gómez, J.L. 2016, ApJ, 831, 163
- (60) McKinney, J.C., Tchekhovskoy, A., & Blandford, R.D. 2012, MNRAS, 423, 2083
- (61) Meier, D.L. 2013, EPJ Web of Conference 61, 01001
- (62) Mizuno, Y., Gómez, J.L., Nishikawa, K.I., et al. 2015, ApJ, 809, 38
- (63) Moór, A., Frey, S., Lambert, S.B., et al. 2011, AJ, 141, 178
- (64) Mutel, R.L. & Dunn, G.R. 2005, ApJ, 623, 79
- (65) Nakamura, M. & Asada, K. 2013, ApJ, 775, 118
- (66) Nolan P.L., et al., 2012, APJS 199, 31, (arXiv-1108.1435).
- (67) Pacholczyk, A.G. 1970, Radio Astrophysics (Freenman)
- (68) Pen, Ue-Li 1999, ApJS, 120, 49
- (69) Pietilä, H. 1998, ApJ, 508, 669
- (70) Pihajoki, P., Valtonen, M., Ciprini, S. 2013b, MNRAS (arXiv 1307.1113)
- (71) Pihajoki P., Valtonen, M., Zola, S., et al. 2013a, ApJ, 764, 5
- (72) Pihajoki, P. 2016, MNRAS, 457, 1145
- (73) Piner, B.G., Mahmud, M., Fey, A.L., & Gospodinova, K. 2007, AJ, 133, 2357
- (74) Polko, P., Meier, D.L., Markoff, S. 2010, ApJ, 723, 1343
- (75) Polko, P., Meier, D.L., Markoff, S. 2013, MNRAS, 428, 587
- (76) Polko, P., Meier, D.L., Markoff, S. 2014, MNRAS, 438, 959
- (77) Qian, S.J., Witzel, A., Krichbaum, T.P., et al. 1991, Acta Astron. Sin., 32, 369 (english translation: in Chin. Astro. Astrophys., 16, 137 (1992))
- (78) Qian, S.J. 1996a, ChA&A, 20, 281
- (79) Qian, S.J. 1996b, ChA&A, 20, 137
- (80) Qian, S.J. 1997, AcASn, 38, 239
- (81) Qian, S.J., Witzel, A., Zensus, J.A., et al. 2009, RAA (Research in Astron. and Astrophys.), 9, 137
- (82) Qian,S.J. 2011, RAA, 11, 43
- (83) Qian,S.J. 2012, RAA, 12, 46
- (84) Qian, S.J. 2013, RAA, 13, 783
- (85) Qian, S.J., Britzen, S., Witzel, A., et al. 2014, RAA, 14, 429
- (86) Qian, S.J. 2015, RAA, 15, 687
- (87) Qian, S.J. 2016, RAA, 16, 20
- (88) Qian, S.J., Britzen, S., Witzel, A., et al. 2017, A&A, 604, A90
- (89) Qian S.J., Britzen, S., Witzel A., et al. 2018, A&A, 615, A123
- (90) Qian, S.J., et al. 2019, (3C279, accepted by A&A)
- (91) Roedig, C., Sesana, AS., Dotti, M., et al. 2012, A&A, 545, A127
- (92) Roland, J., Britzen, S., Kudryavtseva, N.A., et al. 2008, A&A, 483, 125
- (93) Roos, N., Kaastra, J.S., Hummel, C.A., et al. 1993, ApJ, 409, 130
- (94) Sesana, A., Roedig, C., Reynolds, M. T., Dotti, M. 2012, MNRAS, 420, 820
- (95) Shakura, N.I., Sunyaev, R.A. 1973, A&A, 24, 337
- (96) Shi, J.M., Krolik, J.H., Loubow, S.H., Hawley J.F. 2012, ApJ, 749, 118
- (97) Sillanpää, A., Haarala, S., Valtonen, M.J., et al. 1988, ApJ, 325, 628
- (98) Sillanpää, A., Takalo, L.O., Pursimo, T., et al. 1996a, A&A, 315, L13
- (99) Sillanpää, A., Takalo, L.O., Pursimo, T., et al. 1996b, ASP conference series, Vol. 110 (Blazar Continuum Variability), eds. H.R. Miller, J.R. Webb and J.C. Noble, p74
- (100) Spergel, D.N., Verde, L., Peiris, H.V., et al. 2003, APJS, 148, 175
- (101) Stirling, A.M., Cawthorne, T.V., Stevens, J.A., et al. 2003, MNRAS, 341, 405
- (102) Sundelius, B., Wade, M., Lehto, H.J., et al. 1997, ApJ, 484, 180
- (103) Takalo, L.O. 1996, ASP Conference Series, Vol.110 (Blazar Continuum Variability), eds., H.R. Miller, J.R. Webb and J.C. Noble, p70
- (104) Tanaka, T.L. 2013, MNRAS, 434, 2275
- (105) Tateyama, C.E., Kingham, K.A., Kayfmann, P., et al. 1999, ApJ, 520, 627
- (106) Tateyama, C.E., & Kingham, K.A. 2004, ApJ, 608, 149
- (107) Tateyama, C.E. 2013, ApJS, 205, 15
- (108) Valtaoja, E., Terasranta, H., Tornikoski, M., et al. 2000, ApJ, 531, 744
- (109) Valtonen, M.J., Lehto, H.J., Sillanpää, A., et al. 2006, ApJ, 646, 36
- (110) Valtonen, M.J. 2007, ApJ, 659, 1074
- (111) Valtonen, M.J., Mikkola, S., Merritt D., et al., 2008, Relativity in Fundamental Astronomy, Proceedings IAU Symposium No.261, eds. S.A. Klioner, K.P. Seidalman & M.H. Soffel
- (112) Valtonen M.J., Nilsson K., Villforth C., et al., 2009, ApJ 698, 781
- (113) Valtonen, M.J., Sillanpää, A. 2011, Acta Polytechnica, 51, 76
- (114) Valtonene, M.J., Wiik, K. 2012, MNRAS, 421, 1861
- (115) Valtonen, M.J., Pihajoki, P. 2013, A&A , 557, 28
- (116) Valtonen, M.J., Zola, S., Ciprini, S., et al., 2016, ApJL, 819, L37
- (117) Valtonen, M.L., Zola, S., Jermak, H., et al. 2017, Galaxies, 5, 83
- (118) Vicente, L., Charlot, P., & Sol, H. 1996, A&A, 312,727
- (119) Villata, M., Raiteri, C.M., Sillanpää, A., et al. 1998, MNRAS 293, L13
- (120) Villforth, C., Nilsson, K., Heidt, J., et al. 2010, MNRAS 402, 2087
- (121) Vlahakis, N., & Königl, A. 2004, ApJ, 605, 656
Appendix A Model fitting results of southern jet (for knots C11 and C12) and northern jet (for knots C2, C3, C5, C6, C13U and C14.