NuSTAR Hard X-ray View of Low-luminosity Active Galactic
Nuclei:
High-energy Cutoff and Truncated Thin Disk
Abstract
We report the analysis of simultaneous XMM-Newton+NuSTAR observations of two low-luminosity Active Galactic Nuclei (LLAGN), NGC 3998 and NGC 4579. We do not detect any significant variability in either source over the -day length of the NuSTAR observations. The broad-band 0.5-60 k1eV spectrum of NGC 3998 is best fit with a cutoff power-law, while the one for NGC 4579 is best fit with a combination of a hot thermal plasma model, a power-law, and a blend of Gaussians to fit an Fe complex observed between 6 and 7 keV. Our main spectral results are the following: (1) neither source shows any reflection hump with a reflection fraction upper-limits and for NGC 3998 and NGC 4579, respectively; (2) the 6-7 keV line complex in NGC 4579 could either be fit with a narrow Fe K line at 6.4 keV and a moderately broad Fe XXV line, or 3 relatively narrow lines, which includes contribution from Fe XXVI; (3) NGC 4579 flux is 60% brighter than previously detected with XMM-Newton, accompanied by a hardening in the spectrum; (4) we measure a cutoff energy keV in NGC 3998, which represents the lowest and best constrained high-energy cutoff ever measured for an LLAGN; (5) NGC 3998 spectrum is consistent with a Comptonization model with either a sphere () or slab () geometry, corresponding to plasma temperatures between 20 and 150 keV. We discuss these results in the context of hard X-ray emission from bright AGN, other LLAGN, and hot accretion flow models.
1 Introduction
| Name | Optical Classification | Distance | Telescope | Observation ID | Date | GTIa | |
|---|---|---|---|---|---|---|---|
| Mpc | M⊙ | ks | |||||
| NGC 3998 | LINER 1.9 | 14.1 | 9.3 | NuSTAR | 60201050002 | 2016/10/25 | 104/104 |
| XMM-Newton | 0790840101 | 2016/10/26 | 3.8/11.4/11.2 | ||||
| NGC 4579 | LINER 1.9/Seyfert 1.9 | 16.4 | 8.1 | NuSTAR | 60201051002 | 2016/12/06 | 118/117 |
| XMM-Newton | 0790840201 | 2016/12/06 | 17.2/21.3/21.2 |
-
Notes.
Optical classification is taken from Ho et al. (1997). Distances are from Tonry et al. (2001) and Springob et al. (2007) for NGC 3998 and NGC 4579, respectively. Black-hole masses are calculated using velocity dispersions from Ho et al. (2009) and the relation of Kormendy & Ho (2013). a Good time intervals represent the live time of FPMA/FPMB, and the cleaned exposure for pn/mos1/mos2.
Most galaxies in the nearby universe host a low luminosity active galactic nucleus (LLAGN), with bolometric luminosities ranging from to erg s-1 (Flohic et al. 2006; Zhang et al. 2009; González-Martín et al. 2009). Assuming that the emission is due to accretion onto a supermassive black-hole with masses - , these bolometric luminosities translate into Eddington ratios in the range to ; at least an order of magnitude smaller than the ratio for luminous active galactic nuclei (AGN). The dimness of these LLAGN is due to an underfed supermassive black-hole, and since these sources represent the bulk of active galaxies (Ho et al. 1997), understanding the effect of low accretion rates on the geometry and dynamics of the central engine of galaxies is evidently imperative (see, e.g., Ho 2008, 2009, for reviews).
Multiwavelength observations of LLAGN have shown a particularly different spectral energy distribution compared to luminous AGN. For instance, unlike most bright AGN in the local universe, i.e., Seyfert galaxies, LLAGN appear as radio-loud sources, with radio to X-ray flux ratio comparable to radio-loud AGN. They also lack a UV bump, the ubiquitous feature in almost all AGN (e.g., Ho 1999; Nagar et al. 2005; Eracleous et al. 2010; Younes et al. 2012). Specifically in soft X-rays, LLAGN do not show the strong, intra-day variability shared by their more luminous counterparts (e.g., Ptak et al. 1998; Pian et al. 2010; Younes et al. 2010, 2011; González-Martín & Vaughan 2012; Hernández-García et al. 2014), while their soft X-ray spectra appear mostly featureless, especially lacking the strong reflection features, e.g., a broad Fe K line (Ptak et al. 2004; González-Martín et al. 2009; Younes et al. 2011). Furthermore, LLAGN do not seem to follow some of the correlations established for typical AGN; the positive Eddington-ratio correlation seen in luminous AGN (Sobolewska & Papadakis 2009) does not extend down to the limits of LLAGN, instead LLAGN show an opposite, anticorrelation between the 2 parameters (Gu & Cao 2009; Younes et al. 2011; Yang et al. 2015; She et al. 2018a). This overwhelming, yet incomplete, list of evidence point towards a drastically altered central engine in LLAGN compared to luminous AGN.
These unique properties of LLAGN cannot be understood in the context of the radiatively efficient, geometrically thin accretion disks that are thought to power luminous AGN (Shakura & Sunyaev 1973). For the low accretion rates that govern LLAGN, the density in the accretion disk becomes too low for radiative cooling to be effective. Hence, the trapped heat will expand the inner parts of the accretion disk into a pressure-supported, radiatively-inefficient hot accretion flow (see, e.g., Narayan & McClintock 2008; Yuan & Narayan 2014, for reviews). The most famous examples of such hot accretion solutions are the advection dominated accretion flow (e.g., Narayan & Yi 1994), the adiabatic inflow-outflow solution (e.g., Blandford & Begelman 1999), and the convection dominated accretion flow (Narayan et al. 2000). These models have been successfully fit to the SED of a number of LLAGN (e.g., Di Matteo et al. 2001; Ptak et al. 2004; Xu & Cao 2009; Nemmen et al. 2014), including Sgr A∗ (e.g., Yuan et al. 2004; Wang et al. 2013).
Hard X-ray observations of AGN are of paramount importance. The X-ray emission of AGN emanates from a corona, where optical and UV photons from the disk Compton up-scatter into the X-ray band (Haardt & Maraschi 1993). The temperature in the corona reveals itself through a break in the hard X-ray energies. Moreover, a reflection feature is expected in the hard band in the form of a “Compton hump” at energies of 30 keV. While the brightest AGN have been studied in the past at those energies (e.g., Mantovani et al. 2016), NuSTAR, the first focusing X-ray telescope at hard X-rays, have revolutionized the field, allowing us to study with unprecedented details those signatures, not only in moderately bright AGN, but for the first time in LLAGN as well. Indeed, at least two LLAGN have been observed with NuSTAR so far, NGC 7213 and M 81 (Ursini et al. 2015; Young et al. 2018). Neither source showed any hint of a relativistic disk reflection component in the hard X-ray band, pointing towards a truncated inner accretion disk, possibly filled with a hot accretion flow instead.
Here, we report two deep, simultaneous NuSTAR+XMM-Newton observations of the LLAGN NGC 3998 and NGC 4579. Both galaxies are optically classified as type 1.9, showing broad H emission lines (Table 1, Ho et al. 1997). They have been previously studied in soft X-rays with XMM-Newton (Ptak et al. 2004; Dewangan et al. 2004). Their radio to X-ray SEDs have been successfully fit with an ADAF and/or a jet model (Ptak et al. 2004; Quataert et al. 1999; Xu & Cao 2009). NGC 3998 and NGC 4579 are among the lowest Eddington ratio AGN to be observed at hard X-rays keV, with of and for NGC 3998 and NGC 4579, respectively (Younes et al. 2012; Nemmen et al. 2014). Section 2 details the observation and data analysis procedures. We present our timing and spectral results in section 3, which are discussed in details in section 4. Finally, a summary of our findings is presented in section 5.
2 Observations and data reduction
The Nuclear Spectroscopic Telescope Array (NuSTAR, Harrison et al. 2013) consists of two identical modules FPMA and FPMB operating in the energy range 3-79 keV. NuSTAR observed NGC 3998 on 2016 October 25 for a total, live-time exposure of 104 ks. It observed NGC 4579 on 2016 December 06 for 118 ks (Table 1). We processed the data using the NuSTAR Data Analysis Software, nustardas version v1.8.0 and the calibration files CALDB version number 20180419. We reduced the data using the nuproducts task (which allows for spectral extraction and generation of ancillary and response files) and HEASOFT version 6.22.1. We used the flag saamode=optimized to correct for enhanced background activity visible at the edges of the good time intervals immediately before entering SAA. We extracted source events around the source position using a circular region with 60′′radius, which maximized the S/N ratio. Background events are extracted from an annulus around the source position with inner and outer radii of 120′′ and 200′′, respectively.
| NGC 3998 | Cutoff PL | pexrav | pexmon | compTT (slab) | compTT (sphere) |
| ( cm-2) | |||||
| (keV) | – | – | – | ||
| – | – | – | |||
| – | – | ||||
| (keV) | – | – | |||
| – | – | – | |||
| ( erg s-1 cm-2) | |||||
| ( erg s-1 cm-2) | |||||
| ( erg s-1) | |||||
| /d.o.f. | 1217/1221 | 1218/1220 | 1217/1220 | 1218/1221 | 1218/1221 |
XMM-Newton observed both sources simultaneously with NuSTAR for a total, cleaned EPIC-pn exposure of about 4 and 17 ks for NGC 3998 and NGC 4579, respectively (Table 1). During both observations, the EPIC cameras (Strüder et al. 2001) are operated in Full Frame mode, using the thin filter. The PN and MOS data are selected using event patterns 0–4 and 0–12, respectively, during only good X-ray events (“FLAG0”). We inspected all observations for intervals of high background, e.g., due to solar flares, and excluded those where the background level was above 5% of the source flux. We extracted source events for the two observations from a circle with center obtained by running the task eregionanalyse on the cleaned event files. This task calculates the optimum centroid of the count distribution within a given source region. We set the source extraction radius to 60′′. Background events are extracted from a source-free annulus centered at the source with inner and outer radii of 120′′and 200′′, respectively. We generated response matrix files using the SAS task rmfgen, while ancillary response files are generated using the SAS task arfgen.
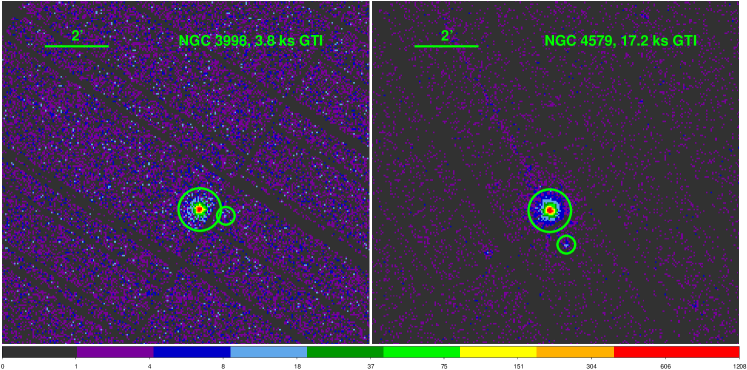
We identified two X-ray point sources within 1.5′ of NGC 3998 with XMM-Newton. The first, NGC 3998 X-1, is reported in Ptak et al. (2004) as a likely background AGN on the basis of its X-ray, UV, and optical fluxes. The second, NGC 3998 X-2, is an unidentified source. Both sources have very low fluxes, erg cm-2 s-1. NGC 3998 X-1 is not detected above 2 keV, while NGC 3998 X-2 is very weakly detected, with a 2-10 keV flux that of the central LLAGN (Figure 1, left panel). We also detect two weak X-ray point sources in the vicinity of NGC 4579. Only one is detected keV, with a flux that is 1% compared to the 2-10 keV flux of the nucleus (Figure 1, right panel). We conclude that neither LLAGN as observed with NuSTAR is contaminated by extra-nuclear point sources.
The spectral analysis of the NuSTAR and XMM-Newton data was performed using Xspec version 12.9.1p (Arnaud 1996). The photo-electric cross-sections of Verner et al. (1996) and the abundances of Wilms et al. (2000) are used throughout to account for absorption by neutral gas. We bin the spectra to have a S/N ratio of 6 in each spectral bin, and used the statistic in Xspec for model parameter estimation and error calculation. For all spectral fits, we added a multiplicative constant normalization between FPMA and FPMB, frozen to 1 for the former and allowed to vary for the latter to account for any calibration uncertainties between the two instruments. We applied the same strategy to account for any calibration uncertainties between the different EPIC instruments. We find these calibration uncertainties to be within 2%. We also allowed for a constant normalization factor between NuSTAR and XMM-Newton instruments, and found that such an uncertainty is around %. Finally, all quoted errors throughout the manuscript are at the level, unless otherwise noted.
3 Results
3.1 Timing analysis
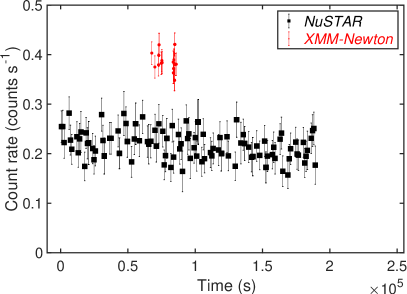
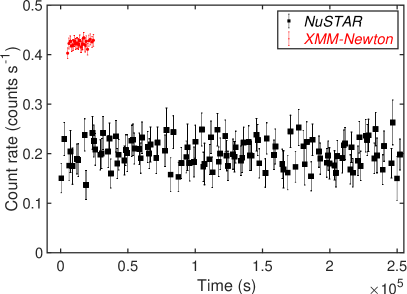
Figure 2 shows the background corrected NuSTAR and XMM-Newton light curves, in the energy range 3-60 keV and 0.5-10 keV, respectively, for both NGC 3998 and NGC 4579. All light curves are binned at 1 ks resolution, except for the XMM-Newton observation of NGC 3998. It is binned at 200 s resolution to accomodate the many short good time intervals as a result of filtering out time intervals of high background flaring activity. Nonetheless, we find no obvious variability in either source over the full length of the XMM-Newton and NuSTAR observations; the latter spanning days in length. Using XMM-Newton, we derive a upper limit of 10% on flux variability on time-scales of 1 ks. On longer time-scales of 5 and 10 ks, we derive upper limits of 30% and 20% on flux variability using NuSTAR. For a more rigorous look at the variability of both sources, we built the power spectral density (PSD) using the Lomb-Scargle Periodogram and NuSTAR light curves binned at 60 seconds. The PSD of the two sources consist of only white noise with no significant red noise component in the frequency range Hz.
3.2 Spectral analysis
3.2.1 NGC 3998
Before we delved into the spectral analysis of the NuSTAR+XMM-Newton observations, we first checked the highest energy bin in which NGC 3998 is detected with NuSTAR. We calculated the number of exposure and background-corrected counts from the source location at energies keV, in energy bins of 10 keV. We detect the source in the energy bin 50-60 keV with a significance of ; counts. Above 60 keV, the source becomes indistinguishable from background. Hence, all the spectral analysis for NGC 3998 was done in the 3 to 60 keV range for NuSTAR and 0.5-10 keV for XMM-Newton.
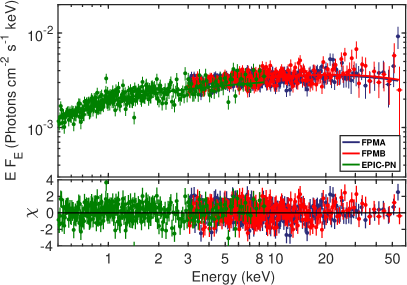
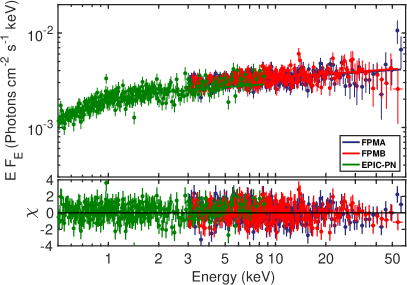
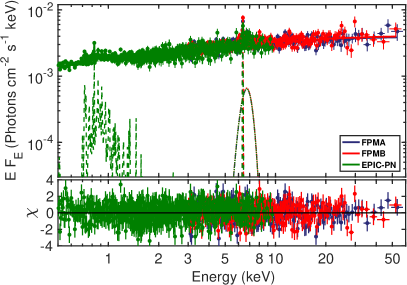
We started our spectral analysis with a simple absorbed (using tbabs model in Xspec) power-law (PL) fit to the NuSTAR+XMM-Newton spectra simultaneously. This simple model is the preferred one to the previous XMM-Newton-only data (e.g., Ptak et al. 2004). We find a statistically acceptable fit with a of 1244 for 1222 degrees of freedom (d.o.f.). We find a small intrinsic hydrogen column density of about cm-2, and a hard photon index . Nevertheless, structured residuals are visible mainly at high energies (Figure 3). Hence, we replaced the PL with a high-energy exponentially-cuttoff one; the cutoffpl model in Xspec. The reduced for this fit is 1217 for 1221 d.o.f. This is an improvement of for 1 additional free parameter; the cutoff energy. An F-test comparison between the two models indicates that the probability for the improvement due to the cutoffpl fit (compared to the one with a single absorbed PL) to occur by chance is . We conclude that the cut-off energy is required by the data and that the cutoffpl model is the best fit model to the NuSTAR+XMM-Newton spectra of NGC 3998.
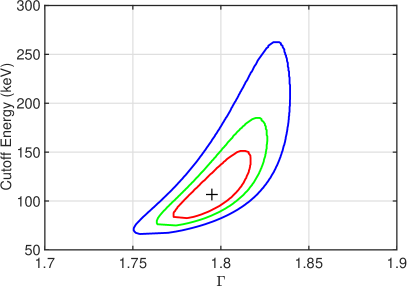
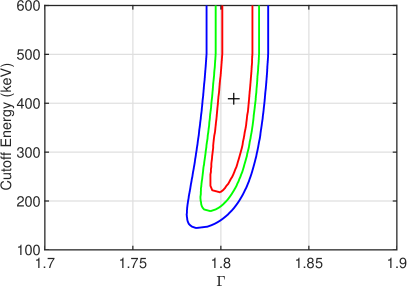
The cutoff energy is well constrained by our data keV, and the photon index is slightly harder, , compared to the PL model. We find a 0.5-10 keV flux of about erg s-1 cm-2 and a slightly lower one, erg s-1 cm-2, in the hard 10-60 keV band. The 0.5-10 keV flux that we measure is consistent, within errors, with the one measured 15 years earlier with XMM-Newton (Ptak et al. 2004; Younes et al. 2011). The best-fit spectral parameters are summarized in Table 2, while the data and best-fit cutoff PL model are shown in Figure 3. We also show in Figure 4 the 1, 2, and 3 contours of the cutoff energy and the photon index .
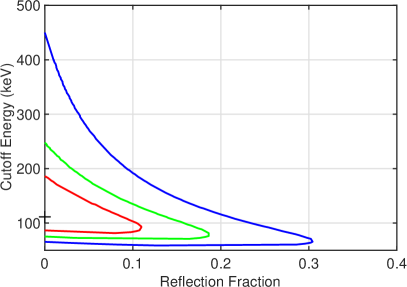
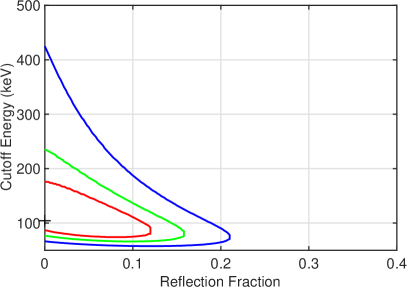
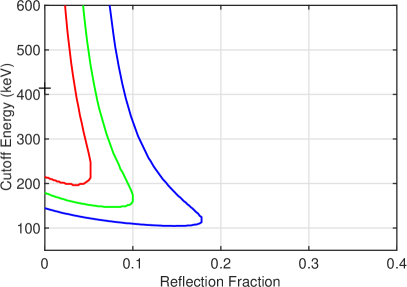
Although we detect no sign of reflection off of dense material, e.g., from an accretion disk or a dense molecular torus, we fit the NuSTAR+XMM-Newton spectra with a reflection model to assess the reflection fraction limit that we can derive with our data. We used the pexrav model implemented in Xspec which utilizes as continuum an exponentially cutoff PL (Magdziarz & Zdziarski 1995). The model is also dependent on the inclination angle of the source, which we fixed to 45 degrees, and on elemental abundances which we assumed to be solar (we verified that changing these parameters within a valid range does not affect our results). We find a good fit to the data with this model with for 1220 d.o.f. The result is consistent with no reflection and we derive a upper limit on the reflection fraction of a fiducial reflection component of 0.06. The continuum fit parameters are fully consistent with that of the cutoffpl model fit. We also fit the data using the pexmon model instead of pexrav, which has the advantage of self-consistently including reflection due to atomic species such as the Fe K, Fe K, and Ni K (Nandra et al. 2007). We find a statistically equivalent fit with for 1220 d.o.f. The only noticeable difference between the two models is the constraint on the reflection fraction, which is shown as contour plots in Figure 5. Due to the non-detection of any Fe lines in the spectrum of NGC 3998, the allowed parameter space for the reflection fraction in the case of pexmon is more stringent. Hence, we consider as conservative the upper-limit on as derived with pexrav. The constraint on the cutoff energy is similar in the two cases. The best-fit parameters of both models are listed in Table 2.
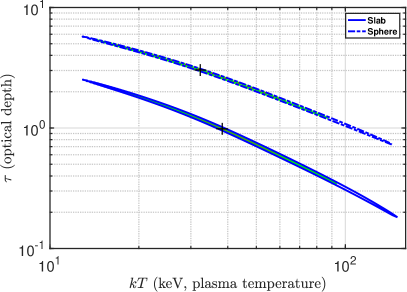
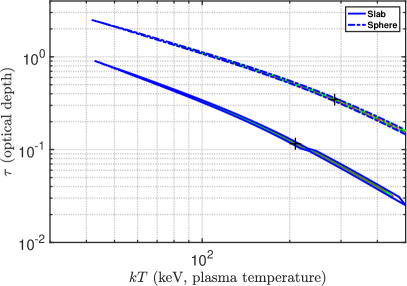
Finally, we fit the NGC 3998 spectrum with physically motivated emission models. Assuming that the accretion geometry is consistent with a hot flow, the emission process is expected to be either thermal bremsstrahlung and/or Comptonization of soft photons by the hot plasma in the flow (see Yuan & Narayan 2014, and references therein). Hence, we fit the spectrum with the thermal bremsstrahlung model zbremss in Xspec. This model does not give a good fit to the data with a of 2898 for 1222 d.o.f. Fitting the data with a model consisting of 2 thermal bremsstrahlung model gives a of 1294 for 1219 d.o.f.; considerably worse than the cutoff PL model, and resulting in strong residuals at hard X-rays. We next fit the spectrum with the Comptonization model compTT in Xspec (Titarchuk 1994). We assumed that the seed photon temperature is 10 eV. Assuming either a spherical or slab geometry for the Compton cloud, we get a good fit to the data with a of 1218 for 1222 d.o.f., equivalent in goodness to the phenomenological cutoff PL model. In the spherical geometry case, we get a plasma temperature keV and an optical depth , while the slab geometry results in a plasma temperature keV and an optical depth . The contour plots of the optical depth and temperature are shown in Figure 6 for the spherical (dashed lines) and the slab (solid lines) geometries, respectively. Regardless of the geometry assumed, we find a similar plasma temperature in the range 15 to 150 keV. The optical depth, on the other hand, is a factor of 2 to 3 smaller for the slab geometry compared to the spherical case. We discuss these results in section 4.
3.2.2 NGC 4579
Similar to our previous analysis, we first determined the highest energies at which NGC 4579 is detected with NuSTAR. Although the background was slightly larger in this case, we detect NGC 4579 up to 60 keV at the level, with a background and exposure corrected number of counts of .
We fit the NGC 4579 NuSTAR+XMM-Newton spectra simultaneously, starting with a simple absorbed PL. The fit is statistically poor, with a of 2312 for 1840 d.o.f. Residuals due to this fit were clear at low energies, and in the form of emission lines around the Fe-line complex. Hence, we decided to ignore data in the energy range 5.5-8.0 keV in order to first establish the best-fit continuum model. We note that the intrinsic absorption to NGC 4579 was consistent with 0 with a upper limit of cm-2, therefore, in the following we removed the contribution from any intrinsic absorber. Most early-type galaxies emit an extended hot diffuse X-ray component usually fit to an emission model from an optically thin plasma (Fabbiano 1989). Hence, we fit the broad-band spectrum of NGC 4579 with a combination of a PL and the Xspec mekal component (Mewe et al. 1985; Kaastra & Mewe 1993) to model the thermal emission from hot diffuse gas in the soft band. The fit is statistically good with a of 1759 for 1675 d.o.f, and no strong residuals are present at low energies. We find a plasma temperature and a PL photon index . Replacing the PL model with a cutoff PL, we find an equally good fit with a of 1756 for 1674 d.o.f. Hence, the data does not statistically require a high energy cutoff. We place a upper-limit on any fiducial cutoff keV. For consistency with NGC 3998, in the following, we utilize the cutoff PL model to establish best-fit parameters for the Fe line complex. None of the fit parameters are affected if we use a simple PL model.
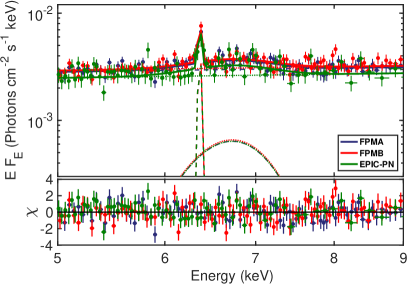
The residuals that we observe in our data around the Fe complex cover the full to keV energy range (Figure 7). Previously, these residuals have been fit with either a narrow emission line at keV and a broad component at slightly higher energies (Dewangan et al. 2004), or a combination of 3 narrow lines at energies fixed at the Fe K and the highly ionized Fe species; Fe XXV and Fe XXVI (Terashima et al. 1998). Hence, we firstly added to our continuum model two Gaussian line profiles. These two components eliminate any outstanding residuals in the energy range 6 to 7 keV, and we find a of about 1955 for 1880 d.o.f. for the full 0.5-60 keV fit. We indeed find that the two lines consist of a narrow component at keV with an unresolved width (fixed to its best fit value of 0.018 keV), and a broader component with energy centered at keV, consistent with emission from highly ionized Fe XXV. Secondly, we fit the Fe complex with three Gaussian components with energies fixed at 6.4, 6.7 and 6.97 keV. Without fixing the widths of the lines there is no unique solution and there is a tendency for the Fe XXV or Fe XXVI to acquire large widths (3.2 keV) and fit part of the continuum, hence, to test this hypothesis, we also fixed the widths of these lines to 0, i.e., assuming narrow components. We find an equally good fit with a of 1970 for 1882 d.o.f.
| NGC 4579 | mekal+cutoffpl | mekal+pexrav | mekal+pexmon | mekal+compTT (slab) | mekal+compTT (sphere) |
| (keV, compTT) | – | – | – | ||
| – | – | – | |||
| (keV, mekal) | |||||
| – | – | ||||
| – | – | – | – | ||
| (keV) | – | – | |||
| – | – | – | |||
| ( erg s-1 cm-2) | |||||
| – | – | – | – | ||
| ( erg s-1 cm-2) | |||||
| ( erg s-1) | |||||
| /d.o.f. | 1955/1880 | 1953/1880 | 1954/1880 | 1955/1880 | 1955/1880 |
-
Notes.
a Spectral properties of the previous XMM-Newton observation of NGC 4579.
| Model | EW | |||
| keV | keV | ( photons cm-2 s-1) | eV | |
| Two Gaussians | 0.018(f) | |||
| Three Gaussians | (f) | 0.0(f) | ||
| (f) | 0.0(f) | |||
| (f) | 0.0(f) |
Figure 8 shows the broad-band best-fit model and a zoom-in at the Fe line complex fit with 2 Gaussian components (the residuals due to a fit with 3 narrow Gaussians look fairly similar). We report the best-fit model parameters of the continuum in Table 3, while the Fe lines best fit parameters are reported in Table 4. Figure 9 shows the 1, 2, and 3 contours of and .
Similar to NGC 3998, we do not detect any sign of reflection off of a geometrically thick accretion disk. Nonetheless, in order to establish an upper-limit on any fiducial reflection component, we replace the cutoff PL with the pexrav model in fitting the broad-band spectrum of NGC 4579. We fixed the inclination angle of the disk to 45 degrees, and assumed solar abundances. We find a good fit to the data with a for 1880 d.o.f. We find a upper limit on the reflection . The continuum fit parameters are fully consistent with that of the cutoffpl model fit. The best-fit parameters are listed in Table 2 and we show in Figure 9 the 1, 2, and 3 contours of and . These results are discussed in Section 4.
We also attempted to fit the NGC 4579 spectrum with the pexmon model. We removed the neutral Gaussian component from the model, which is self-consistently produced by pexmon in Compton-thick material. This fit results in a of 1975 for 1881 d.o.f. Strong residuals are seen at high energies above 15 keV where the model overestimates the flux from the source.
Given the possible Compton-thin origin of the neutral Fe line that we see in NGC 4579, we also fit the spectrum with the MYTorus model (Murphy & Yaqoob 2009; Yaqoob 2012). This model includes the reprocessed continuum and neutral Fe K, Fe K, and Ni K emission by a torus-shaped structure with an opening angle of 60∘. The continuum is assumed a PL with a high-energy cutoff fixed at 500 keV, and the column densities for the MYTorus tables reproducing the scattered continuum and emission lines are tied. A mekal component was also included to the continuum model. We also included contributions from narrow Fe XXV and Fe XXVI by fixing the 2 Gaussian components to their expected energies and their widths to 0. The fit is good with a of 1919 for 1880 d.o.f. and we do not observe any unmodeled residuals around the Fe complex. The hydrogen column density of the material responsible for the reprocessed continuum and the production of the neutral Fe K line is cm-2 (errors quoted at the 3 level). We conclude that the line is likely originating from a Compton-thin material at large distances from the central BH.
Although we do not detect a cutoff in NGC 4579, we fit the broad-band spectrum of the source with a physical Comptonization model, compTT in Xspec, to establish the allowed parameter space of the optical depth and temperature of the X-ray emitting plasma, and to allow comparison with NGC 3998 and, more broadly, luminous AGN. We find a good fit to the spectrum with a of 1955 for 1880 d.o.f., comparable to our best fit with a cutoff PL. We find a 1 lower limit on the plasma temperature of keV for either the slab or spherical geometry. We find an optical depth in both cases, indicating an optically thin plasma. The best-fit parameters are summarized in Table 3 and we show the contours versus in Figure 10.
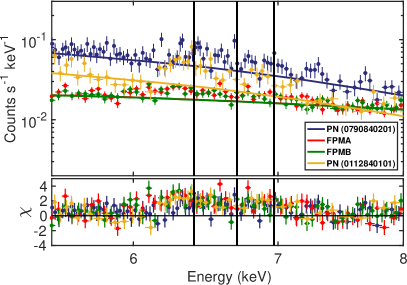
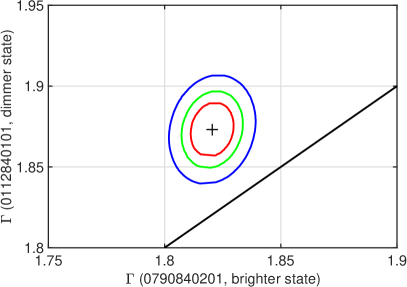
The 0.5-10 keV flux that we derive in our observation is 60% larger than the one derived in the previous XMM-Newton observation of NGC 4579 (Dewangan et al. 2004). Hence, to search for any spectral variability in concordance to the brighter flux, we reanalyzed the historic XMM-Newton observation taken on 2004 June 30 (obs. ID 0112840101) as described in Section 2. We fit the spectra of the current and previous observations simultaneously with a continuum consistent with the one discussed above, i.e., a hot thermal plasma model and a cutoff PL (we fixed the cutoff energy for the previous XMM-Newton observation to 1 MeV). We linked the thermal spectral components between the 2 observations since no variability is expected in the hot diffuse gas over years time-scales. We let the cutoff PL index free to vary. Firstly, we exclude the Fe complex between 5.5 and 8 keV. The residuals in this energy range compared to the best fit continuum are shown in Figure 7. We fit the Fe complex with either 2 or 3 Gaussian components, in the same manner we conducted the spectral analysis of our current observation. We let the Gaussian parameters free to vary between the 2 observations. Within statistical uncertainties we do not detect any variability in the Fe lines. Hence, we link the Gaussian parameters between the previous and the current observation. On the other hand, we detect a significant variability in the PL photon index, with the previous, dimmer observation possessing a softer spectrum. Figure 11 shows the contour plot of the indices from the two observations. We summarize in Table 3 the continuum spectral parameters of this fit.
4 Discussion
The superior sensitivity of NuSTAR is allowing, for the first time, a detailed look at the hard X-ray view of LLAGN, e.g., NGC 7213 and M 81 (Ursini et al. 2015; Young et al. 2018). In this paper, we add to this growing sample by presenting the analysis of the broad-band, 0.5-60 keV, X-ray emission from two LLAGN, NGC 3998 and NGC 4579, observed simultaneously with NuSTAR and XMM-Newton. The NuSTAR live-time exposure of the two sources are about 100 and 120 ks, respectively, taken over 2.5 and 3 days. This allowed us to look for variability at days time-scale, rarely available for LLAGN. We do not detect any strong variability in either source. Their power spectra in the 3-60 keV band is consistent with white noise in the frequency range Hz. This confirms that indeed most LLAGN show little to no variability on days time-scales (Binder et al. 2009; Younes et al. 2011; Young et al. 2018), as opposed to the strong, short time-scale variability seen in bright Seyfert galaxies (e.g., González-Martín & Vaughan 2012).
The broad-band 0.5-60 keV continua of NGC 3998 and NGC 4579 are best fit with a cutoff PL (discussed in detail below) and a PL plus emission from hot thermally-emitting plasma, respectively. Very small intrinsic absorption is required for NGC 3998, while for NGC 4579 the absorption column density is consistent with the Galactic one. This is in line with the picture of LLAGN being devote of absorbing material, such as a broad-line region and/or a torus in their central engine (Ho 2008). Moreover, She et al. (2018b) showed a positive correlation between the absorption column density and the Eddington ratio, , in a sample of LLAGN, in striking contrast to luminous AGN (Ricci et al. 2017), but consistent with the expectation of absorption caused by outflowing material from a hot accretion flow (Yuan et al. 2015). Our two sources nicely follow the correlation, especially NGC 3998, where we indeed measure a very small intrinsic absorption corresponding to its .
Neither source shows any hint of Compton reflection hump at hard X-rays, a ubiquitous feature in luminous AGN. The upper-limits that we derive on their reflection fractions, 0.30 and 0.18 for NGC 3998 and NGC 4579, respectively, are strongly constraining and place the two sources within the same -Eddington ratio parameter space as other LLAGN, e.g., M81 (, Young et al. 2018), NGC 7231 (, Ursini et al. 2015), and the low Eddington ratio AGN NGC 2110 (, Marinucci et al. 2015). These very small reflection fractions are at odds with the much higher values measured for luminous AGN (e.g., Risaliti et al. 2013; Parker et al. 2014; Kara et al. 2015a; Keck et al. 2015). With the addition of NGC 3998 and NGC 4579, there is now mounting evidence that the lack of reflection in the spectra of LLAGN, if not universal, is a common feature of the population. The nature of the hard X-ray Compton hump in luminous AGN is believed to be reflection of the primary continuum source from the inner regions of a dense, optically thick accretion disk extending close to the innermost stable circular orbit (George & Fabian 1991). The absence of this signature component from the spectra of LLAGN reinforces the idea that most likely their inner accretion disk is truncated at a certain large radius from the BH, which is instead filled with an optically thin, radiatively inefficient hot accretion flow (e.g., Esin et al. 1997; Narayan et al. 1997; Yuan 2007; Yuan & Narayan 2014). Moreover, the absence of the Compton hump is consistent with the lack of another reflection component in LLAGN; the broad Fe K line (e.g., González-Martín et al. 2009; Younes et al. 2011). The latter is also ubiquitous in the X-ray spectra of bright AGN, and have been shown to correlate temporally with the Compton hump implying similar physical nature (Kara et al. 2015b).
We confirm the existence of the Fe complex in NGC 4579, which was also detected with ASCA (Terashima et al. 1998, 2000) and the previous XMM-Newton observation of the source (Dewangan et al. 2004). The residuals in our present observation indicate a complex blending of lines, which requires at least 2 Gaussian components. If the energies and the widths of the Gaussians are left free to vary, the residuals are best fit with an unresolved, narrow Fe K line at 6.4 keV and a moderately broad component consistent with highly ionized Fe XXV at 6.7 keV. Nevertheless, the complex can also be well fit with three, relatively narrow Gaussian components with energies fixed to 6.4, 6.7, and 6.97 keV, corresponding to Fe K, and highly ionized Fe XXV and Fe XXVI.
The narrow neutral component corresponding to Fe K is unlikely to originate in Compton-thick material. Fitting the NGC 4579 spectrum with the reflection model pexmon, which self-consistently includes contribution from neutral Fe originating in Compton-thick material, does not adequately fit the data. We observe strong residuals at high energies above 20 keV where the model overestimates the data. This result may imply that the formation of the observed Fe K line in Compton-thick material requires a strong reflection component at high energies that is not detected in the spectrum. On the other hand, the MYTorus model gives an adequate fit to the data, including the narrow Fe K feature. According to this model, the line is most likely produced in an optically thin region with a hydrogen column density cm-2 (e.g., the broad-line region; Yaqoob & Padmanabhan 2004). This is consistent with the presumed production site of the line in other LLAGN, namely M 81 and NGC7213 (Young et al. 2018; Ursini et al. 2015). NGC 4579, similar to many other LLAGN, show strong signatures of silicate emission features in the mid-IR strongly indicative of a dusty environment (Gallimore et al. 2010; Mason et al. 2012). Such environments are also possible sites for forming Fe K lines; dust may help enhance the Fe K equivalent width while suppressing strong high-energy reflection components due to a decrease in the backscattering opacity in the gas (Draine 2003). Although to that end, we note that NGC 3998 does show strong silicate features with no indication of Fe K emission (Sturm et al. 2005; Mason et al. 2012).
The highly ionized Fe XXV and Fe XXVI lines are most likely the result of collisional ionization in optically thin gas, e.g., possibly at the transition layer between a truncated external thin accretion disk and a hot inner accretion flow. The temperature at the transition layer is supposedly K (Narayan et al. 1997; Perna et al. 2000), i.e., the temperatures required to produce highly ionized Fe. These lines can also be broad with equivalent width as large as a few hundred eV (Xu 2011). Such models have been shown to naturally explain the Fe XXV and Fe XXVI lines seen in M 81 (Young et al. 2007) and the Fe XXV line seen in Sgr A∗ (Xu et al. 2006; Wang et al. 2013). Another possibile production site is the outflows from the accretion flow. In this scenario, blueshift corresponding to the outflow velocity is expected. Unfortunately, energy resolution and small number statistics renders the distinction between the above two possibilities difficult.
The current observation of NGC 4579 shows a factor 60% larger flux compared to the previous XMM-Newton observation taken 13 years earlier. At the same time, the source spectrum shows a significant hardening (Figure 11). This is in line with the harder-when-brighter correlation established for different samples of LLAGN (e.g., Younes et al. 2011; She et al. 2018a). Assuming that the brighter flux is the result of increased accretion rate onto the SMBH, the spectral hardening can be understood in the context of radiatively inefficient, optically thin, hot accretion flows. The increased densities in the flow will lead to more efficient inverse Compton scattering of primary synchrotron photons from the flow leading to a harder spectrum (e.g., Qiao & Liu 2013; Yang et al. 2015). Within statistical uncertainties, we do not find any variability in the Fe line complex between the two observations.
The NuSTAR+XMM-Newton data of NGC 3998 revealed the need for a high energy cutoff to best fit its broad-band 0.5-60 keV spectrum. We measure a cutoff energy keV. This represents the lowest and best constrained cutoff energy ever measured for a LLAGN. At first glance, this cutoff energy resembles the ones derived for Seyfert Galaxies and other luminous AGN. However, for normal AGN, the cutoff energy is found to be inversely proportional to the Eddington ratio (Ricci et al. 2018; however, note that this relation is not seen when a much smaller catalog of bright AGN observed with NuSTAR is considered; Tortosa et al. 2018). Sources with Eddington ratio, tend to have a cutoff energy of about 370 keV, while the ones with possess a much smaller cutoff energy, keV. NGC 3998, hence, represents an obvious outlier to this correlation, lying in the parameter space of low cutoff energy with very small Eddington ratio.
The negative correlation as observed for normal AGN could be understood in the context of compact, X-ray emitting corona (Haardt & Maraschi 1993). The energy exchange becomes more efficient between photons and particles with decreasing size and/or increasing luminosity of the X-ray emitting corona, which cools down its plasma content leading to a decrease in temperature. Following the definition of the compactness parameter (e.g., Fabian et al. 2015, 2017; Ricci et al. 2018), and assuming a typical luminous AGN corona size where is the gravitational radius, we estimate . This can be thought of as a rough upper-limit as can indeed be larger for the LLAGN case. On the other hand, we find electron temperatures in the range of from our Comptonization spectral fits111The electron temperatures that we derive through the Comptonization model do indeed follow the relation for optically thin plasma, where is the cutoff energy established through our cutoff PL modeling.. This small compactness parameter along with the small electron temperature places NGC 3998 in uncharted territory in the compactness-temperature plane (Fabian et al. 2015), closer to the electron-proton coupling line and bremsstrahlung as cooling modes rather than electron-electron coupling. The latter is the preferred radiation process for luminous AGN. This could imply that the physical properties of the X-ray emitting region of NGC 3998, and possibly most LLAGN, differs markedly from luminous AGN. The very small compactness parameter and radiation process argues for the expectation of a large, optically thin hot accretion flow.
We note that using the lower limits that we derive from our Comptonization spectral fits to the NGC 4579 spectra, we derive an electron temperature and a compactness parameter . These limits fall within the range of electron-proton coupling line. However, since only upper-limits can be derived in such a case, the spectrum could still be consistent with electron-electron coupling similar to what is observed for bright AGN. Future soft MeV missions are crucial to constrain the high-energy cutoff in LLAGN spectra, and better understand the physical properties of the high-energy emitting region in these sources.
The high quality, simultaneous NuSTAR+XMM-Newton data allowed us to fit physically-motivated models to the broad-band spectrum of NGC 3998. A bremsstrahlung-only model does not give an adequate fit to the data. In fact, we also tried to fit the spectrum with 2 bremsstrahlung components, akin emission from a 2 temperature hot accretion flow, and this too resulted in a statistically poor fit. The Comptonization model compTT, on the other hand, resulted in a good fit, with best fit statistics equivalent to the one with the phenomenological cutoff PL model. Both a spherical geometry for the Compton cloud and a slab geometry resulted in equally good fits. The contour plots of these fits, as shown in Figure 6, indicate a high level of degeneracy between the electron temperature and the optical depth, a fact already known for Comptonization models (e.g., Brenneman et al. 2014; Baloković et al. 2015). Nonetheless, within the level, both geometries result in a plasma temperature ranging from 15 keV to 150 keV. The optical depth, however, differs between the two geometries, and ranges between 0.8 and 6 for the spherical geometry and 0.2 to 2.5 for the slab geometry. Smaller optical depths for the slab geometry compared to the spherical case have already been pointed out (in, e.g., Lubiński et al. 2010, Brenneman et al. 2014, Baloković et al. 2015), and are the result of integration over radial distances and scale heights, respectively. These results support the picture of Comptonization as the dominant emission process over bremsstrahlung in NGC 3998. Our results are also consistent with Comptonization emission from optically-thin hot accretion flows (e.g., ADAF, Yuan 2007), which predict high temperatures of keV and small optical depths (derived after integrating vertically, hence, to be compared with the slab geometry results). Finally, this low-energy cutoff detection in NGC 3998 limits the validity range of jet emission models. Pure synchrotron emission from a jet is inherently difficult to produce a cutoff at hard X-rays (Zdziarski et al. 2004), nevertheless, Comptonization in the base of a jet has been shown to produce such curvature in the X-ray spectra of hard state X-ray binaries (e.g., Markoff et al. 2005).
5 Summary
In the present work, we report on the broad-band X-ray timing and spectral analysis of the two LLAGN NGC 3998 and NGC 4579 through simultaneous NuSTAR+XMM-Newton observations. The summary of our main results are the following:
-
•
We do not detect any significant variability in either source over the -day length of the NuSTAR observations; both sources have power spectra consisting of white noise in the frequency range Hz.
-
•
The broad-band 0.5-60 keV spectrum of NGC 3998 is best fit with a cutoff power-law; cutoff energy keV. This represents the lowest and best constrained high-energy cutoff ever measured for a LLAGN. Such relatively low value places NGC 3998 as an outlier to the anticorrelation found in luminous AGN between and the Eddington ratio.
-
•
NGC 3998 spectrum is consistent with a Comptonization model with either a sphere or slab geometry with optical depths in the range of 0.8-6 and 0.2-2.5, respectively, corresponding to plasma temperatures between 20 and 150 keV. Its spectrum is inconsistent with bremsstrahlung emission.
-
•
The broad-band 0.5-60 keV spectrum of NGC 4579 is best fit with a combination of a hot thermal plasma model, a power-law, and a blend of Gaussians to fit an Fe complex observed between 6 and 7 keV. These residuals could either be fit with a narrow Fe K line at 6.4 keV and a moderately broad Fe XXV line, or 3 relatively narrow lines, which includes contribution from Fe XXVI.
-
•
NGC 4579 flux is 60% brighter than previously detected with XMM-Newton, accompanied by a hardening in the spectrum.
-
•
Neither source shows any reflection hump with a reflection fraction upper-limits and for NGC 3998 and NGC 4579, respectively.
The very low reflection fractions that we derive for our two sources, along with the lack of variability and broad Fe K lines, argue for an altered accretion geometry in LLAGN compared to luminous AGN. This reinforces the picture of a truncated thin disk which is replaced by a pressure-dominated hot accretion flow. This picture is also in line with our finding of a harder-when-brighter spectrum for NGC 4579. Finally, our most interesting result, the relatively low high-energy cutoff that we measure for NGC 3998 ( keV), is inconsistent with the picture of X-ray emission emanating from a compact corona regulated through electron-electron coupling, as is widely accepted for luminous AGN. The combination of very low compactness and 20-150 keV plasma temperature that we derive is more in line with emission from a large optically thin volume where electron-proton coupling and bremsstrahlung act as cooling modes. Such picture is again in favor of emission from an optically-thin hot accretion flow.
Acknowledgments
This work made use of data from the NuSTAR mission, a project led by the California Institute of Technology, managed by the Jet Propulsion Laboratory, and funded by the National Aeronautics and Space Administration. We thank the NuSTAR Operations, Software and Calibration teams for support with the execution and analysis of these observations. This research has made use of the NuSTAR Data Analysis Software (NuSTARDAS) jointly developed by the ASI Science Data Center (ASDC, Italy) and the California Institute of Technology (USA). GY acknowledges support from NASA under NuSTAR Guest Observer cycle-2, proposal number 15-NUSTAR215-0024. LCH was supported by the National Key R&D Program of China (2016YFA0400702) and the National Science Foundation of China (11473002, 11721303). Y.T. is supported by JSPS Grants-in-Aid for Scientific Research 15H02070 and 16K05296. FGX and FY are supported in part by National Key R&D Program of China (grants 2016YFA0400804 and 2016YFA0400704), the Natural Science Foundation of China (grants 11873074, 11573051, 11633006, 11650110427, 11661161012, 11303008, and 11473002), and the Key Research Program of Frontier Sciences of CAS (grants QYZDJSSW-SYS008 and QYZDB-SSW-SYS033 ). FGX is also supported by the Youth Innovation Promotion Association of CAS (id. 2016243) and the Natural Science Foundation of Shanghai (No. 17ZR1435800). We thank the referee for a concise and thorough reading of the manuscript that led to an improved version of the article.
References
- Arnaud (1996) Arnaud, K. A. 1996, in ASP Conf. Ser. 101: Astronomical Data Analysis Software and Systems V, 17
- Baloković et al. (2015) Baloković, M., Matt, G., Harrison, F. A., et al. 2015, ApJ, 800, 62
- Binder et al. (2009) Binder, B., Markowitz, A., & Rothschild, R. E. 2009, ApJ, 691, 431
- Blandford & Begelman (1999) Blandford, R. D. & Begelman, M. C. 1999, MNRAS, 303, L1
- Brenneman et al. (2014) Brenneman, L. W., Madejski, G., Fuerst, F., et al. 2014, ApJ, 788, 61
- Dewangan et al. (2004) Dewangan, G. C., Griffiths, R. E., Di Matteo, T., & Schurch, N. J. 2004, ApJ, 607, 788
- Di Matteo et al. (2001) Di Matteo, T., Carilli, C. L., & Fabian, A. C. 2001, ApJ, 547, 731
- Draine (2003) Draine, B. T. 2003, ApJ, 598, 1026
- Eracleous et al. (2010) Eracleous, M., Hwang, J. A., & Flohic, H. M. L. G. 2010, ApJS, 187, 135
- Esin et al. (1997) Esin, A. A., McClintock, J. E., & Narayan, R. 1997, ApJ, 489, 865
- Fabbiano (1989) Fabbiano, G. 1989, ARA&A, 27, 87
- Fabian et al. (2017) Fabian, A. C., Lohfink, A., Belmont, R., Malzac, J., & Coppi, P. 2017, MNRAS, 467, 2566
- Fabian et al. (2015) Fabian, A. C., Lohfink, A., Kara, E., et al. 2015, MNRAS, 451, 4375
- Flohic et al. (2006) Flohic, H. M. L. G., Eracleous, M., Chartas, G., Shields, J. C., & Moran, E. C. 2006, ApJ, 647, 140
- Gallimore et al. (2010) Gallimore, J. F., Yzaguirre, A., Jakoboski, J., et al. 2010, ApJS, 187, 172
- George & Fabian (1991) George, I. M. & Fabian, A. C. 1991, MNRAS, 249, 352
- González-Martín et al. (2009) González-Martín, O., Masegosa, J., Márquez, I., Guainazzi, M., & Jiménez-Bailón, E. 2009, A&A, 506, 1107
- González-Martín & Vaughan (2012) González-Martín, O. & Vaughan, S. 2012, A&A, 544, A80
- Gu & Cao (2009) Gu, M. & Cao, X. 2009, MNRAS, 399, 349
- Haardt & Maraschi (1993) Haardt, F. & Maraschi, L. 1993, ApJ, 413, 507
- Harrison et al. (2013) Harrison, F. A., Craig, W. W., Christensen, F. E., et al. 2013, ApJ, 770, 103
- Hernández-García et al. (2014) Hernández-García, L., González-Martín, O., Masegosa, J., & Márquez, I. 2014, A&A, 569, A26
- Ho et al. (1997) Ho, L. C., Filippenko, A. V., & Sargent, W. L. W. 1997, ApJ, 487, 568
- Ho (1999) Ho, L. C. 1999, ApJ, 516, 672
- Ho (2008) Ho, L. C. 2008, ARA&A, 46, 475
- Ho (2009) Ho, L. C. 2009, ApJ, 699, 626
- Ho et al. (1997) Ho, L. C., Filippenko, A. V., Sargent, W. L. W., & Peng, C. Y. 1997, ApJS, 112, 391
- Ho et al. (2009) Ho, L. C., Greene, J. E., Filippenko, A. V., & Sargent, W. L. W. 2009, ApJS, 183, 1
- Kaastra & Mewe (1993) Kaastra, J. S. & Mewe, R. 1993, A&AS, 97, 443
- Kara et al. (2015a) Kara, E., Fabian, A. C., Lohfink, A. M., et al. 2015a, MNRAS, 449, 234
- Kara et al. (2015b) Kara, E., Zoghbi, A., Marinucci, A., et al. 2015b, MNRAS, 446, 737
- Keck et al. (2015) Keck, M. L., Brenneman, L. W., Ballantyne, D. R., et al. 2015, ApJ, 806, 149
- Kormendy & Ho (2013) Kormendy, J. & Ho, L. C. 2013, ARA&A, 51, 511
- Lubiński et al. (2010) Lubiński, P., Zdziarski, A. A., Walter, R., et al. 2010, MNRAS, 408, 1851
- Magdziarz & Zdziarski (1995) Magdziarz, P. & Zdziarski, A. A. 1995, MNRAS, 273, 837
- Mantovani et al. (2016) Mantovani, G., Nandra, K., & Ponti, G. 2016, MNRAS, 458, 4198
- Marinucci et al. (2015) Marinucci, A., Matt, G., Bianchi, S., et al. 2015, MNRAS, 447, 160
- Markoff et al. (2005) Markoff, S., Nowak, M. A., & Wilms, J. 2005, ApJ, 635, 1203
- Mason et al. (2012) Mason, R. E., Lopez-Rodriguez, E., Packham, C., et al. 2012, AJ, 144, 11
- Mewe et al. (1985) Mewe, R., Gronenschild, E. H. B. M., & van den Oord, G. H. J. 1985, A&AS, 62, 197
- Murphy & Yaqoob (2009) Murphy, K. D., & Yaqoob, T. 2009, MNRAS, 397, 1549
- Nagar et al. (2005) Nagar, N. M., Falcke, H., & Wilson, A. S. 2005, A&A, 435, 521
- Nandra et al. (2007) Nandra, K., O’Neill, P. M., George, I. M., & Reeves, J. N. 2007, MNRAS, 382, 194
- Narayan et al. (1997) Narayan, R., Garcia, M. R., & McClintock, J. E. 1997, ApJ, 478, L79
- Narayan et al. (2000) Narayan, R., Igumenshchev, I. V., & Abramowicz, M. A. 2000, ApJ, 539, 798
- Narayan & McClintock (2008) Narayan, R. & McClintock, J. E. 2008, New A Rev., 51, 733
- Narayan & Yi (1994) Narayan, R. & Yi, I. 1994, ApJ, 428, L13
- Nemmen et al. (2014) Nemmen, R. S., Storchi-Bergmann, T., & Eracleous, M. 2014, MNRAS, 438, 2804
- Parker et al. (2014) Parker, M. L., Wilkins, D. R., Fabian, A. C., et al. 2014, MNRAS, 443, 1723
- Perna et al. (2000) Perna, R., Raymond, J., & Narayan, R. 2000, ApJ, 541, 898
- Pian et al. (2010) Pian, E., Romano, P., Maoz, D., et al. 2010, MNRAS, 401, 677
- Ptak et al. (2004) Ptak, A., Terashima, Y., Ho, L. C., & Quataert, E. 2004, ApJ, 606, 173
- Ptak et al. (1998) Ptak, A., Yaqoob, T., Mushotzky, R., Serlemitsos, P., & Griffiths, R. 1998, ApJ, 501, L37+
- Qiao & Liu (2013) Qiao, E. & Liu, B. F. 2013, ApJ, 764, 2
- Quataert et al. (1999) Quataert, E., Di Matteo, T., Narayan, R., & Ho, L. C. 1999, ApJ, 525, L89
- Ricci et al. (2017) Ricci, C., Trakhtenbrot, B., Koss, M. J., et al. 2017, Nature, 549, 488
- Ricci et al. (2018) Ricci, C., Ho, L. C., Fabian, A. C., et al. 2018, MNRAS, 480, 1819
- Risaliti et al. (2013) Risaliti, G., Harrison, F. A., Madsen, K. K., et al. 2013, Nature, 494, 449
- Shakura & Sunyaev (1973) Shakura, N. I. & Sunyaev, R. A. 1973, A&A, 24, 337
- She et al. (2018a) She, R., Ho, L. C., Feng, H., & Cui, C. 2018a, ApJ, 859, 152
- She et al. (2018b) She, R., Ho, L. C., Feng, H., & Cui, C. 2018b, ApJ, 859, 152
- Sobolewska & Papadakis (2009) Sobolewska, M. A. & Papadakis, I. E. 2009, MNRAS, 399, 1597
- Springob et al. (2007) Springob, C. M., Masters, K. L., Haynes, M. P., Giovanelli, R., & Marinoni, C. 2007, ApJS, 172, 599
- Strüder et al. (2001) Strüder, L., Briel, U., Dennerl, K., et al. 2001, A&A, 365, L18
- Sturm et al. (2005) Sturm, E., Schweitzer, M., Lutz, D., et al. 2005, ApJ, 629, L21
- Terashima et al. (2000) Terashima, Y., Ho, L. C., Ptak, A. F., et al. 2000, ApJ, 535, L79
- Terashima et al. (1998) Terashima, Y., Kunieda, H., Misaki, K., et al. 1998, ApJ, 503, 212
- Titarchuk (1994) Titarchuk, L. 1994, ApJ, 434, 570
- Tonry et al. (2001) Tonry, J. L., Dressler, A., Blakeslee, J. P., et al. 2001, ApJ, 546, 681
- Tortosa et al. (2018) Tortosa, A., Bianchi, S., Marinucci, A., Matt, G., & Petrucci, P. O. 2018, A&A, 614, A37
- Ursini et al. (2015) Ursini, F., Marinucci, A., Matt, G., et al. 2015, MNRAS, 452, 3266
- Verner et al. (1996) Verner, D. A., Ferland, G. J., Korista, K. T., & Yakovlev, D. G. 1996, ApJ, 465, 487
- Wang et al. (2013) Wang, Q. D., Nowak, M. A., Markoff, S. B., et al. 2013, Science, 341, 981
- Wilms et al. (2000) Wilms, J., Allen, A., & McCray, R. 2000, ApJ, 542, 914
- Xu (2011) Xu, Y.-D. 2011, ApJ, 729, 10
- Xu & Cao (2009) Xu, Y.-D. & Cao, X.-W. 2009, Research in Astronomy and Astrophysics, 9, 401
- Xu et al. (2006) Xu, Y.-D., Narayan, R., Quataert, E., Yuan, F., & Baganoff, F. K. 2006, ApJ, 640, 319
- Yang et al. (2015) Yang, Q.-X., Xie, F.-G., Yuan, F., et al. 2015, MNRAS, 447, 1692
- Yaqoob & Padmanabhan (2004) Yaqoob, T. & Padmanabhan, U. 2004, ApJ, 604, 63
- Yaqoob (2012) Yaqoob, T. 2012, MNRAS, 423, 3360
- Younes et al. (2010) Younes, G., Porquet, D., Sabra, B., et al. 2010, A&A, 517, A33+
- Younes et al. (2011) Younes, G., Porquet, D., Sabra, B., & Reeves, J. N. 2011, A&A, 530, A149+
- Younes et al. (2012) Younes, G., Porquet, D., Sabra, B., Reeves, J. N., & Grosso, N. 2012, A&A, 539, A104
- Young et al. (2018) Young, A. J., McHardy, I., Emmanoulopoulos, D., & Connolly, S. 2018, MNRAS, 476, 5698
- Young et al. (2007) Young, A. J., Nowak, M. A., Markoff, S., Marshall, H. L., & Canizares, C. R. 2007, ApJ, 669, 830
- Yuan (2007) Yuan, F. 2007, in Astronomical Society of the Pacific Conference Series, Vol. 373, The Central Engine of Active Galactic Nuclei, ed. L. C. Ho & J.-W. Wang, 95–+
- Yuan et al. (2015) Yuan, F., Gan, Z., Narayan, R., et al. 2015, ApJ, 804, 101
- Yuan & Narayan (2014) Yuan, F. & Narayan, R. 2014, ARA&A, 52, 529
- Yuan et al. (2004) Yuan, F., Quataert, E., & Narayan, R. 2004, ApJ, 606, 894
- Zdziarski et al. (2004) Zdziarski, A. A., Gierliński, M., Mikołajewska, J., et al. 2004, MNRAS, 351, 791
- Zhang et al. (2009) Zhang, W. M., Soria, R., Zhang, S. N., Swartz, D. A., & Liu, J. F. 2009, ApJ, 699, 281