A magnetocaloric study of the magnetostructural transitions in NiCr2O4
Abstract
The spinel NiCr2O4 is known to show a ferrimagnetic transition at K, and magneto-structural transitions at K and K. We present a detailed magnetic and magnetocaloric effect (MCE ) study across these transitions. The shows a positive anomaly at , , and . In addition to these anomalies, we report a new unreported feature at K where shows a negative anomaly or the inverse MCE. An Arrot plot of the isothermal magnetization data reveals important information about the nature of the possible phases revealed in . We have also made a scaling analysis of the data around these transitions. This analysis suggests that the transition at is a second-order Mean field like transition, the transition at is not second order and is non-mean field like, while the new transition at K is non-mean field like but is second order in nature. Our study demonstrates that magnetocaloric effect is sensitive to magneto-structural changes in materials and can be used for the identification of new phases and transitions.
I Introduction
Materials crystallizing in the spinel structure show many multifunctional behaviours such as, magnetodielectric, multiferroic, magnetoelastic, and magnetocaloric effects. The variety of such multifunctional behaviours in a single material class is due to correlations among different degrees of freedom such as spin, lattice and orbital Jin fan et al. (2006); Franco et al. (2012); Mufti et al. (2010); Lee et al. (2008); Lapine et al. (2011); Eerenstein et al. (2006); Bibes and Barthélémy (2008); Cheong and Mostovoy (2007); Ramesh and Spaldin (2007); Kimura et al. (2003); Fiebig et al. (2016); Ramirez et al. (1997). The spinel oxides are any of a class of minerals with the chemical formula O4 Jin fan et al. (2006); Ramirez et al. (1997); Lee et al. (2002); Radaelli et al. (2002); Bragg (1915); Ueno et al. (1999). NiCr2O4 is a normal spinel material crystallizing in the cubic space group at high temperatures Mufti et al. (2010); Crottaz et al. (1997). As the temperature is lowered NiCr2O4 undergoes multiple transitions. A structural transition from cubic to tetragonal symmetry occurs at K Dunitz and Orgel (1957); Kocsis et al. (2013). A coupled magneto-structural change from tetragonal to orthorhombic symmetry accompanied by ferrimagnetic order between the Cr and Ni sublattices occurs at K Suchomel et al. (2012a); Ishibashi and Yasumi (2007). Another magneto-structural transition occurs at K involving subtle changes in tetrahedra Kocsis et al. (2013); Suchomel et al. (2012a); Tomiyasu and Kagomiya (2004); Klemme and van Miltenburg (2002); Suchomel et al. (2012b). Recently another previously unreported feature at K has been identified using magnetocapacitance measurements Sparks et al. (2014). This has been suggested to be another coupled magneto-structural change where completion of ferrimagnetic ordering and a spin-driven structural distortion occurs. Thus NiCr2O4 has been shown to be an avenue to study effects of strong coupling between the spin and lattice degrees of freedom.
The magnetocaloric effect (MCE) has been recently proposed to be a sensitive measurement to study magnetoelastic systems where the magnetic and lattice degrees of freedom are strongly coupled Franco et al. (2012); Ranke et al. (2005). NiCr2O4 therefore appears to be an ideal material for a magnetocaloric study to explore whether the various magneto-structural transitions give measurable response in MCE. Here we present a detailed study of the temperature and magnetic field dependence of the magnetization and the derived magnetocaloric response on polycrystalline samples of NiCr2O4. The curves show anomalies at K and K suggesting these transitions have a magnetic component to them. An Arrott plot is used to get insight into the nature of these transitions. The magneto caloric effect (MCE = ) shows clear positive anomalies at K and K as well as at K thus confirming that some magneto-structural change occurs at K. In addition to these anomalies, we observe a prominent negative anomaly in (inverse MCE) at K pointing to an as yet undiscovered phase change in NiCr2O4. Thus the magnetocaloric effect indeed seems to be a sensitive probe to detect magneto-structural changes in materials.
II Experiment
The polycrystalline samples of NiCr2O4 were prepared by conventional solid state reaction as reported previously Sparks et al. (2014). Stoichiometric amounts of NiO ( Alfa Aesar) and Cr2O Alfa Aesar) were mixed in an agate mortar and pestle for approximately hour. This mixture was pelletized and sintered at °C for hours in air. The resulting pellets were reground, mixed, re-pelletized, and annealed at °C for hours. This step was repeated twice. The X-ray powder diffraction data were collected at room temperature and analyzed using GSAS software Toby (2001). The magnetic measurements were performed using a physical property measurement system from Quantum Design in the temperature range and in magnetic fields in the range T.
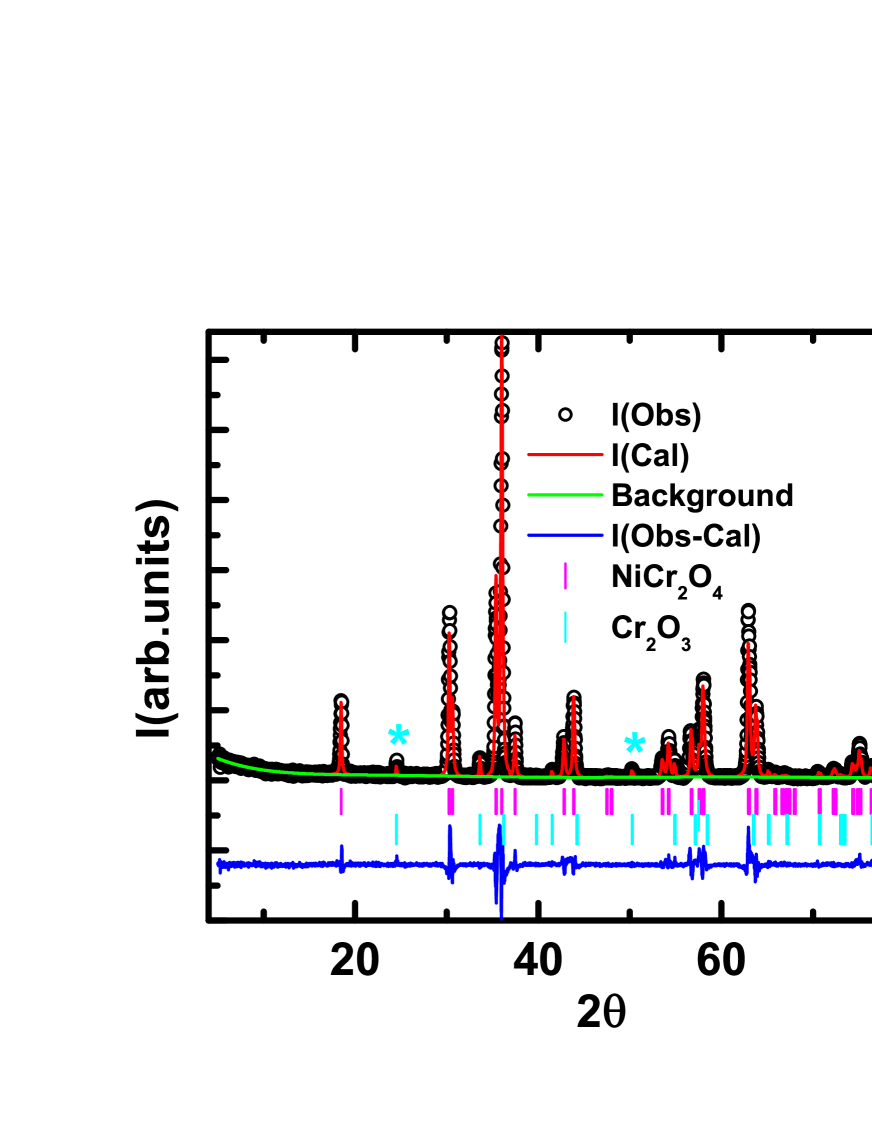
Figure 1 shows the powder X-ray diffraction (PXRD) pattern of the synthesized NiCr2O4 material. The Bragg peaks in this pattern indicate that NiCr2O4 crystallizes in the expected tetragonal space-group consistent with previous literature Suchomel et al. (2012a). X-ray diffraction data shows presence of a small amount () of Cr2O3 impurity phase. A Rietveld refinement of the PXRD data was done. The results of the fit, shown in Fig. 1, gave lattice parameters close to those previously reported for NiCr2O4 Suchomel et al. (2012a).
III Results and Discussion
III.1 Temperature and field dependent magnetization
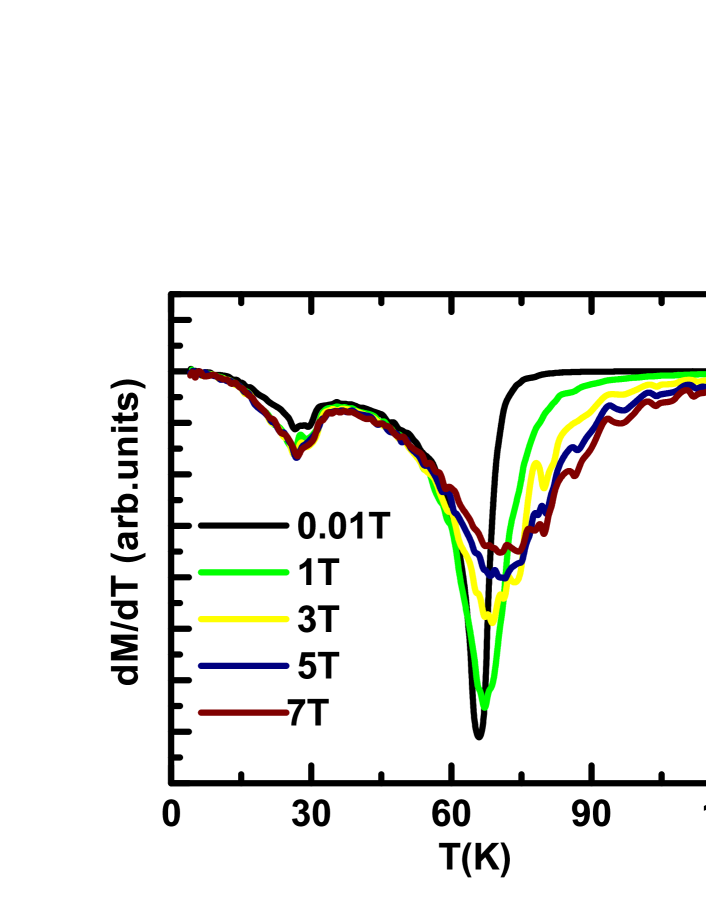
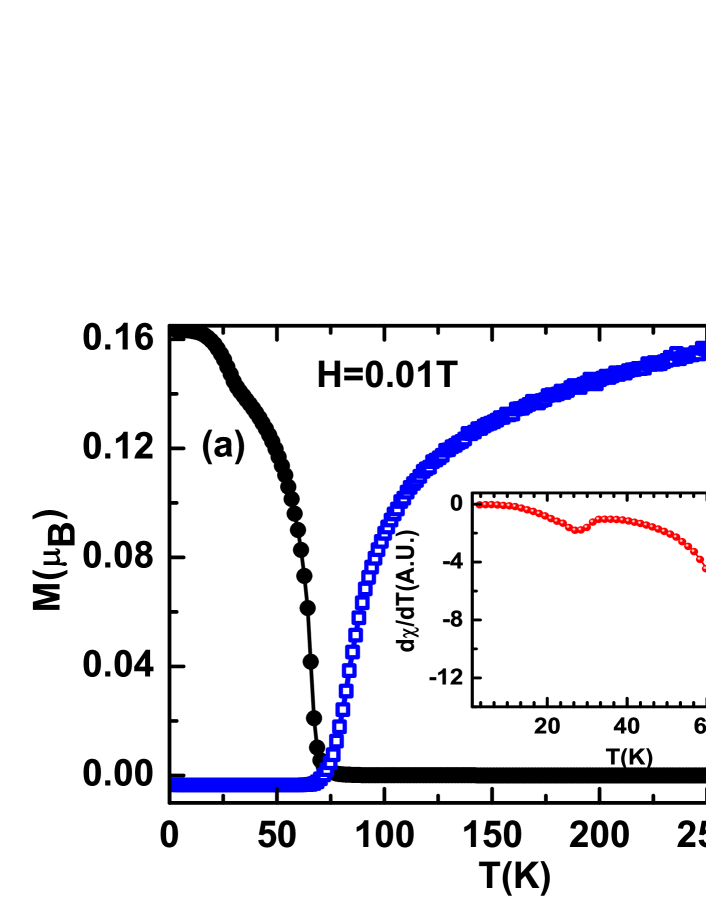
Figure 2 shows vs (on the left -panel) and inverse susceptibility, (on right -panel) measured in a magnetic field T. The shows a sharp increase to very large values on cooling below K indicating a transition to a ferromagnetic or ferrimagnetic phase. Below K the magnetization shows another anomaly where the magnetization decreases suggesting the onset of a further transition, possibly antiferomagnetic in nature. These two anomalies are more clearly visible in the plot shown in the inset of Fig. 2. The follows a linear dependence at high temperatures but shows a deviation from linear behavior as is approached from above. Near , this nonlinearity in becomes hyperbolic in nature. A fit above K to the expresion , where is the Curie constant and is the Weiss temperature, gave the values cm3/mole K and K. The large and negative implies predominantly antiferromagnetic exchange among magnetic ions. NiCr2O4 is thus a geometrically frustrated magnet with a frustration index .
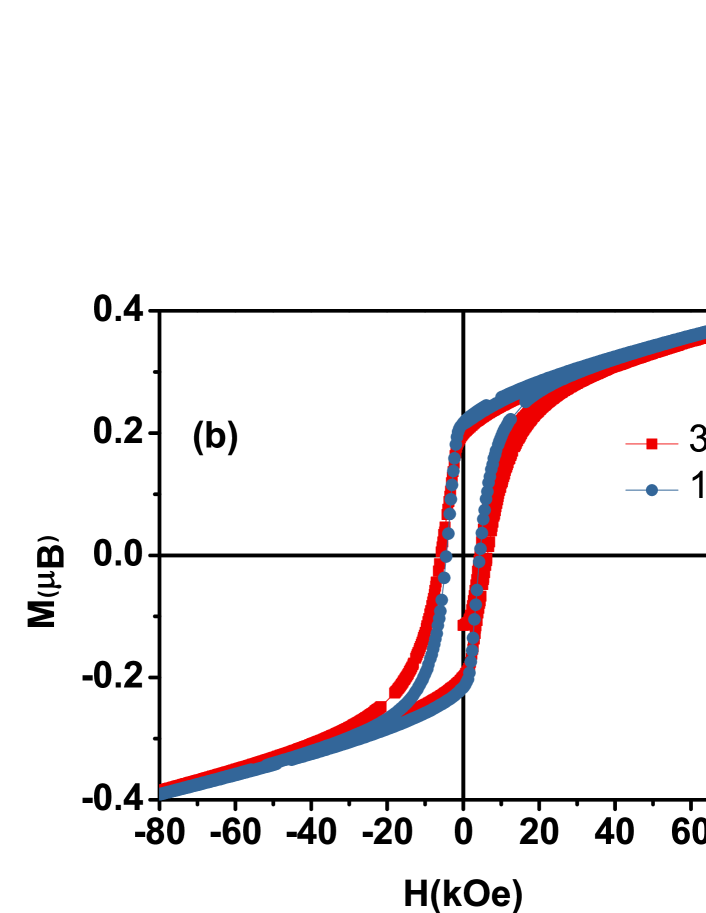
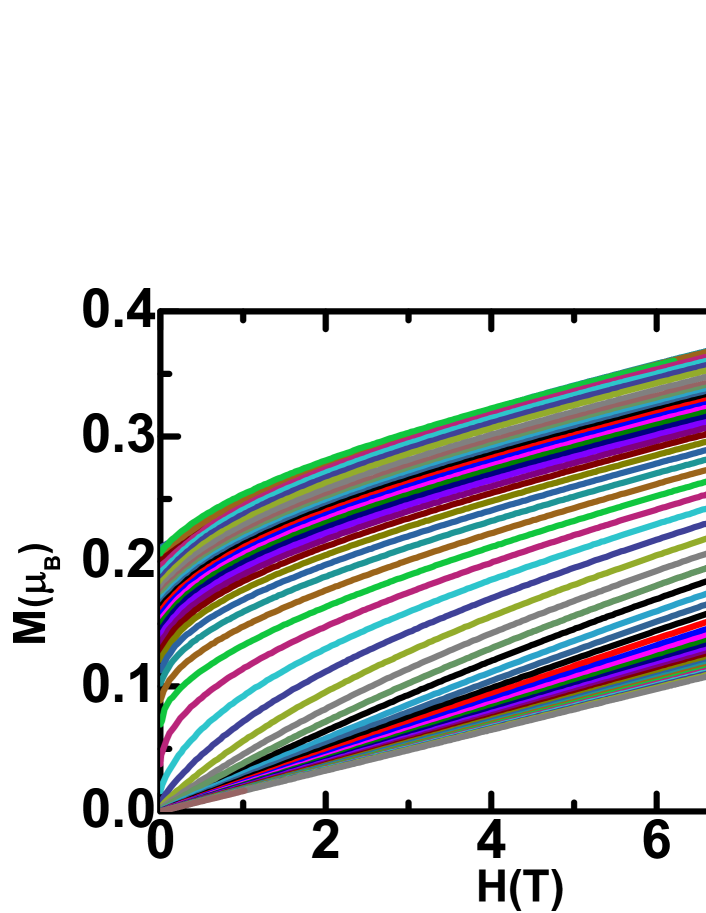
Figure 2 shows the field dependent isothermal magnetization data at temperatures and K inside the magnetically ordered state. A rapid increase in upto T followed by a much weaker, almost linear increase for larger is observed. Additionally, there is a hysteresis between the data measured in increasing and decreasing . The value of at the highest fields is much smaller than expected for completely polarized NiCr2O4. The above results i.e. , , hyperbolic behavior of Ishibashi and Yasumi (2007) when , and the behaviour is typical of a paramagnetic to ferrimagnetic transition Smart (1955). The above results including the two phase transitions are consistent with previous reports on this material Sparks et al. (2014); Ishibashi and Yasumi (2007); Suchomel et al. (2012b); Devi Chandrasekhar et al. (2016).
To get further insight into the various observed anomalies, we look in more detail at the temperature derivative of magnetization at various magnetic fields as shown in Fig. 3. The anomaly in near shows a stronger dependence on magnetic field. The position of the anomaly moves up in temperature and its gets broadened in larger fields. This strong field dependence strongly indicates a magnetic origin for the transition at . On the other hand, the position of the anomaly at K is almost independent of magnetic field and it becomes slightly sharper in larger fields. This weak field dependence suggests a mostly structural origin for the transition at .
III.2 Magnetocaloric effect
The MCE is given by the negative of the magnetic entropy change and can be derived from the isothermal magnetization at various and using the expression Franco et al. (2012),
| (1) |
If magnetization data is available only at discrete values of temperature, as is mostly the case in experiments, the integral in the above expression is replaced by a summation.
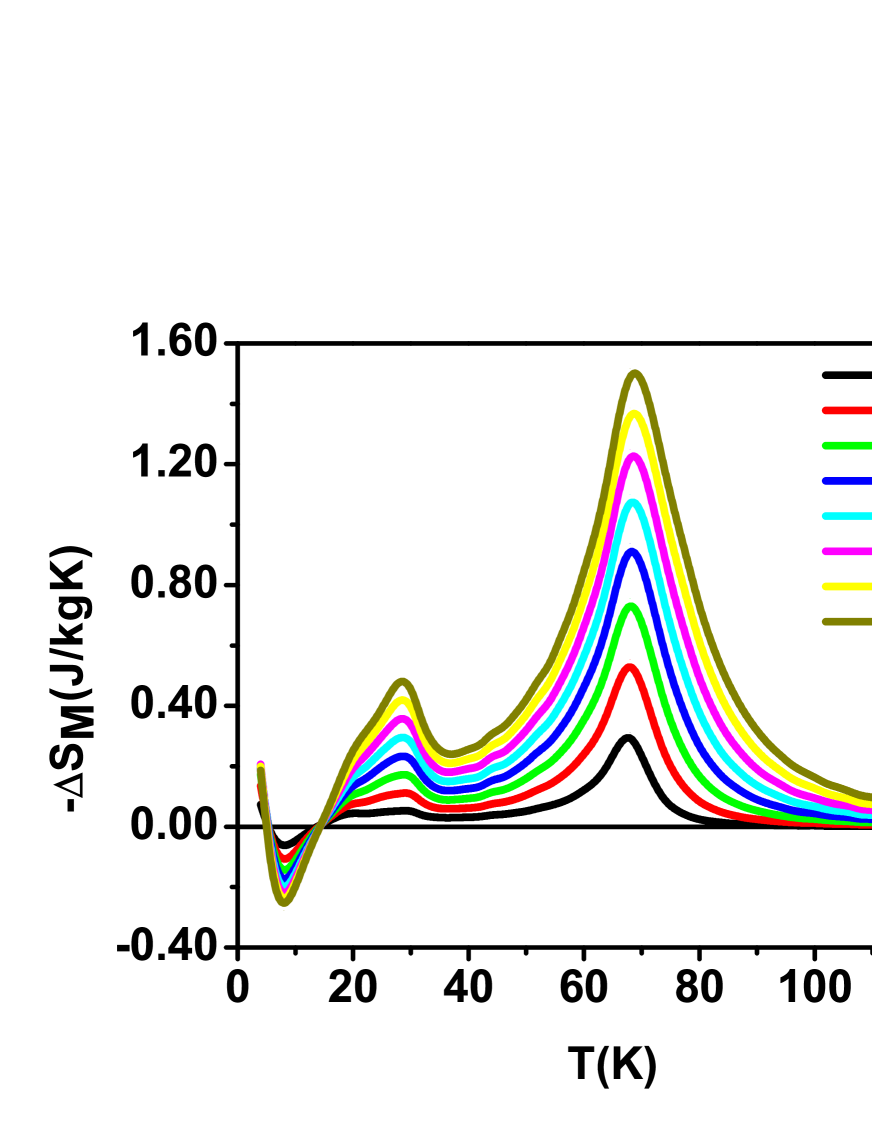
The closely spaced (every K) isothermal magnetization data measured for NiCr2O4 are shown in Fig. 4 and the temperature dependent derived from these data is shown in Fig. 5. The exhibits positive anomalies at K and K corresponding to the anomalies observed in the magnetic measurements above. Another positive anomaly seen as a weak shoulder at K is also observed. This temperature is consistent with the recently reported anomaly in magnetocapacitance measurements Sparks et al. (2014) and confirms that some magneto-structural change occurs at K. Additionally a negative anomaly (inverse MCE) is observed at K. This lower temperature anomaly hasn’t been reported before and suggests additional magnetic or structural ordering or re-ordering of some kind.
The transition at K is reported to be a magneto-structural one. In general, magnetostructural transitions are of first order transition in nature. For a first order transition the order parameter emerges in a discontinuous manner due to which a large change in entropy is expected. The anomaly in at is however, quite smooth with a moderate value of (J/kg-K) at T and is symmetric around the . This suggests that the transition at may be of second order. The positive anomalies in MCE at and indicates decrease of magnetic entropy on the application of magnetic field. This is expected due to spin re-orientation in a field. The weak shoulder at K also shows a magnetic field dependence which would be consistent with a magnetic transition.
III.3 Landau free energy and Arrott plot
For magnetic phase transitions, the order parameter is the magnetization or sub-lattice magnetization if there are more than one sub-lattices. The Landau free energy for a material like NiCr2O4 with different sub-lattice magnetizations and which are coupled, can be written as:
| (2) |
This expression is constructed by assuming ferromagnetic intra-sublattice interaction and antiferromagnetic inter-sublattice interaction. The antiferromagnetic exchange between sublattices is taken into account by introducing the term in equation 2 with . As usual, the parameters , and are taken as temperature independent constants while and are temperature dependent coefficients given by
| (3) | |||
| (4) |
To get solutions for ground state values of and we need to do a minimization of the free energy as and vary i.e. we need to set , which gives us:
| (5) | |||
| (6) |
We see that the coupling term in the free energy leads to terms in Eqns. 5 and 6 that act as effective magnetic fields. For example, the magnetization of the second sublattice acts as an effective field for the first sublattice as can be seen in Eqn. 5. The above expressions also indicate that and will be non-linear functions of . This will in turn lead to a non-linear Arrott plot ( vs ) for the total magnetization .
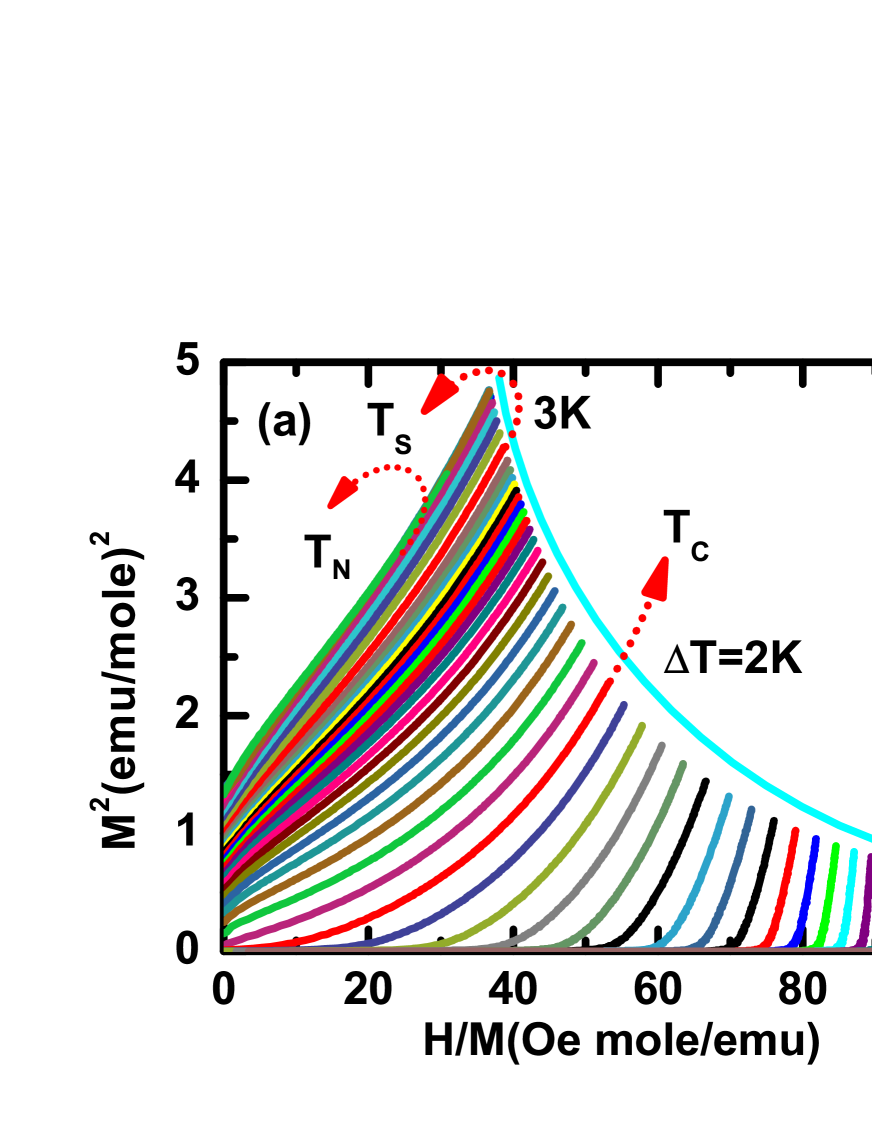
The Arrott plot for NiCr2O4 obtained from the isothermal magnetization data in Fig. 4 is shown in Fig. 6 (a). The Arrott plot curves for different temperatures are non-linear and their curvature changes as the system is cooled across the various phase transitions. In the paramagnetic state, the curves are strongly concave, very different from the curves obtained for simple feromagnets which are linear. Strong curvature in the Arrott curves for suggests strong antiferomagnetic coupling between the two (Cr3+ and Ni2+) sublattices. The temperature for which the nonlinear Arrott curve passes the origin, is identified with the ferrimagnetic transition temperature . It can be seen from Fig. 6 (a) that this happens for the curve at K which is consistent with anomalies in other measurements reported above.
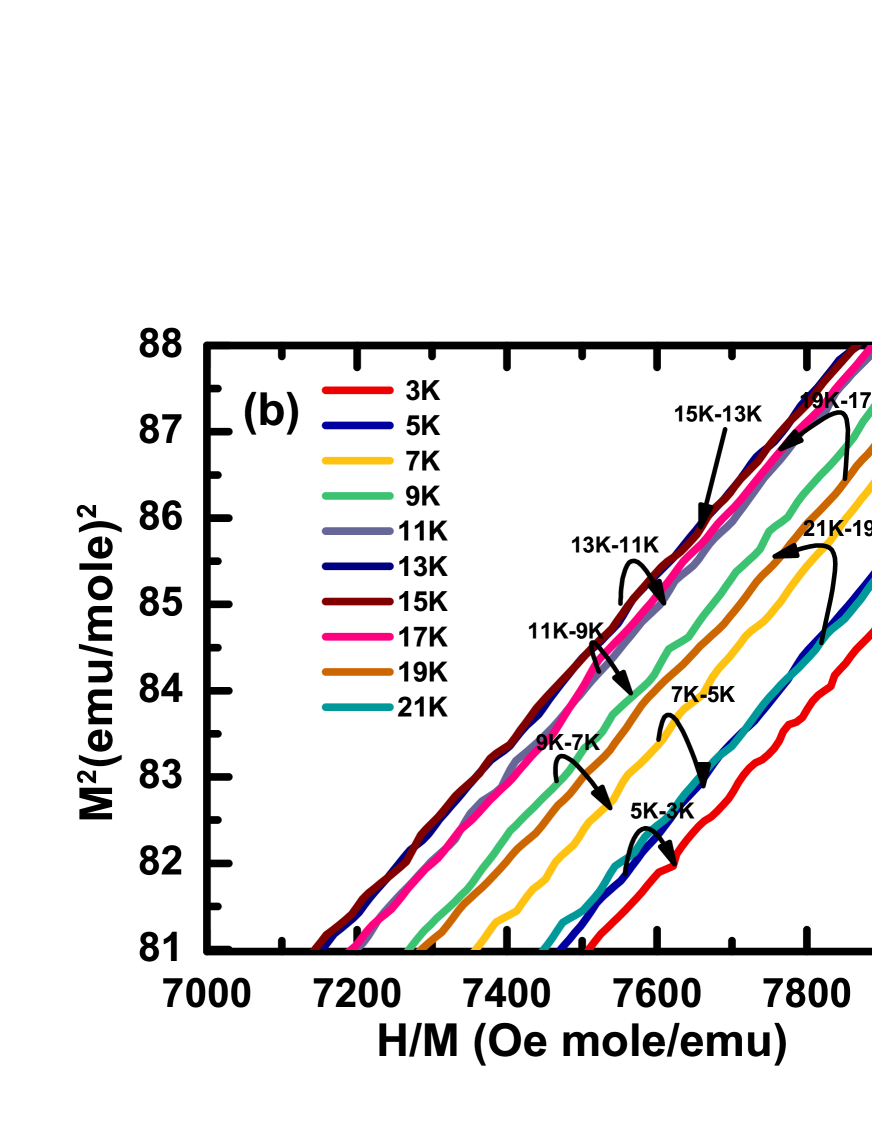
As the temperature is lowered below the concaveness of the Arrott curves reduces and eventually disappears and the curves show almost linear dependence for large . As we cross K the Arrott curves do not show any significant change. This again suggests that the transition at is not magnetic in origin. As the temperature is lowered further, something unusual happens. The Arrott plots for temperature K are shown in Fig. 6 (b) on an expanded scale. We see that the Arrott curves, for temperatures down to K are all moving up roughly by uniform amounts. This can be seen from the Fig. 6 (b) for the plots going from K to K and going from K to K, which are shown as arrows. Below K, the rate at which the curves for different temperatures are moving up slows down and we se that the curve for K is quite close to the K curve. The K curve almost overlaps with the K curve and for temperatures lower than this, the curves reverse their progression and start moving down as is lowered below K. The rate at which the curves move down is increased at K as can be seen from the change in the plots in going from K to K and K to K and so on. This reversal in Arrott curves indicates that a new magnetic phase possibly of antiferromagnetic nature exists below K von Ranke et al. (2009). This temperature is close to K where the inverse MCE was observed.
III.4 Scaling analysis

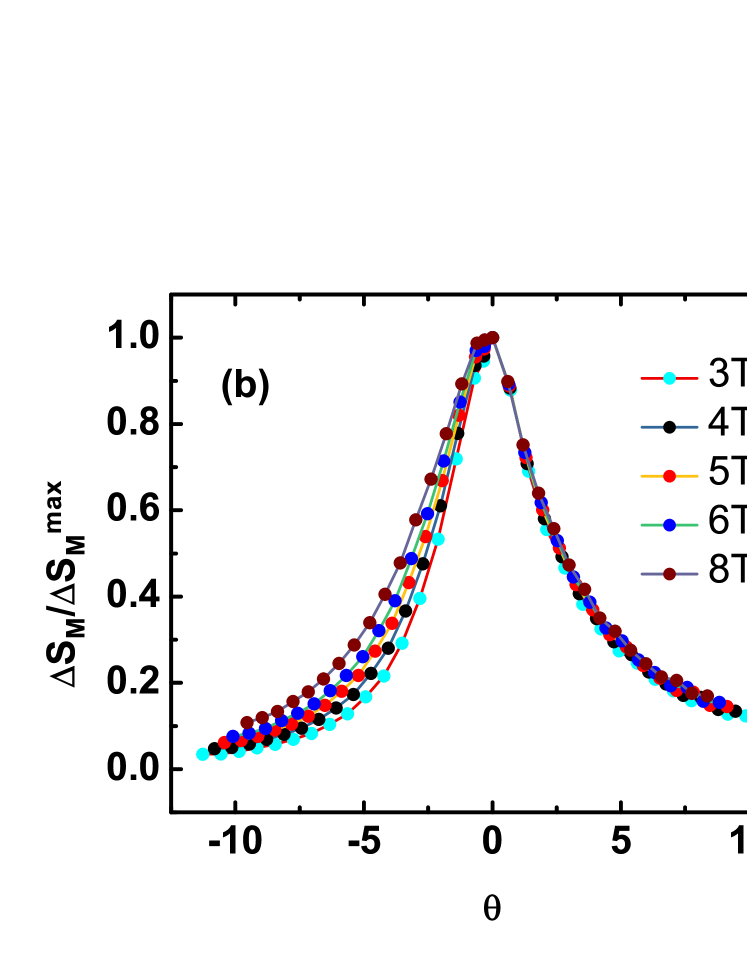
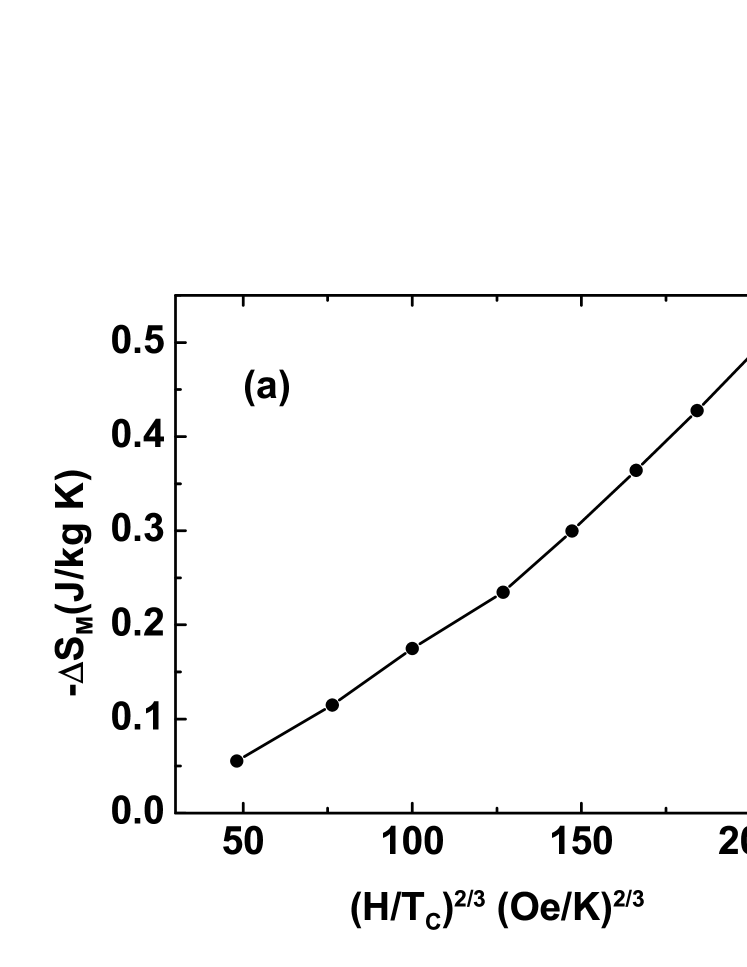
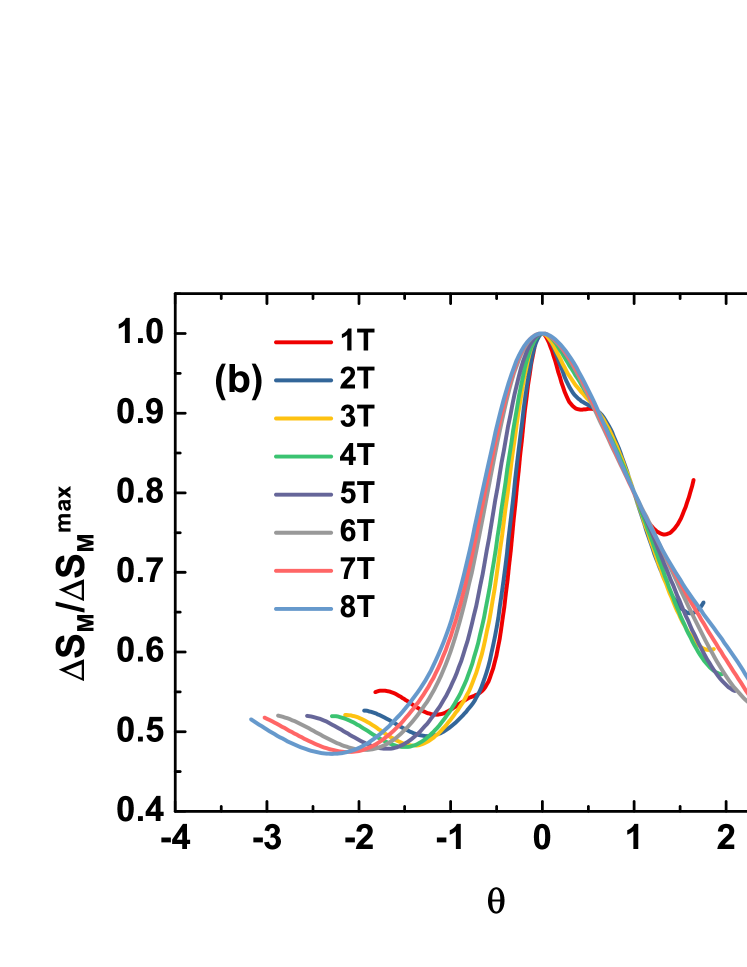

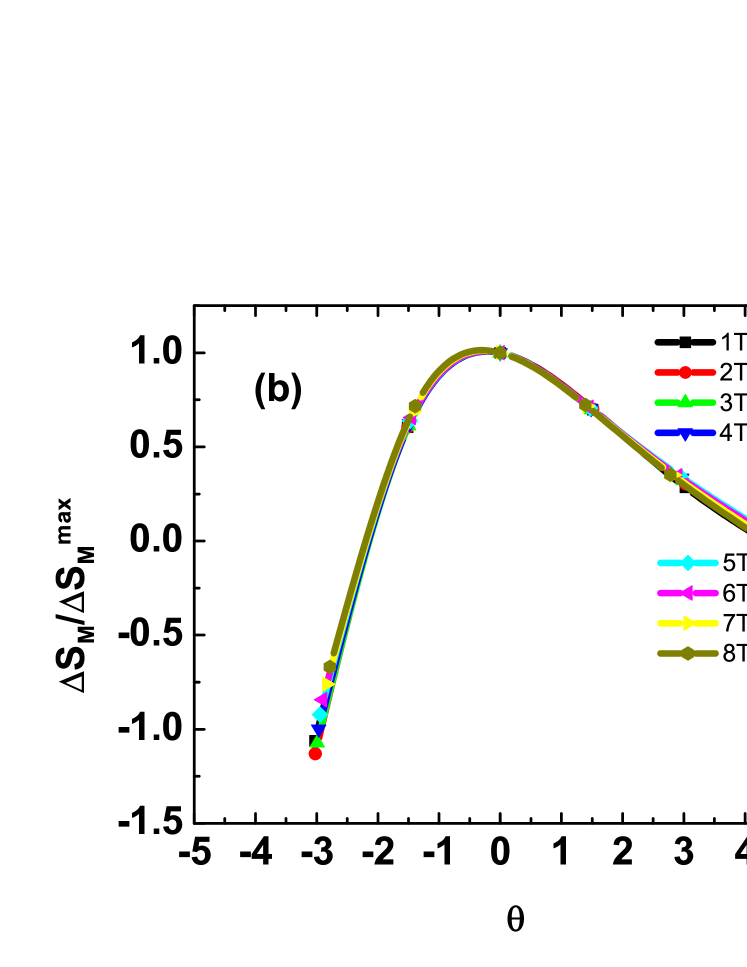
Within mean field theory the magnetic entropy change at the transition is expected to follow a power law behaviour given by with Franco et al. (2012). Additionally, close to a second order phase transition the curves at different magnetic fields are expected to collapse onto a common universal curve when they are plotted as versus , where is the value of at the transition temperature around which the scaling analysis is being made, and is a reduced temperature given by for and for . The and are the temperatures at the full width at half maximum of the anomaly in Franco et al. (2012). We have performed the above scaling analysis for the anomalies observed at K, K, and at K in the data shown in Fig. 5.
For the ferrimagnetic transition at K, the plot of versus is shown in Fig. 7 (a). A linear plot is obtained which strongly suggests that this transition is mean-field like. A plot of at various fields versus the reduced parameter is shown in Fig. 7 (b). We see that all the curves for the different magnetic fields approximately collapse onto a single universal master curve. This is strong evidence of the second order nature of the ferrimagnetic transition at K in NiCr2O4.
For the structural transition at K, the versus shown in Fig. 8 (a) is non-linear indicating a non-mean-field like transition. A plot of versus shown in Fig. 8 (b) is less conclusive. It seems that the curves at different fields do collapse somewhat to a single curve for . However, for there is clear separation of the curves at different magnetic fields suggesting no collapse. We therefore conclude from this overall non-universal scaling to mean that the transition at K is not a second order transition.
Finally, for the K inverse MCE anomaly, the versus shown in Fig. 9 (a) is clearly non-linear indicating a non-mean-field like transition. A plot of versus is shown in Fig. 9 (b). We see that all the curves for the different magnetic fields beautifully collapse onto a single universal curve. This is strong evidence that the new transition at K suggested from the strong inverse MCE, might be second order in nature. We note that while the universal MCE curve usually has a Lorentzian shape Franco et al. (2012), also seen for the and K transitions, the universal curve for the K transition is non-Lorentzian.
IV Conclusion
The spinel NiCr2O4 is a magneto-elastic material where the lattice degree of freedom is strongly coupled with spin and orbital degrees of freedom. This coupling drives several temperature dependent phase transitions which are magnetic or magneto-structural in nature.
In this work we study the magnetocaloric (MCE) response of NiCr2O4 as the temperature is varied across the various magnetic, structural or coupled magneto-structural transitions. The MCE shows three positive anomalies at K, K, and K. The first two anomalies have been well characterized in literature while the third one has been reported only in one previous work. Our work therefore confirms that some phase change occurs below K. Additionally, the MCE shows a negative anomaly at K. This robust inverse MCE anomaly points to a hitherto unreported transition which is most likely magnetic in nature. Future microscopic probe studies will be required to clarify the origin of this possible new phase transition in NiCr2O4. A scaling analysis of the data near the various critical temperatures reveals that the transition at is a second-order Mean field like transition, the transition at is not second order and is non-mean field like, while the newly discovered transition at K is non-mean field like but is second order in nature.
V Acknowledgment
We thank the X-ray facility at IISER Mohali. AA thanks MHRD for financial support.
References
- Jin fan et al. (2006) H. Jin fan, M. Knez, R. Scholz, K. Nielsch, E. Pippel, D. Hesse, M. Zacharias, and U. Gösele, Nature Materials 5, 627 EP (2006).
- Franco et al. (2012) V. Franco, J. Blázquez, B. Ingale, and A. Conde, Annual Review of Materials Research 42, 305 (2012).
- Mufti et al. (2010) N. Mufti, A. A. Nugroho, G. R. Blake, and T. T. M. Palstra, Journal of Physics: Condensed Matter 22, 075902 (2010).
- Lee et al. (2008) S. Lee, A. Pirogov, M. Kang, K.-H. Jang, M. Yonemura, T. Kamiyama, S.-W. Cheong, F. Gozzo, N. Shin, H. Kimura, Y. Noda, and J.-G. Park, Nature 451, 805 EP (2008).
- Lapine et al. (2011) M. Lapine, I. V. Shadrivov, D. A. Powell, and Y. S. Kivshar, Nature Materials 11, 30 EP (2011).
- Eerenstein et al. (2006) W. Eerenstein, N. D. Mathur, and J. F. Scott, Nature 442, 759 EP (2006).
- Bibes and Barthélémy (2008) M. Bibes and A. Barthélémy, Nature Materials 7, 425 EP (2008).
- Cheong and Mostovoy (2007) S.-W. Cheong and M. Mostovoy, Nature Materials 6, 13 EP (2007).
- Ramesh and Spaldin (2007) R. Ramesh and N. A. Spaldin, Nature Materials 6, 21 EP (2007).
- Kimura et al. (2003) T. Kimura, T. Goto, H. Shintani, K. Ishizaka, T. Arima, and Y. Tokura, Nature 426, 55 EP (2003).
- Fiebig et al. (2016) M. Fiebig, T. Lottermoser, D. Meier, and M. Trassin, Nature Reviews Materials 1, 16046 EP (2016).
- Ramirez et al. (1997) A. P. Ramirez, R. J. Cava, and J. Krajewski, Nature 386, 156 EP (1997).
- Lee et al. (2002) S.-H. Lee, C. Broholm, W. Ratcliff, G. Gasparovic, Q. Huang, T. H. Kim, and S.-W. Cheong, Nature 418, 856 EP (2002).
- Radaelli et al. (2002) P. G. Radaelli, Y. Horibe, M. J. Gutmann, H. Ishibashi, C. H. Chen, R. M. Ibberson, Y. Koyama, Y.-S. Hor, V. Kiryukhin, and S.-W. Cheong, Nature 416, 155 EP (2002).
- Bragg (1915) W. H. Bragg, Nature 95, 561 EP (1915).
- Ueno et al. (1999) G. Ueno, S. Sato, and Y. Kino, Acta Crystallographica Section C 55, 1963 (1999).
- Chaumont and Burgard (1979) C. Chaumont and M. Burgard, Journal of Chemical Education 56, 693 (1979).
- Crottaz et al. (1997) O. Crottaz, F. Kubel, and H. Schmid, J. Mater. Chem. 7, 143 (1997).
- Sparks et al. (2014) T. D. Sparks, M. C. Kemei, P. T. Barton, R. Seshadri, E.-D. Mun, and V. S. Zapf, Phys. Rev. B 89, 024405 (2014).
- Dunitz and Orgel (1957) J. Dunitz and L. Orgel, Journal of Physics and Chemistry of Solids 3, 20 (1957).
- Kocsis et al. (2013) V. Kocsis, S. Bordács, D. Varjas, K. Penc, A. Abouelsayed, C. A. Kuntscher, K. Ohgushi, Y. Tokura, and I. Kézsmárki, Phys. Rev. B 87, 064416 (2013).
- Suchomel et al. (2012a) M. R. Suchomel, D. P. Shoemaker, L. Ribaud, M. C. Kemei, and R. Seshadri, Phys. Rev. B 86, 054406 (2012a).
- Ishibashi and Yasumi (2007) H. Ishibashi and T. Yasumi, Journal of Magnetism and Magnetic Materials 310, e610 (2007).
- Tomiyasu and Kagomiya (2004) K. Tomiyasu and I. Kagomiya, Journal of the Physical Society of Japan 73, 2539 (2004).
- Klemme and van Miltenburg (2002) S. Klemme and J. C. van Miltenburg, Physics and Chemistry of Minerals 29, 663 (2002).
- Suchomel et al. (2012b) M. R. Suchomel, D. P. Shoemaker, L. Ribaud, M. C. Kemei, and R. Seshadri, Phys. Rev. B 86, 054406 (2012b).
- Toby (2001) B. H. Toby, Journal of Applied Crystallography 34, 210 (2001).
- Smart (1955) J. S. Smart, American Journal of Physics 23, 356 (1955), https://doi.org/10.1119/1.1934006 .
- Devi Chandrasekhar et al. (2016) K. Devi Chandrasekhar, J. Krishna Murthy, J.-Y. Lin, H. C. Wu, W. J. Tseng, A. Venimadhav, and H. D. Yang, Phys. Rev. B 94, 205143 (2016).
- Ranke et al. (2005) P. J. v. Ranke, N. A. de Oliveira, C. Mello, A. M. G. Carvalho, and S. Gama, Phys. Rev. B 71, 054410 (2005).
- Creutz et al. (1979) M. Creutz, L. Jacobs, and C. Rebbi, Phys. Rev. D 20, 1915 (1979).
- Houari et al. (1997) B. E. Houari, M. Benhamou, M. E. Hafidi, and G. Chouteau, Journal of Magnetism and Magnetic Materials 166, 97 (1997).
- von Ranke et al. (2009) P. J. von Ranke, N. A. de Oliveira, B. P. Alho, E. J. R. Plaza, V. S. R. de Sousa, L. Caron, and M. S. Reis, Journal of Physics: Condensed Matter 21, 056004 (2009).