]wilmer@bioinf.uni-leipzig.de
Forman-Ricci Curvature for Hypergraphs
Abstract
In contrast to graph-based models for complex networks, hypergraphs are more general structures going beyond binary relations of graphs. For graphs, statistics gauging different aspects of their structures have been devised and there is undergoing research for devising them for hypergraphs. Forman-Ricci curvature is a statistics for graphs, which is based on Riemannian geometry, and that stresses the relational character of vertices in a network through the analysis of edges rather than vertices. In spite of the different applications of this curvature, it has not yet been formulated for hypergraphs. Here we devise the Forman-Ricci curvature for directed and undirected hypergraphs, where the curvature for graphs is a particular case. We report its upper and lower bounds and the respective bounds for the graph case. The curvature quantifies the trade-off between hyperedge(arc) size and the degree of participation of hyperedge(arc) vertices in other hyperedges(arcs). We calculated the curvature for two large networks: Wikipedia vote network and Escherichia coli metabolic network. In the first case the curvature is ruled by hyperedge size, while in the second by hyperedge degree. We found that the number of users involved in Wikipedia elections goes hand-in-hand with the participation of experienced users. The curvature values of the metabolic network allowed detecting redundant and bottle neck reactions. It is found that ADP phosphorilation is the metabolic bottle neck reaction but that the reverse reaction is not that central for the metabolism.
pacs:
Valid PACS appear hereI Introduction
Hypergraphs are used to model systems whose objects have not only binary relationships; instead, interactions simultaneously involve multiple members Bretto ; Jost-MATCH . Examples of these systems are found in physics, biology, chemistry, computer science, combinatorial optimization, scientometrics and several other fields Klamt ; Gallo ; Bretto ; Barbosa2018 ; Michoel2012 ; Vazquez2008 ; Xiong2018 . Hypergraphs reduce to (ordinary) graphs when all relationships (hyperedges) are binary. Graphs have been widely used as a mathematical model for different systems and their mathematical properties have been extensively studied, which include devising statistics gauging aspects of their structures, such as vertex degree and its distributions, clustering coefficients, betweenness centrality and more recently Forman-Ricci curvature.
As hypergraphs are a generalization of graphs, several of the graph statistics have been extended to hypergraphs, e.g. vertex and hyperedge degrees, clustering coefficients Klamt ; Estrada and spectral properties Zhou . Most of the commonly used quantities focus on vertices. As the crucial structure of a graph is, however, given by the set of its edges rather than by its vertices, we should systematically define and evaluate quantities assigned to the edges rather than to the vertices. In this paper we develop the Forman-Ricci curvature for hypergraphs (directed and undirected) and calculate it for networks of different sizes and research fields.
II Forman-Ricci curvature of edges/arcs in graphs
Recently various notions of “curvature” have been proposed for graphs and other, more general, discrete structures and applied to detect various local or global properties of such structures 2017arXiv171207600S ; 2017arXiv170700180W ; 74177 ; 2017CSF10150S ; 2016arXiv160708654W ; 2016arXiv160807838W ; 2016arXiv160504662S ; 2016arXiv160406634W ; 2016JSMTE063206S ; Jost-MATCH . The name of “curvature” may seem somewhat strange in this context. In differential, and more abstractly, in Riemannian geometry, curvature has been found to encode and express local and global features of smooth manifolds equipped with metric tensors Bauer2017 . Those features themselves usually do not depend on an underlying smooth structure, and this has lead to abstract theories of generalized curvatures on metric spaces. On graphs, these generalized curvatures are particularly easy to define and to evaluate. They can also shed considerable light on other quantities that have been introduced in network analysis without such a clear conceptual background as those curvatures. The simplest among these generalized curvatures is the Ricci curvature introduced by Forman for simplicial complexes Forman2003 . As graphs are one-dimensional simplicial complexes, we can readily evaluate this curvature. As explained in detail in Section II.1, for an edge with vertices with degrees and (the degree of a vertex is the number of its neighbors, that is, of those other vertices that are directly connected to it by an edge), the Forman-Ricci curvature is simply . The number serves the purpose of normalization, to make the curvature of cycle graphs vanish. The minus signs are also conventional, to align this curvature with the Ricci curvature of Riemannian geometry. Thus, edges connecting vertices of large degree have very negative curvature values, and the first step in the analysis of an empirical network might consist in identifying the most negatively curved edges as the most important ones for the cohesion of the network or for the canalization and distribution of information or activity in the network.
Since the definition of the Forman-Ricci curvature of an edge in an undirected graph is so clear and simple, it can be readily generalized to, for instance, directed or weighted graphs, and also to structures in which more than two elements are related. Forman himself had introduced this curvature notion already for possibly weighted, simplicial complexes Forman2003 . A simplicial complex is characterized by the requirement that whenever a collection of elements stands in relation, then this also holds for any subcollection. This leads to mathematically very nice properties, and simplicial complexes are basic structures in algebraic topology, but for the modelling and analysis of empirical data sets, we may want to relax or perhaps even completely abandon that condition. That leads us to hypergraphs, which are collections of vertices (undirected hypergraphs) or collections endowed with direction (directed hypergraphs). Examples of the former are elections, where a subset of voters is an election an the collection of elections constitutes the hypergraph. Chemical reactions Klamt ; Stadler-chapter ; Fagerberg2018 and particle scatterings are instances of directed hypergraphs, where some starting materials are transformed into some products. For hypergraphs, in principle, various generalizations of the Forman-Ricci graph curvature are possible. It is a main contribution of this paper to identify that notion of Forman-Ricci curvature for (un)directed hypergraphs that is best adapted to their structure and to investigate its properties. We also apply this to concrete empirical hypernetworks, a social and a metabolic one.
In this section we briefly summarize the results of the Forman-Ricci curvature for graphs and then generalize the curvature for hypergraphs.
II.1 Undirected graphs
Let be a (multi)graph with vertex set and multiset of edges . The Forman-Ricci curvature of an edge , as introduced in 2017arXiv171207600S , is given by:
| (1) |
where denotes the weight of the edge , and are the weights of vertices and , respectively. The sums over run over all edges incident on the vertex excluding . The curvature for the unweighted multigraph, with vertex and edge weights set to 1, is given by Jost-MATCH
| (2) |
where is the vertex degree of . Defining we have
| (3) |
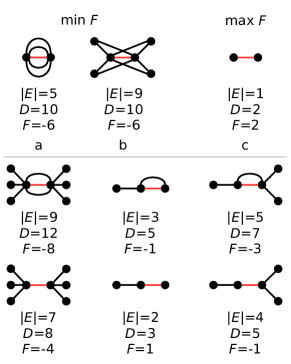
As a multigraph may have repeated edges, whose number is independent of the number of vertices, the bounds for shall be expressed as a function of the known number of edges, namely, . Therefore, . The lower bound is attained when for every , therefore (Figure 1a). In turn , for an isolated edge (Figure 1c). In contrast to the multigraph case, for simple unweighted graphs, the lower bound can be expressed as a function of the number of vertices: , which is obtained for for every , i.e., (Figure 1b). As for multigraphs, reaches its maximum value () for an isolated edge (Figure 1c).
As seen in Figure 1, Forman-Ricci curvature quantifies the degree of spread of the vertices in , from maximum spread (corresponding to ) to minimum spread (attained when ).
II.2 Directed graphs
Here we are interested in an unweighted directed multigraph , where is an arc (directed edge), and . Equation 2 indicates that the curvature of an edge depends on the degree of its vertices. As in a simple directed graph the degree can be split into in- and out-degree. The curvature of is defined in terms of in- and out-degrees as well 2016arXiv160504662S . There are different possibilities for the realization of the curvature, depending on the meaning one assigns to it. Here we emphasize the directed spread or flow through , i.e., following the direction of the arc. Therefore, we consider the incoming arcs on (in-degree of , ) and the outgoing arcs from (out-degree of , ). When we separate the curvature in (2) into the contribution of and of and also note that the edge counts for the degrees of and , but neither for the in-degree of nor for the out-degree of , then a curvature accounting for the in-flow at () and another for the out-flow at () is defined as
| (4) |
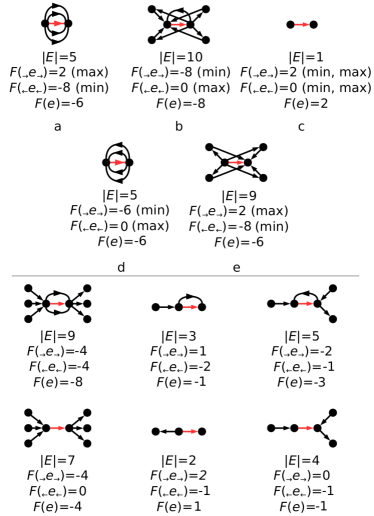
Both are bounded below by for , and bounded above by when (Figure 2a). For the simple directed graph the lower bound for both, in- and out-flow, is , for (Figure 2b). The upper bound is reached, in both cases, when (Figure 2c). The curvature accounting for the flow through is then given by
| (5) |
where for the multigraph case and in the simple graph case. Figure 2c shows the case where . Some further examples of calculations of curvatures are shown in Figure 2.
If the flow-loss along is to be considered, two additional curvatures are calculated that account for the flow loss at () and at (). Thus
| (6) |
both bounded below by , for , and bounded above by for (Figure 2d). For the simple directed graph we have and . Hence, the curvature for the flow-loss along is
| (7) |
where (Figures 2a-e) holds in the multigraph case and in the simple graph case. Some further examples are shown in Figure 2.
A curvature accounting for the total flow over is then computed as
| (8) |
In the following section we extend the Forman-Ricci curvature to hypergraphs.
III Forman-Ricci curvature of hyper(edges/arcs) in hypergraphs
Given a set of vertices , a graph is a collection of subsets (edges) of , all of which comprise only two elements. If we call the cardinality of each subset its size, then a graph is a collection of subsets of size two. In a hypergraph, the size of the subsets is no longer restricted, and subsets of any size are allowed.
III.1 Undirected hypergraphs
An undirected hypergraph consists of a set of vertices and a multiset of subsets of , called hyperedges, such that , i.e. , for . Some examples of hypergraphs are shown in Figure 3.
Separating the contributions of vertices and in Equation 1, it can be rewritten as:
| (9) |
furthermore,
| (10) |
Since Equation 10 no longer restricts to size two, we present it as the Forman-Ricci curvature of the hyperedge . For the unweighted hypergraph, where all vertex weights are equal to 1, this expression simplifies to
| (11) |
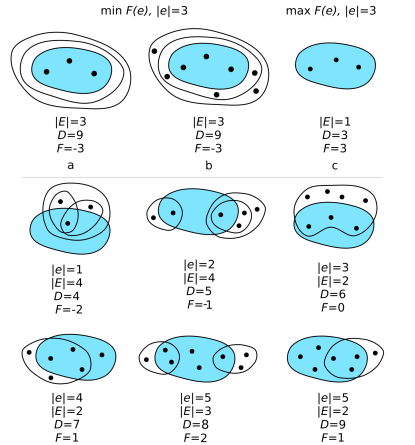
which is bounded below by when for every , and bounded above by when . In other words, the minimum curvature occurs when every vertex in belongs to each hyperedge (Figures 3a,b); the maximum is attained for an isolated hyperedge (Figure 3c).
For the particular case of simple hypergraphs, we therefore have the lower bound when for every , and the upper bound , when . Note that in hypergraphs , therefore the minimum value may reach , unlike graphs. In such a case, . Some further examples of curvature for hypergraphs are shown in Figure 3.
III.2 Directed hypergraphs
In a directed hypergraph, each hyperedge is composed of two subsets of vertices: the tail and the head of the hyperedge. Formally, we say that a directed hypergraph is the couple with a set of vertices and a multiset of hyperarcs. A hyperarc is a pair , where and are called its tail and its head, respectively. Figure 4 depicts some examples of diercted hypergraphs, where the sets and are highlighted.
Starting from the definitions of curvature for an arc in the directed graph case (Equation 4), we introduce the curvatures and for a hyperarc as
| (12) |
with bounds and . For the simple directed hypergraphs, we have and . With and at hand, we define the curvature for the flow through as:
| (13) |
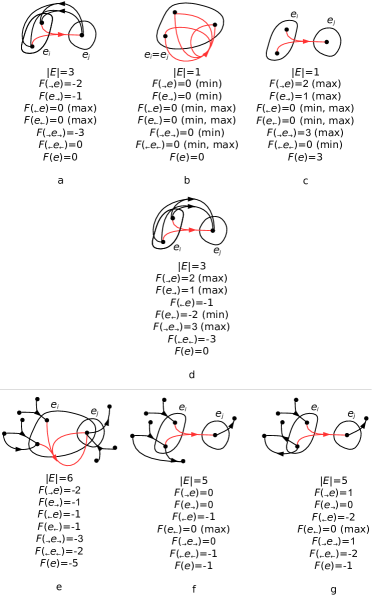
with bounds in the general case and for the simple directed hypergraph (Figure 4). Note that if is allowed to have its minimum value of 1, then and . Some examples of curvature values for directed hypergraphs are shown in Figure 4.
The respective flow-loss curvatures are:
| (14) |
with bounds and in the general case and and for the simple directed hypergraphs.
Equation 14 yields the flow-loss curvature
| (15) |
with bounds , which becomes for simple directed hypergraphs.
In the following section we calculate the Forman-Ricci curvature for different cases that can be modelled as hypergraphs. Several applications of the Forman-Ricci curvature for the graph case are found in references 2017arXiv171207600S ; 2017arXiv170700180W ; 74177 ; 2017CSF10150S ; 2016arXiv160708654W ; 2016arXiv160807838W ; 2016arXiv160504662S ; 2016arXiv160406634W ; 2016JSMTE063206S ; Jost-MATCH .
Applications to Empirical Networks
III.3 Wikipedia Voting Network
Wikipedia is an encyclopedia written by volunteers. A small part of these users are administrators, who besides being active, regular long-term Wikipedia contributors, have gained the general trust of the community and have taken on technical maintenance duties. A user becomes an administrator when a request for adminship is issued and the Wikipedia community via a public vote decides who to promote to administrator. Users can either submit their own requests for adminship or may be nominated by other users. Using the January 3 2008 dump of Wikipedia page edit history konect:2017:elec , Leskovec et al. konect:leskovec207 extracted 2,794 elections (hyperedges in our setting) and 7,066 users (vertices) participating in the elections (either casting a vote or being voted on). We calculated the curvature for the resulting undirected hypergraph.
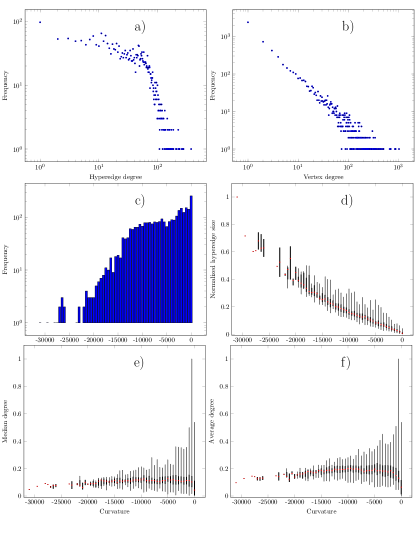
Figure 5 shows the distribution of hyperedge size and of vertex degree. The data show that many of the elections involve a single user, although elections with 2-20 users are also common. There are few elections with more than 100 users, the largest one including 370 users (Figure 5a). The participation in elections is heavy-tailed distributed (Figure 5b), with most of the users participating in a single election and very few taking part in about a thousand elections. The curvature values are mostly negative (Figure 5c), indicating (i) the absence of elections with unexperienced users (), i.e., all elections at least include a user that takes part in at least one other election; and (ii) for most elections the number of elections in which users take part is greater than their number of voting users ( in Equation 3). The minimum curvature value (-3,112) is far from the lower bound (, calculated with ). This reflects the fact that most users are experts in limited fields only.
To have some insight about the effects of hyperedge sizes and number of incident hyperedges on curvature, we analyzed their distributions over the span of curvature values (Figures 5d-f). Figure 5d shows that the more spread the election, i.e. involving users that vote in other elections, the larger the number of users voting. Figures 5e and f show that, in average, elections overlap with a low number of other elections (low number of incident elections). Thus, the curvature values are mainly ruled by hyperedge size rather than by incident hyperedges.
III.4 Metabolic Network of Escherichia coli
The metabolism of Escherichia coli is one of the most studied and best characterized among bacteria. Here we model the metabolism K-12 (iJR904 GSM/GPR) Reed2003 of this bacterium as a directed hypergraph whose vertices are the metabolites (chemical species). Each chemical reaction is represented as a hyperarc , whose educts (starting materials) correspond to and products to . There are metabolites and reactions accounting for 686 non-reversible and 245 reversible ones. These latter reactions, denoted by have been included as “forward” () and “backward” () reactions. All curvatures (Equations 12 to 15) and related calculations are gathered in the Supplementary Material.
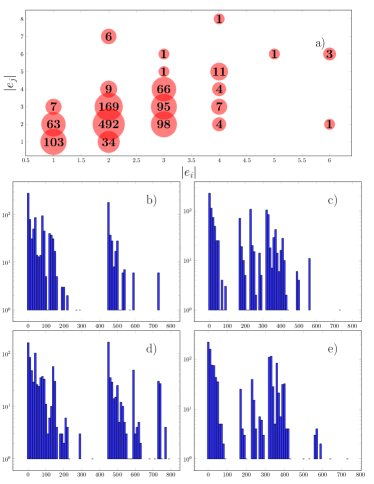
As expected for chemical reactions, typically there are not more than three educts and three products (Figure 6a). The curvature values therefore vary little in response to hyperarc size, but rather depend more on the degree of vertices in and . Note that these degrees result, respectively, from the summation over vertex degrees of educts and of products (Equations 12 to 15). The distribution and educts and products degrees is shown in Figure 6. The participation of educts and products in reactions does not yield a smooth distribution, as indicated by the gaps present in Figure 6b,c. The production of educts (Figure 6b) shows a large group of reactions whose educts are synthesized by less than 200 reactions and another group where they are obtained by more than 450 reactions. Likewise, there are two groups of reactions with different levels of use of their products (Figure 6c); one group has reactions whose products are used in less than 100 reactions and another with more than 300 reactions taking their products as starting materials.
The synthesis of products and the use of educts (Figures 6d and e), shows also a discontinuous participation of substrates in reactions. There are two groups of reactions according to the number of reactions synthesizing their products: one with reactions whose products are obtained by less than 200 reactions and another by more than 450 reactions (Figure 6d). Likewise, there are various groups of reactions according to the use of their educts, from some which are seldom used to some others with about 170, 230, and more than 330 uses (Figure 6e).
The extent to which the educts of the reaction are produced from other reactions is measured by . The more reactions lead to the educts of , the more negative becomes (Figure 7a). The theoretical bounds of , assuming are . However, more realistic bounds are , which results from taking the actual (Figure 6a). We found that , which is attained by four reactions, with four educts (all substrate abbreviations are included in the Appendix (Table 1)):
adp+h+malcoa+piaccoa+atp+hco3
adp+h+pi+25aicsasp_L+atp+5aizc
adp+dtbt+h+piatp+co2+dann
atp+gar+h+piatp+gly+pram
These reactions are those whose educts are the most synthesized of all the metabolic reactions of E. coli (63% of the reactions produce their educts). In three of them atp is synthesized from adp, which shows the well-known central metabolic role of atp Albert2000 ; Wagner1803 .
corresponds to a single reaction: cyan+tsulh+so3+tcynt, where only one of its two educts is a product of a single reaction: atp+h2o+tsuladp+h+pi+tsul.
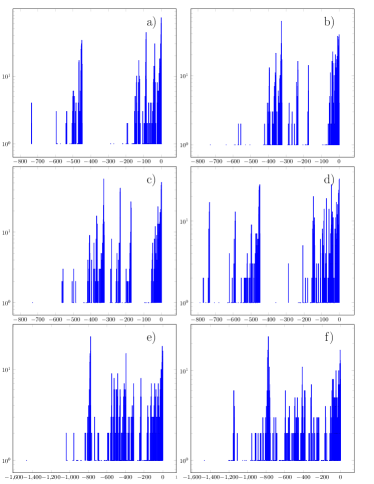
Figure 7a shows that the most frequent curvature value is 0 (for 73 reactions), i.e. 6% of the reactions have a trade-off between the number of educts and the number of reactions producing them; most of the remaining reactions have more ways to produce their educts than the number of educts. It is also found that there are almost no reactions with curvatures between -200 and -450, indicating that educts of reactions are mainly obtained either by less than 200 reactions (less than 17% of the reactions) or by 450 to 600 reactions (38 to 51% of the reactions). This is a consequence of the heavy-tailed in-degree distribution of substrates Albert2000 .
Figure 7b shows the curvature values , which quantify the extent to which products of reactions are used in further reactions as educts. By taking (Figure 6a) this curvature takes values . The actual , for adp+h+piatp+h+h2o, i.e., this is the reaction whose three products are most used in other reactions as starting materials (used in 62% of the reactions). In contrast, there are four reactions with :
agpe_EC + pg_EC apg_EC+g3pe
agpc_EC + pg_EC apg_EC+g3pc
agpg_EC + pg_EC apg_EC+g3pg
udpgal udpgalfur
Hence, for those three reactions with two products, these substrates are only used in a further reaction as educts, while udpgalfur is not further used, i.e. it is a metabolic “dead-end” Reed2003 . As most of the reactions (96%) have negative values of , this indicates the efficient use of reaction products Wagner1803 , which can be divided into two regimes. For about half of the reactions their products are used in no more than 9% of the reactions and about 40% of the reactions have products that are used in more than a quarter of the reactions. This is a consequence of the heavy-tailed distribution, this time, of the out-degrees of the substrates Albert2000 .
showed that for most of the reactions their educts are produced by other reactions and that the products are used in several other reactions. The question that arises whether those popular educts are connected through reactions with the popular products is positively answered by , which takes negative values for most of the reactions. The corresponds to adp+h+piatp+h+h2o. Hence, this is the reaction whose educts are most synthesized by other reactions and whose products are the most used as educts in other reactions. It is the bottleneck of the E. coli metabolism. Other reactions of this sort, with (Figure 7e), are:
adp+h+piatp+h+h2o
h+o2+q8h2h+h2o+q8
h+o2+q8h2h+h2o+q8
h+no3+q8h2h+h2o+no2+q8
h+mql8+no3h+h2o+mqn8+no2
Having analyzed the metabolism following the direction of educts to products in reactions, we now proceed to study the curvature in the backward direction, which quantifies to which extent a reaction is just one of the many connecting popular educts with popular products. We start by analyzing that shows to which extent educts of a reaction participate in other reactions. The theoretical bounds are and we found that takes values in between -729 and 0; the minimum is attained by atp+h+h2oadp+h+pi, indicating that atp in an acidic aqueous medium is the most often used starting material. occurs for 51 reactions, whose involved 56 educts are only used in those 51 reactions, i.e. they are very specialized educts for very particular metabolic reactions. The distribution of values shows that for half of the reactions, their educts participate in less than 9% of the reactions, while for the rest, their educts take part in more than 15% of the reactions.
shows to which extent products of a reaction are synthesized by other reactions. The theoretical bounds are given by , leading to . The actual values range from -788 to 0. The minimum is reached by reaction: dxyl5p+nad+phthrco2+h+h2o+nadh+pdx5p+pi, i.e. this set of products is the most synthesized by E. coli metabolism, which is expected, for the likelihood of a set of substances to be synthesized scales with the size of the set. This reaction with six products is one of the few where more than the frequent one to four products are synthesized (Figure 6a). Moreover, among the products, co2, h, h2o, nadh, and pi are often products of other reactions.
is attained by 29 reactions, all of them leading to a single product, except for three reactions, each one with two products. Thus, those 32 products are of little synthetic relevance for the metabolism. The distribution of curvature values shows that there are three kinds of reactions whose products are synthesized by different number of reactions. For 60% of the reactions their products are synthesized by less than 200 reactions (17% of the reactions) and for the rest of the reactions by more than 450 reactions (38% of the reactions).
Curvatures and showed that half of the educts are often used and 40% of the products are often synthesized, which indicates that it is very likely to find alternative ways to link educts with products of existing reactions, as found in Albert2000 ; Barabasi509 ; Wagner1803 . A measure of this degree of redundancy of a reaction or of its replaceability is given by , which indicates to which extent a reaction connects popular educts with popular products. The more negative the curvature, the more redundant or likely replaceable the reaction is.
By analyzing distribution (Figure 7f) it is seen an ample spectrum of curvatures, with almost no gaps, indicating different degrees of redundancy for the metabolic reactions. corresponds to the hydrolysis of ATP, i.e., atp+h+h2oadp+h+pi, indicating, e.g., that the dephosphorilation of atp to adp can be achieved by many other reactions (12% of the reactions). occurs for the following eight reactions, which are unique as they are the only way to connect their educts with their products:
mmcoa_Rmmcoa_S
5mdr1p5mdru1p
gdpddmangdpofuc
adphep_D,Dadphep_L,D
dhnptgcald+6hmhpt
glu1sa5aop
prfpprlp
pran2cpr5p
Conclusions and Outlook
The Forman-Ricci curvature emphasizes the importance of the relational character of (hyper)edges, thereby providing a view of the network structure that complements traditional vertex-centered descriptors. It also embeds the characterization in a formal mathematical theory, namely Riemannian geometry.
The results here reported include a brief review of Forman-Ricci curvature for (un)directed graphs and generalize the curvature to both undirected and directed hypergraphs. Graph curvatures used in previous studies thus become particular cases of the curvature for hypergraphs 2017arXiv171207600S ; 2017arXiv170700180W ; 74177 ; 2017CSF10150S ; 2016arXiv160708654W ; 2016arXiv160807838W ; 2016arXiv160504662S ; 2016arXiv160406634W ; 2016JSMTE063206S ; Jost-MATCH . We determined the upper and lower bounds for Forman-Ricci curvature for graphs and hypergraphs, which so far had not been studied.
The curvatures here presented aim at quantifying the trade-off between hyperedge(arc) size and the degree of participation of vertices members of the hyperedge(arc) in other hyperedges(arcs). For undirected hypergraphs, the curvature takes negative values when the degree of vertices of the hyperedge is more significant than the size of the hyperedge. For directed hypergraphs we devised four curvatures that gauge different aspects of hyperarcs. quantifies the trade-off between the size of the hyperarc tail and the input of its vertices, do so for the size of the hyperarc head and the output of its vertices; while and consider the size of the tail and the output of their vertices, and the size of the head and the input of their vertices, respectively. These curvatures are combined into and , which account for the flow through hyperarc and for its redundancy, respectively.
The Forman-Ricci curvature for hypergraphs introduced here differs from the alternative construction proposed in Emil-Melanie . There, hyperedges are interpreted as simplices. Here, we focus entirely on hyperedges, their sizes, and the degrees of vertices, thereby avoiding the re-interpretation of hyperedges as “higher-dimensional” objects and implicitly introducing additional structures, like boundaries of simplices, that are not part of the original data. For the particular case of directed hypergraphs we disentangled the curvature in the four aforementioned informative measures that allow a detailed exploration of the hypergraph structure. Moreover, we applied these curvatures to the analysis of two large networks, one of social and the other of chemical interactions.
The analysis of Wikipedia vote network exemplified the Forman-Ricci curvature of undirected hypergraphs, where elections constituted hyperedges and users/voters vertices. We found that curvature is mostly ruled by hyperedge size rather than by hyperedge degree. Likewise, the more users involved in elections, the more the presence of experienced users. In a traditional graph setting konect:2017:elec ; konect:leskovec207 , with users as vertices and votes as couple of users, conclusions such as the previous one on elections cannot be drawn. This shows the richness of hypergraphs and their curvatures, which for this particular case allowed the definition of a hyperedge as an election.
Forman-Ricci curvature for directed hypergraphs was computed over the metabolic network of E. coli, which traditionally has been analyzed through a graph setting Albert2000 ; Barabasi509 ; Wagner1803 and which has shed light on the important role of several substrates for the metabolic stability. In our approach, rather than focusing on substrates, we did on reactions, which were characterized as hyperarcs connecting sets of educts with sets of products.
In contrast to the Wikipedia vote network, we found that curvature values for the metabolic network were ruled by the degree of hyperarcs, i.e. of in- and out-degrees of tails and heads of hyperarcs. This is a chemical consequence, for it is unlikely that several educts collide simultaneously to give place to a product. In fact reactions where more than five educts participate in a single-step reaction are scarce C3CS35505E .
We emphasize that the strong dependence of hyperarc curvature is on the summation of the degrees of the vertex belonging to the hyperarc, which is different from the traditional degree of isolated vertices.
With curvature results at hand we defined “bottle neck” reactions as those few reactions whose educts are readily available (obtained from several reactions) and whose products are often used as educts. They are characterized by having very negative values. For E. coli this reactions is: adp+h+piatp+h+h2o. Bottle neck reactions can be considered as assortative ones, for they transform popular products into popular educts.
Curvature values also allowed detecting redundant reactions (“one of the crow reactions”), which can be easily replaced by others. The suitable curvature for detecting such reactions is , whose most negative values correspond to reactions where popular sets of educts are connected to popular sets of products. For E. coli, this reaction is atp+h+h2oadp+h+pi. Thus, adp phosphorilation is the metabolic bottle neck reaction but the reverse reaction is not that central for the metabolism.
Our results show that E. coli metabolic network makes use of a wealth amount of the products of its reactions to start other reactions. This contrast with the historical trend in wet-lab chemistry reactions, where most of the products are seldom used in further reactions PNAS . As the historical study was conducted over single substances, rather than over educts and products, further work on the curvature of wet-lab chemical reactions needs to be done to determine whether the behaviour found for E. coli is also a trend of chemical reactions, in general.
The curvatures here presented, as indicated in Equation 1 and as used in 2017arXiv171207600S ; 2017arXiv170700180W ; 74177 ; 2017CSF10150S ; 2016arXiv160708654W ; 2016arXiv160807838W ; 2016arXiv160504662S ; 2016arXiv160406634W ; 2016JSMTE063206S ; Jost-MATCH , can be weighted. In the recent sketch of curvature for hypergraphs Emil-Melanie , the weights are calculated based on the volume of the simplex associated to the hyperedge. Weights, however, can also be based on meta information of the network, e.g. user’s seniority in the Wikipedia example or stoichiometric coefficients in the metabolic network. This and other weighting schemes need to be explored in future studies on the curvature of hypergraphs, which our approach allows.
Acknowledgments
WL was supported by a PhD scholarship from the German Academic Exchange Service (DAAD): Forschungsstipendien-Promotionen in Deutschland, 2017/2018 (Bewerbung 57299294).
IV Appendix
| Abbreviation | Chemical name |
|---|---|
| \hline@rule | |
| 25aics | (S)-2-[5-Amino-1-(5-phospho-D-ribosyl)imidazole-4-carboxamido]succinate |
| 5aizc | 5-amino-1-(5-phospho-D-ribosyl)imidazole-4-carboxylate |
| 5aop | 5-Amino-4-oxopentanoate |
| 2cpr5p | 1-(2-Carboxyphenylamino)-1-deoxy-D-ribulose 5-phosphate |
| 6hmhpt | 6-hydroxymethyl dihydropterin |
| 5mdr1p | 5-Methylthio-5-deoxy-D-ribose 1-phosphate |
| 5mdru1p | 5-Methylthio-5-deoxy-D-ribulose 1-phosphate |
| accoa | Acetyl-CoA |
| adp | Adenosine diphosphate |
| adphep_D,D | ADP-D-glycero-D-manno-heptose |
| adphep_L,D | ADP-L-glycero-D-manno-heptose |
| asp_L | L-Aspartate |
| atp | Adenosine triphosphate |
| co2 | Carbon dioxyde |
| cyan | Hydrogen cyanide |
| dann | 7,8-Diaminononanoate |
| dhnpt | Dihydroneopterin |
| dtbt | Dethiobiotin |
| dxyl5p | 1-deoxy-D-xylulose 5-phosphate |
| tsul | Thiosulfate |
| gar | N1-(5-Phospho-D-ribosyl)glycinamide |
| gcald | Glycolaldehyde |
| gdpddman | GDP-4-dehydro-6-deoxy-D-mannose |
| gdpofuc | GDP-4-oxo-L-fucose |
| glu1sa | L-Glutamate 1-semialdehyde |
| gly | Glycine |
| h | H+ |
| h2o | Water |
| hco3 | Bicarbonate |
| malcoa | Malonyl CoA C24H33N7O19P3S |
| mmcoa_R | (R)-Methylmalonyl-CoA |
| mmcoa_S | (S)-Methylmalonyl-CoA |
| mql8 | Menaquinol 8 |
| mqn8 | Menaquinone 8 |
| nad | Nicotinamide adenine dinucleotide |
| nadh | Nicotinamide adenine dinucleotide - reduced |
| no2 | Nitrite |
| no3 | Nitrate |
| o2 | Molecular oxygen |
| pdx5p | Pyridoxine 5’-phosphate |
| phthr | O-Phospho-4-hydroxy-L-threonine |
| pi | Phosphate |
| pram | 5-Phospho-beta-D-ribosylamine |
| pran | N-(5-Phospho-D-ribosyl)anthranilate |
| prfp | 1-(5-Phosphoribosyl)-5-[(5-phosphoribosylamino)methylideneamino]imidazole-4-carboxamide |
| prlp | 5-[(5-phospho-1-deoxyribulos-1-ylamino)methylideneamino]-1-(5-phosphoribosyl)imidazole-4-carboxamide |
| q8 | Ubiquinone-8 |
| q8h2 | Ubiquinol-8 |
| so3 | Sulfite |
| tcynt | Thiocyanate |
| tsul | Thiosulfate |
| \hline@rule | |
References
- (1) A. Bretto, Hypergraph Theory: An Introduction. Springer Publishing Company, Incorporated, 2013.
- (2) E. Saucan, A. Samal, M. Weber, and J. Jost, “Discrete curvatures and network analysis,” MATCH Communications in Mathematical and in Computer Chemistry, vol. 80, no. 3, pp. 605–622, 2018.
- (3) S. Klamt, U.-U. Haus, and F. Theis, “Hypergraphs and cellular networks,” PLOS Computational Biology, vol. 5, no. 5, pp. 1–6, 2009.
- (4) G. Gallo, G. Longo, S. Pallottino, and S. Nguyen, “Directed hypergraphs and applications,” Discrete Applied Mathematics, vol. 42, no. 2, pp. 177 – 201, 1993.
- (5) V. C. Barbosa, R. Donangelo, and S. R. Souza, “Coevolution of the mitotic and meiotic modes of eukaryotic cellular division,” Phys. Rev. E, vol. 98, p. 032409, 2018.
- (6) T. Michoel and B. Nachtergaele, “Alignment and integration of complex networks by hypergraph-based spectral clustering,” Phys. Rev. E, vol. 86, p. 056111, 2012.
- (7) A. Vazquez, “Population stratification using a statistical model on hypergraphs,” Phys. Rev. E, vol. 77, p. 066106, 2008.
- (8) F.-L. Xiong, Y.-Z. Zhen, W.-F. Cao, K. Chen, and Z.-B. Chen, “Qudit hypergraph states and their properties,” Phys. Rev. A, vol. 97, p. 012323, 2018.
- (9) E. Estrada and J. A. Rodríguez-Velázquez, “Subgraph centrality and clustering in complex hyper-networks,” Physica A: Statistical Mechanics and its Applications, vol. 364, pp. 581–594, 2006.
- (10) B. Schölkopf, J. Platt, and T. Hofmann, Learning with Hypergraphs: Clustering, Classification, and Embedding, pp. 1601–1608. MIT Press, 2007.
- (11) A. Samal, R. P. Sreejith, J. Gu, S. Liu, E. Saucan, and J. Jost, “Comparative analysis of two discretizations of Ricci curvature for complex networks,” Scientific Reports, vol. 8, 2018.
- (12) M. Weber, J. Stelzer, E. Saucan, A. Naitsat, G. Lohmann, and J. Jost, “Curvature-based methods for brain network analysis,” ArXiv e-prints, 2017.
- (13) E. Saucan and J. Jost, “Network topology vs. geometry : from persistent homology to curvature,” Preprint, Max Planck Institute for Mathematics in the Sciences, 2017.
- (14) R. P. Sreejith, J. Jost, E. Saucan, and A. Samal, “Systematic evaluation of a new combinatorial curvature for complex networks,” Chaos Solitons and Fractals, vol. 101, pp. 50–67, 2017.
- (15) M. Weber, E. Saucan, and J. Jost, “Characterizing complex networks with forman-ricci curvature and associated geometric flows,” Journal of Complex Networks, vol. 5, no. 4, pp. 527–550, 2017.
- (16) M. Weber, E. Saucan, and J. Jost, “Can one see the shape of a network?,” ArXiv e-prints, 2016.
- (17) R. P. Sreejith, J. Jost, E. Saucan, and A. Samal, “Forman curvature for directed networks,” ArXiv e-prints, 2016.
- (18) M. Weber, J. Jost, and E. Saucan, “Forman-ricci flow for change detection in large dynamic data sets,” Axioms, vol. 5, p. 26, 2016.
- (19) R. P. Sreejith, K. Mohanraj, J. Jost, E. Saucan, and A. Samal, “Forman curvature for complex networks,” Journal of Statistical Mechanics: Theory and Experiment, vol. 6, p. 063206, 2016.
- (20) F. Bauer, B. Hua, J. Jost, S. Liu, and G. Wang, “The geometric meaning of curvature: Local and nonlocal aspects of ricci curvature,” in Modern Approaches to Discrete Curvature (L. Najman and P. Romon, eds.), pp. 1–62, Cham: Springer International Publishing, 2017.
- (21) Forman, “Bochner’s method for cell complexes and combinatorial Ricci curvature,” Discrete & Computational Geometry, vol. 29, no. 3, pp. 323–374, 2003.
- (22) C. Flamm, B. M. R. Stadler, and P. F. Stadler, “Generalized topologies: Hypergreaphs, chemical reactions, and biological evolution,” in Advances in Mathematical Chemistry and Applications (S. C. Basak, G. Restrepo, and J. L. Villaveces, eds.), pp. 300–328, Bentham-Elsevier, 2015.
- (23) R. Fagerberg, C. Flamm, R. Kianian, D. Merkle, and P. F. Stadler, “Finding the best synthesis plans,” Journal of Cheminformatics, vol. 10, p. 19, 2018.
- (24) “Wikipedia elections network dataset – KONECT,” 2017.
- (25) J. Leskovec, D. Huttenlocher, and J. Kleinberg, “Governance in social media: A case study of the Wikipedia promotion process,” in Proc. Int. Conf. on Weblogs and Social Media, 2010.
- (26) J. L. Reed, T. D. Vo, C. H. Schilling, and B. Ø. Palsson, “An expanded genome-scale model of escherichia coli k-12 (ijr904 gsm/gpr),” Genome Biol., vol. 4, pp. R54.1–R54.12, 2003.
- (27) H. Jeong, B. Tombor, R. Albert, Z. N. Oltvai, and A.-L. Barabási, “The large-scale organization of metabolic networks,” Nature, vol. 407, pp. 651–654, 2000.
- (28) A. Wagner and D. A. Fell, “The small world inside large metabolic networks,” Proceedings of the Royal Society of London B: Biological Sciences, vol. 268, no. 1478, pp. 1803–1810, 2001.
- (29) A.-L. Barabási and R. Albert, “Emergence of scaling in random networks,” Science, vol. 286, no. 5439, pp. 509–512, 1999.
- (30) E. Saucan and M. Weber, “Forman’s Ricci curvature – from networks to hypernetworks,” Tech. Rep. 1810.07749v1, ArXiv, 2018.
- (31) S. Brauch, S. S. van Berkel, and B. Westermann, “Higher-order multicomponent reactions: beyond four reactants,” Chem. Soc. Rev., vol. 42, pp. 4948–4962, 2013.
- (32) E. J. Llanos, W. Leal, D. H. Luu, J. Jost, P. F. Stadler, and G. Restrepo, “The three historical regimes of the exploration of the chemical space,” Submitted to PNAS, 2018.