More out of less: an excess integrated Sachs-Wolfe signal from supervoids mapped out by the Dark Energy Survey
Abstract
The largest structures in the cosmic web probe the dynamical nature of dark energy through their integrated Sachs-Wolfe imprints. In the strength of the signal, typical cosmic voids have shown good consistency with expectation , given the substantial cosmic variance. Discordantly, large-scale hills in the gravitational potential, or supervoids, have shown excess signals. In this study, we mapped out 87 new supervoids in the total 5000 deg2 footprint of the Dark Energy Survey at to probe these anomalous claims. We found an excess imprinted profile with amplitude. The combination with independent BOSS data reveals an ISW imprint of supervoids at the significance level with an enhanced amplitude. The tension with CDM predictions is equivalent to and remains unexplained.
keywords:
large-scale structure of Universe – cosmic background radiation1 Introduction
The apparent dominance of the obscure dark energy is a great puzzle in modern cosmology. Nevertheless, the concordance -Cold Dark Matter (CDM) cosmological model has shown a remarkable stability and flexibility against major probes like the cosmic microwave background (CMB), type Ia supernovae, baryonic acoustic oscillations, redshift-space distortion measurements, galaxy clustering, and gravitational lensing.
A complementary probe of dark energy is the integrated Sachs-Wolfe effect (Sachs & Wolfe, 1967, ISW) in the linear regime and the subdominant Rees-Sciama effect (Rees & Sciama, 1968, RS) on smaller scales. The late-time decay of large-scale gravitational potentials, due to the imbalance of structure growth and cosmic expansion, imprints tiny secondary anisotropies to the primary fluctuations of the CMB as photons traverse these potentials (see e.g. Fosalba et al., 2003; Fosalba & Gaztañaga, 2004). The details of the measured effect may unravel the dynamical properties of dark energy through the precise way in which it stretches the largest cosmic structures.
The ISW signal in the CDM model, however, is too weak to be directly reconstructed in the sea of primordial CMB photons. Therefore, this important complementary probe is, at best, expected to remain moderately informative about dark energy dynamics. Yet, Crittenden & Turok (1996) showed that the ISW effect may be measured in cross-correlations with tracers of the matter distribution with maximum signal-to-noise ratio for an idealistic deep full-sky survey. Practically, the expected significance remains at the level for currently available data sets (see e.g. Cabré et al. (2007)).
A combination of several tracer catalogues resulted in a constraint on the ISW “amplitude" using angular cross-correlation techniques, where corresponds to the concordance CDM prediction (Giannantonio et al., 2012; Planck 2015 results. XXI., 2016). These combined measurements, despite their moderate signal-to-noise ratio, appear to be important consistency tests of alternative cosmologies. For instance, various Galileon models that predict a different sign for the ISW signal have practically been ruled out (Barreira et al., 2014; Renk et al., 2017).
As an alternative, large voids and superclusters offer a way to reconstruct the ISW signal locally. A pioneering measurement of this type by Granett et al. (2008) involves the identification of individual voids in the cosmic web using the ZOBOV algorithm (Neyrinck, 2008). Then CMB temperatures are stacked on the super-structure locations as a measure of their average imprint. The surprise was that the combined signal for supervoids and superclusters appears to be higher than CDM expectations, according to theoretical and simulated follow-up studies (e.g. Nadathur et al., 2012; Aiola et al., 2015). This curious signal has survived new CMB data releases and tests against systematics and remains a puzzle.
Besides, voids also provide an interesting new window to cosmological observables in the low-density Universe, including baryonic acoustic oscillations (e.g. Kitaura et al., 2016), Alcock-Paczyński tests (e.g. Sutter et al., 2012), redshift-space distortions (e.g. Hamaus et al., 2016; Hawken et al., 2017), or gravitational lensing (e.g. Melchior et al., 2014; Sánchez et al., 2017). Synergies of the ISW measurements with these additional probes may uncover important new details about the apparent tensions in the amplitude of the signal.
1.1 Voids vs. supervoids
Naturally, revisions of the methods, tests of selection effects, and a possible confirmation in other data sets were crucial steps to (in)validate this apparent anomaly of the dark sector. Measurement at lower redshifts () using new Sloan Digital Sky Survey (SDSS) spectroscopic data showed no high-significance detection with differently constructed void catalogues (Ilić et al., 2013; Planck 2013 results. XIX., 2014; Cai et al., 2014; Hotchkiss et al., 2015; Kovács & Granett, 2015). Ultimately, using the theoretically best possible stacking methods, simulations, and data available, Nadathur & Crittenden (2016) recently reported a detection of the ISW signal from “isolated" voids and superclusters in the Baryon Oscillations Spectroscopic Survey (BOSS) data release 12 (DR12). They used optimal matched filters and found , i.e. close to the most accurate estimates from full cross-correlations with (see more detailed comparisons to our methods below).
Naively, these findings might sound conclusive but the situation is more intricate. As a clue for the special nature of the original SDSS supervoids, Granett et al. (2015) reconstructed their average shape using the overlapping BOSS DR12 spectroscopic data, and found that the supervoids are significantly elongated in the line-of-sight. In photometric data, used also by Granett et al. (2008), finding typical voids surrounded by overdensitites is challenging because of the smearing effect of photo- errors in the line-of-sight distribution of galaxies. Systems of “merged" voids lined up in our line-of-sight constituting supervoids with numerous sub-voids, however, are possible to detect. Undeniably, elongated void structures have a longer photon travel time compared to a spherical void of the same angular size and therefore correspond to larger ISW temperature shifts (Kovács & García-Bellido, 2016; Marcos-Caballero et al., 2016). Although this in principle could explain an excess signal, Flender et al. (2013) concluded that the assumption of sphericity does not lead to a significant underestimate of the ISW signal in a CDM model.
Relatedly, it is worth noting that Cai et al. (2017) did find excess signals using the BOSS DR12 data. They also focussed on efficient pruning strategies to, above all, remove the so-called voids-in-clouds that are expected to be aligned with hot spots on the CMB. Apart from the different filtering methods applied, most importantly Cai et al. (2017) also considered merged voids, while the implementation of the watershed algorithm by Nadathur & Crittenden (2016) prevented neighboring voids from merging (see also Nadathur et al., 2017). At least in part, this difference explains the different outcomes because Hotchkiss et al. (2015) have pointed out in simulations that the shape of the stacked ISW imprint does depend on the void definition. In particular, following Granett et al. (2008) to focus on the most extreme structures, Cai et al. (2017) only used voids with a ZOBOV probability measure (i.e., least likely to occur in random data), and reported at significance. This excess signal of large voids again suggests that void definition, and, in particular, details in the merging process of voids do have an important role in this problem.
Then recently, Kovács (2018) critically revisited the above pruning and stacking strategies. Detailed simulation analyses validated the (dis)advantages of both strategies, and, importantly, proved that there is a rather special sub-population of large voids that leave a characteristic “cold-spot-and-hot-ring" ISW profile with fine details. These extended underdensities of effective radii encompass at least five merged sub-voids. In hindsight, these facts explain why Hernández-Monteagudo & Smith (2013) found that varying the number of the objects in the stacking, or using different filter sizes lowers the significance, because the biggest fluctuations are also the rarest.
Kovács (2018) then performed yet another BOSS DR12 stacking measurement restricted to these supervoids and reported an excess signal with at the significance level. These findings are not affected by a posteriori bias arguments because a special sample of supervoids can be selected for stacking measurements prior to looking at real-world data. These supervoids appear to imprint an excess ISW signal on the CMB but independent new measurements are needed to validate these results further elsewhere on the sky.
In Kovács et al. (2017), we have recently attempted to probe these claims in the Southern hemisphere. We used the first year data (Y1) of the Dark Energy Survey (DES, The Dark Energy Survey Collaboration, 2005) and identified 52 voids and 102 superclusters at redshifts using the void finder tool described in Sánchez et al. (2017). The heart of that method is a restriction to 2D slices of galaxy data, and measurements of the projected density field around centers defined by minima in the corresponding smoothed density field. Similarly to the Granett et al. (2015) analysis, our tests revealed a significant mean line-of-sight elongation for the super-structures that is caused by the photo- uncertainties. All in all, we found a cold imprint of voids, formally with , that is higher than the imprint of such super-structures in the simulated CDM universe. We also found for superclusters. Therefore, in combination we constrained with DES Y1 super-structures. These measurements, although hinting again at a large ISW amplitude, were indecisive because of the significant noise level.
In this paper, we extend these measurements to the full 5000 deg2 footprint of the Dark Energy Survey. We also extend the redshift range of the analysis to with our new data to probe these anomalous results in the biggest volume available. Finally, we attempt to combine our improved DES measurements with existing BOSS results in order to reduce the statistical uncertainties and possibly put tight constraints on the amplitude of supervoids.
The paper is organized as follows. Data sets and detection algorithms are introduced in Section 2. Our simulated and observational results are presented in Section 3, while the final section contains a summary, discussion and interpretation of our findings.
2 Data sets for the ISW analysis
2.1 Maps of CMB temperature
We use the Planck Spectral Matching Independent Component Analysis (SMICA) CMB temperature map (Planck 2015 results. XI., 2016) for our cross-correlations with void positions. The map was downgraded to resolution (approximately arcmin) with HEALPix pixelization (Gorski et al., 2005). We masked out contaminated pixels with the WMAP 9-year extended temperature analysis mask (Hinshaw et al., 2013) to avoid re-pixelization effects of the CMB masks provided by Planck. Several studies confirmed (see e.g. Planck 2013 results. XIX., 2014) that the cross-correlation signal observed at void locations is independent of the CMB data set when looking at WMAP Q, V, W, or Planck temperature maps. We, however, again checked for possible color dependence in the analysis.
2.2 Galaxy data and mocks
We closely follow Kovács et al. (2017) in our methodology and extend our previous analysis by using photometric redshift data from the Dark Energy Survey (Flaugher et al., 2015; Dark Energy Survey Collaboration, 2016). DES covers about one eighth of the sky (5000 deg2) to a depth of , imaging about 300 million galaxies in 5 broadband filters () up to redshift . In this paper we used a luminous red galaxy sample from the first three years of observations (Y3). This Red-sequence MAtched-filter Galaxy Catalog (redMaGiC, Rozo et al., 2016) is a catalog of photometrically selected luminous red galaxies, based on the red-sequence MAtched-filter Probabilistic Percolation (redMaPPer) cluster finder algorithm (Rykoff et al., 2014). We utilized the redMaGiC sample because of its exquisite photometric redshifts, namely , and a redshift outlier rate of . The resulting galaxy sample has a constant comoving space density in three versions, Mpc-3 (high density sample, brighter than 0.5), Mpc-3 (high luminosity sample, brighter than 1.0)), Mpc-3 (higher luminosity sample, brighter than 1.5)).
In general, we aim to choose the free parameters of our analysis and prune our void catalogue in order to detect and then study supervoids rather than ordinary voids defined with other methods. Different void definitions are optimal for different cosmological probes as shown by Cautun et al. (2018) in the case of void lensing signals. For ISW analyses using voids, Kovács (2018) showed that supervoids of radii represent a special subclass of extended underdensitites with a specific ISW imprint. Importantly, these large voids have shown anomalies previously that motivate further studies with more details using DES data.
Therefore, we decided to use the higher luminosity tracer sample because it has an approximately constant co-moving space density of tracers up to (as opposed to and for the other versions) that is a key property to maximize the volume of our supervoid mapping at the expense of surveying the volume of interest with a sparser sample. In fact, in sparser galaxy tracers the number of voids identified decreases, but the average void size is larger (Sutter et al., 2014). More importantly, voids resolved by sparse galaxy samples are also on average shallower but trace more extended dark matter underdensities (or supervoids) which should have a longer photon travel time and therefore correspond to larger ISW temperature shift (see e.g. Hotchkiss et al., 2015; Nadathur & Hotchkiss, 2015).
For reconstructing the CDM expectations of the stacked ISW imprint of DES Y3 supervoids, we closely followed our methodology developed for DES Y1 (see Kovács et al., 2017). We used the full-sky simulated ray-tracing temperature data from the Jubilee ISW project (Watson et al., 2014). This project is built upon the Jubilee simulation, a CDM N-body simulation with particles in a volume of ( Gpc)3, assuming WMAP-5 cosmology. A corresponding full-sky mock LRG catalogue was initially designed to model the properties of SDSS LRGs studied in Eisenstein et al. (2005). This mock provides a sample with Mpc-3 that is comparable to the galaxy density of our DES higher luminosity redMaGiC sample. The Jubilee mock also features a constant comoving space density like the DES higher luminosity sample.
We note that void finding is not only sensitive to sparsity, but also more highly biased tracers yield larger voids on average (Sutter et al., 2014; Pollina et al., 2017). Recently, Pollina et al. (2018) studied the roles of tracer bias and photo- errors in void properties using DES mocks and observations. They also reported a larger mean void size when using sparser tracers. Importantly, they also confirmed that large voids can be robustly identified using DES photo- data focusing on galaxy clusters.
Nevertheless, the estimated linear galaxy bias values of the Jubilee and DES LRG samples are quite similar at the level of , thus no meaningful difference is expected in this respect (Ho et al., 2008; Elvin-Poole et al., 2018). Hotchkiss et al. (2015) and Flender et al. (2013) both found that the expected stacked ISW signal one determines from Jubilee, or from similar ISW simulations, will always be an overestimate of that observable from superstructures in DES-like data, especially if the tracer density in the mock is lower. Relatedly, Hernández-Monteagudo & Smith (2013) reported, in yet another ISW simulation and modeling analysis, that Gaussian and fully non-linear simulations are in close agreement. The difference induced by adopting a slightly different cosmological model should introduce changes in the ISW amplitude at the 2 per cent level. We conclude, therefore, that the simulated Jubilee results can meaningfully be compared with observed DES data to estimate the level of (in)consistency between the ISW imprint of supervoids.
| Smoothing | ( Mpc/h) | |
|---|---|---|
| 20 | 4538 (1083) | -1.8 |
| 50 | 2019 (1793) | -2.2 |
| 100 | 272 (248) | -3.3 |
2.3 Supervoids for stacking
We now describe our methodology for void definition and necessary pruning techniques. In a DES void finding project, Sánchez et al. (2017) found that significant real underdensities can be identified even using photo- data in tomographic slices of width roughly twice the typical photo- uncertainty. The low outlier rate of the DES redMaGiC sample makes Gaussian photo- errors with added to Jubilee redshifts sufficient to model the redMaGiC characteristics for our purposes.
The heart of the method is a restriction to 2D slices of galaxy data, and measurements of the projected density field around centers defined by minima in the corresponding smoothed density field. The line-of-sight slicing was found to be appropriate for slices of thickness for photo- errors at the level of or at . We adopt this strategy in our Jubilee void finding procedure and slice the data in shells of thickness in the line-of-sight.
A free parameter in the method is the scale of the initial Gaussian smoothing applied to the galaxy density field. In Kovács et al. (2017), we have found, in the Jubilee simulation, that is a preferable choice for ISW measurements using the whole void sample in the stacking procedure. For weak lensing measurements with DES voids, however, Sánchez et al. (2017) reported that the smaller smoothing is preferable. In order to more efficiently identify the largest structures with possible merging of smaller voids, we now increased the smoothing length of the void finder. With larger smoothing, the merging of typical voids into larger encompassing supervoids becomes possible.
While a smoothing results in more voids in total, as a result of void merging, a smoothing returns significantly more supervoids that we aim to study. Moreover, we found that a smoothing results in a higher signal than with thus we certainly gain in terms of signal-to-noise. We summarize our related analyses in Table 1.
We note that a significantly larger smoothing scale is not expected to further increase the detectable signal. Firstly, the number of super-structures would decrease significantly, even if the signal amplitude is slightly increased compared to the smoothing case. Furthermore, the smoothing level we chose is comparable to the photo- smearing effect in the line-of-sight direction, resulting in fairly spherical overall smoothing without significant elongation in our line-of-sight. We thus adopt a smoothing scale in our analysis to further optimize the measurement for supervoids.
Another arbitrary choice in the analysis is the definition of the slice boundaries along the line-of-sight. Following again Kovács et al. (2017), we created supervoid catalogues using shifted “slicings" of the galaxy catalogue for both data and simulations and tested the consistency among the different resulting catalogues in terms of general catalogue properties and measurement characteristics. In our measurement, we consider the mean signal coming from these slightly different realizations of the slicing.
3 Results
3.1 Simulations - a Jubilee analysis
We build up on the recent findings by Kovács (2018) who reported that the excess ISW signals, seen also by other authors with sub-optimal pruning techniques, can be attributed to supervoids of radii (for details in void definition and methodology see Sánchez et al. (2017)). Importantly, the stacked ISW imprint of these large-scale features in the density map shows a cold spot surrounded by a hot ring, unlike for smaller voids. This suggests that this is a physically different branch of underdensities that efficiently probe the largest hills of the gravitational potential in their full extent. These super-structures actually carry most of the potentially observable ISW signal which, while environment, density profiles, redshifts, and exact shapes can be important for the accurate estimates, certainly is expected to correlate with void size.
Nevertheless, if the SDSS/BOSS excess ISW-like signal of these supervoids is simply a pattern in noise, it certainly should not occur elsewhere in the sky. Therefore, the independent DES data is a great way to test these claims. We thus follow up on these anomalous results and a priori consider these seemingly anomalous fluctuations in the gravitational potential to possibly confirm or falsify the apparent excess signals.
We re-estimated the expected ISW imprint of these supervoids using the Jubilee lightcone. We identified mock supervoids at redshifts , providing a basis for accurate calculation of the expected signal. Following Kovács et al. (2017), we stack the ISW-only Jubilee temperature map on supervoid locations using the gnomview projection technique of HEALPix (Gorski et al., 2005). We also re-scale the images knowing the angular size of the supervoids thus the void boundaries coincide in the stacked image as well as the centres.
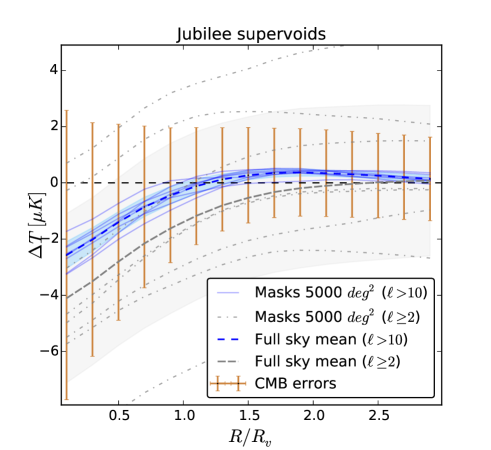
Given the measurement errors, Kovács (2018) concluded that the removal of the large-scale ISW modes helps to remove potential biases from the measured profiles, at the expense of reducing the signal itself by possibly a factor of two. The result is a more accurate mapping of features and a better convergence to zero signal at for these largest voids. We repeated these tests with our Jubilee supervoids and confirmed the previous results. As shown in Figure 1, the modes in Jubilee result in a convergence to zero signal is reached at higher radii far beyond the actual void radius. Relevantly, the treatment of these large-scale fluctuations is yet another difference between the different outcomes of two recent BOSS DR12 analyses; Cai et al. (2017) removed the modes while Nadathur & Crittenden (2016) used all available modes, and only the former reported unexpected excess signals.
Another important element of the accurate estimation of the expected ISW signal is the role of masking. In fact, masking is related to the removal of the large-scale modes. If the 5000 deg2 DES Y3 footprint happens to cover a hotter or colder large-scale peak in the observable ISW map, then such contributions from super-survey modes may bias the signal. This is a further argument in support of the removal of these modes.
In Kovács et al. (2017) we showed that there is a non-negligible intrinsic fluctuation in the ISW imprint of supervoids if the signal is estimated from rather small DES Y1-like 1000 deg2 cut-sky samples in Jubilee, especially if all modes are considered down to . We now considered independent DES Y3-like 5000 deg2 masked areas in eight octants on the Jubilee sky. In Figure 1, we demonstrate that an unbiased estimate of the ISW signal is obtained, with tolerable variation in the full extent of the imprint profile, if the large-scale modes are excluded from the analysis. With modes included, we find non-negligible bias and higher sample variance for the masked octant skies that we analyzed.
Naturally, considering the full-sky result the accuracy of the stacked profile can be further increased with more supervoids in the stacked sample. We therefore use the full-sky estimate in Jubilee for an accurate and unbiased estimate of the stacked ISW imprint of supervoids.
We note that, in principle, the larger area of the DES Y3 data compared to the Y1 subset may allow the consideration of lower modes (possibly ). However, we do not include them in our analysis as they correspond to angular sizes that exceed that of our supervoids (). Moreover, the comparison of our results to earlier estimations of stacked ISW imprints, that typically removed , becomes easier.
3.2 The Dark Energy Survey data
We simply repeat the above stacking procedure for a sample of 87 DES supervoids of radii . Reassuringly, we only removed 5 voids from the sample that were smaller than thus the optimization of our void finding algorithm to form supervoids of voids if possible with large initial smoothing works with great efficiency. We also note that we robustly find similar supervoids if the “slicing" of the density field is shifted by up to , accounting for the arbitrary choice of slice definition as explained in Section 2.3. The few biggest, though rather shallow, observed supervoids reach radii . This is virtually compatible with the expected abundance of these largest, and typically rather shallow, structures in the matter density field (Nadathur et al., 2014; Szapudi et al., 2015).
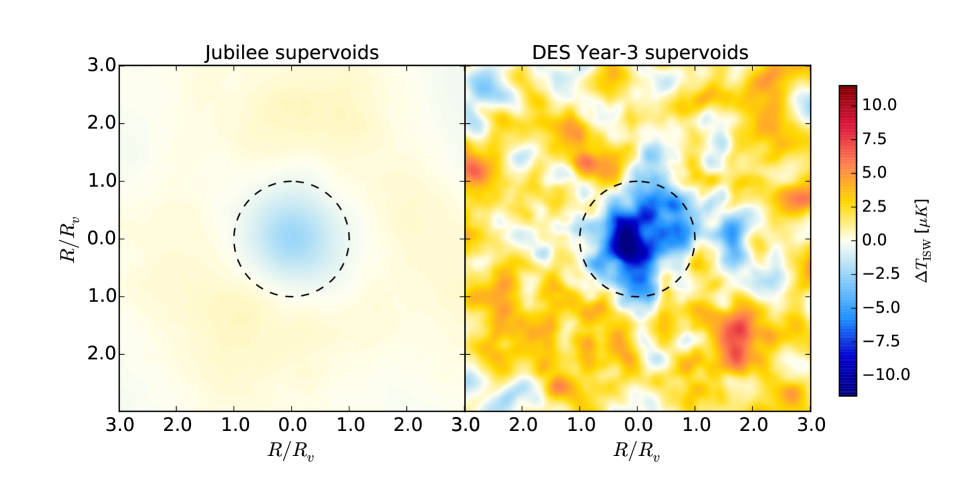
The stacked CMB image of the DES supervoids is shown in Figure 2, together with the simulated result. While the images are similar in the nature of the imprints with cold spots in the center and a typically hot surrounding area, the amplitude of the signal is higher for the DES data. The data shows a visually compelling cold imprint in the central region of the DES image. For comparison, the coldest pixels in the Jubilee image are of , in consistency with several previous results (Nadathur et al., 2012; Flender et al., 2013; Hernández-Monteagudo & Smith, 2013).
Importantly, the angular extent of the central DES cold spot appears to be consistent with the simulated result. We note that both Kovács et al. (2017) and Kovács (2018) found, empirically, a mismatch in the angular size of the central cold spots for DES and BOSS supervoids, respectively, when compared to Jubilee results. At least in part, these mismatches are sourced by differences in tracer density in data and simulation in these previous studies. We interpret this better agreement between data and sims as a consequence of improvements that we implemented in the catalogue selection and pruning of DES data to match the Jubilee mock more accurately.
3.3 Template fitting: DES Y3 and BOSS DR12
Beyond the visual impressions, we measured the azimuthally averaged radial ISW profile in fractional void radius units with bins of . We extend the range of the profile to to include the potentially measurable ISW imprints of the large-scale overdensities that surround the supervoids in the cosmic web.
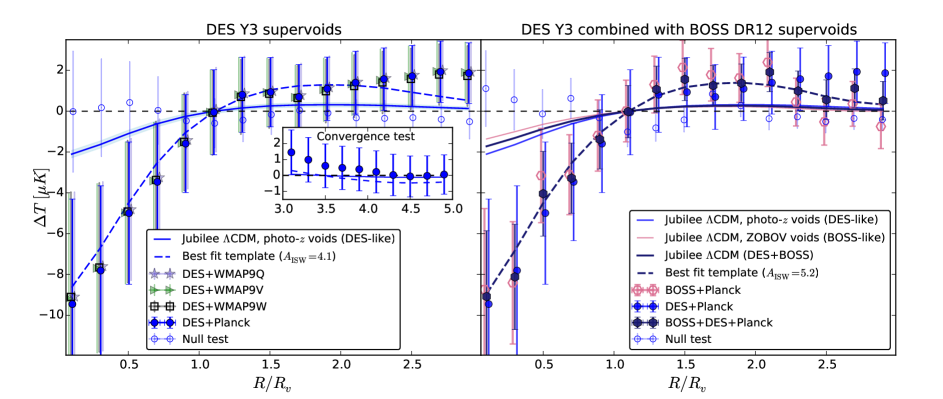
Overall, the DES Y3 data shows an ISW amplitude with a moderate significance level using the Planck SMICA map. This translates to a excess signal above . As an additional test, we do not find evidence for significant frequency dependence when using WMAP9 Q, V, and W temperature maps (see left panel of Figure 3). Relatedly, small-scale systematic effects in the DES galaxy maps are not expected to affect our results, given on one hand the large angular size () of the supervoids. On the other hand, the cross-correlation nature of our measurement also makes harder for the survey systematics to alter the observed correlations, because spurious voids would only dilute the stacked signal (see e.g. Elvin-Poole et al., 2018, for related analyses and relevance in DES galaxy clustering probes). We also performed null tests by rotating the Planck SMICA map around the Galactic poles by and by randomizing the void positions in the DES window. We found no spurious correlations (see Figure 3).
We also analyzed in greater details the convergence properties of the stacked profile in the outer profile at . While the DES data points show a potential trend for a bias in our measurements at large radii, the continuation of the profile to clearly demonstrate that, given the error bars, the profile converges to zero signal away from the void interior as expected (see the inset in the left panel of Figure 3). We thus argue that the highest measured temperature in the DES Y3 profile at is a fluctuation given the error bars and it does not correspond to a real peak in the ISW imprint profile that is expected at based on our Jubilee analysis.
In our methodology, we fit an amplitude to the observable imprints in the DES data using the Jubilee ISW template profile we constructed. We evaluated a statistic
| (1) |
where is the covariance matrix obtained by performing random stacking measurements using Gaussian CMB simulations. The randoms have been generated with the HEALPix synfast routine using the Planck 2015 data release best fit CMB power spectrum (Planck 2015 results. XI., 2016). Gaussian CMB simulations without instrumental noise suffice because the CMB error is dominated by cosmic variance on the scales we consider (see Hotchkiss et al., 2015).
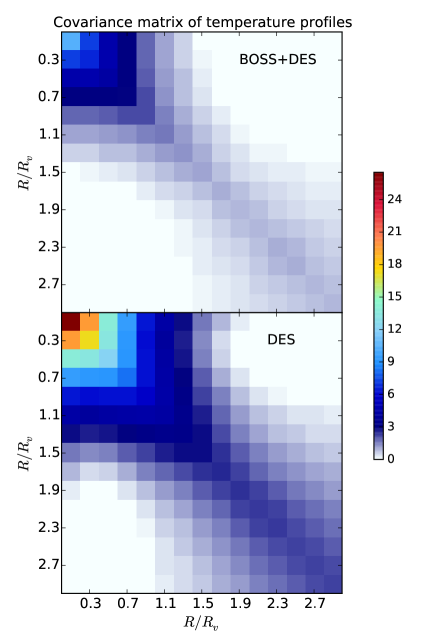
We first determined the sample variance associated with the DES Y3 window on the simulated CMB skies ( modes included) as each masked random map has a different non-zero mean temperature that adds a bias to the stacked images. We found that the standard deviation of these fluctuations is . We then found a fairly typical bias value in the filtered Planck temperature map. We de-biased the observed temperature profile and each simulated CMB map in the masked DES Y3 window, and tested the effect of this correction on the resulting covariance matrices and errors. When removing the bias, we found a moderate larger noise inside the re-scaled void radius () and a rather important increment in the errors and stronger bin-to-bin covariance in the outer profile at (see Figure 4 for a visual impression).
We then repeated the stacking procedure on the simulated CMB skies. A potential strategy to estimate the error bars is to keep the void positions fixed and vary the CMB realization, because in this case overlap-effects for voids are accounted for more efficiently (see related discussions in Hotchkiss et al., 2015). We note that having overlapping supervoids does not automatically introduce a bias in the measurement because we estimate the signal in Jubilee with the same procedure, instead of modeling individual structures. Importantly, Flender et al. (2013) analyzed the differences between a spherical model of Gaussian perturbations and fully simulated ISW maps with ray-tracing. The latter contain contributions from potentially very elongated super-structures which add more to the total signal than only spherical structures. They reported that the differences are negligible thus overlapping voids that may form elongated structures in the line-of-sight do not significantly affect the results.
However, Cabré et al. (2007) showed in their simulated analyses of ISW error estimation methods in comparison that keeping a single realization of the galaxy map that one cross-correlates with the simulated CMB skies results in a under-estimation of the true measurement errors. For DES Y3 redMaGiC data, a large set of mock galaxy catalogues is not available (only five at the moment) to completely solve this problem but we performed two related tests to check how a stacking measurement using voids is affected. As an external test, we first considered 1000 mock BOSS supervoid catalogues111produced by Seshadri Nadathur, available on request and the BOSS DR12 supervoid sample with 96 observed supervoids used by Kovács (2018). We confirmed the general galaxy-CMB cross-correlation results by Cabré et al. (2007) for supervoid samples, finding larger error bars (and slightly altered correlation structure) when varying both the CMB and the galaxy maps in the random stacking.
We then cross-correlated the random CMB maps with randomly selected mock DES Y3 redMaGiC void catalogues out of the five mocks available. The random runs, as expected, showed a null result for a correlation on average. We again determined larger error bars compared to keeping the observed DES Y3 catalogue in front of all random CMB maps. These findings convincingly demonstrate that an approximately accurate correction can be implemented even with a smaller number of realistic mock supervoid catalogues. We thus include these corrections in our signal-to-noise analyses. The resulting covariance matrices are shown in Figure 4. We note that the shape of the histogram considering simulated fits of the amplitude in randoms closely follows a distribution with 14 degrees of freedom (given 15 bins and one fit parameter) and the values themselves closely approximate a Gaussian distribution with zero mean.
We then combined the DES Y3 measurements with BOSS DR12 supervoid results by Kovács (2018). These supervoids in BOSS, and their corresponding BOSS-like Jubilee supervoids, are based on a different void finding algorithm called ZOBOV (ZOnes Bordering On Voidness)222The DR12 and Jubilee catalogues used by Kovács (2018) are non-public. However, a public catalogue is available for BOSS DR12 and DR11 at http://www.icg.port.ac.uk/stable/nadathur/voids/ or on request from their authors (see Nadathur, 2016, for details).. This widely used algorithm identifies density depressions in a 3-dimensional set of points and relies on watershed techniques to map the full extent of the under-densities (see e.g. Neyrinck, 2008; Nadathur et al., 2017, for details).
Overall, we report good consistency between the observed DES and BOSS data points with slight differences in the outer profiles beyond , as shown in the right panel of Figure 3. The joint DES+BOSS measurement shows a central cold spot and a surrounding hot ring. Quantitatively, the combination with 96 independent supervoids reveals an excess ISW signal of supervoids with amplitude, corresponding to significance.
Notably, the CDM expectation for the DES supervoids shows a colder imprint in the center while having comparable hot rings for BOSS and DES void populations. We interpret this finding as a consequence of the preference for supervoids moderately elongated in our line-of-sight due to photo- smearing, as discussed by Kovács et al. (2017) and also in this paper in Section 1.1. However, the BOSS observations and BOSS-like ZOBOV voids in the Jubilee simulations have also shown similar features in the stacked signal thus we conclude that elongation itself is not the main source of these anomalies.
All things considered, this result underlines the importance of a better understanding of void finding strategies for ISW measurements. In Figure 4, we compare our constraints to several relevant observational probes of the amplitude of the ISW signal. By combining the independent results for supervoid observations, the discrepancy with concordance CDM expectations grows to for BOSS+DES ( for DES alone).
4 Discussion & Conclusions
We measured the cold imprint of DES supervoids on the CMB using the full 5000 deg2 survey area ( deg2 in our Year-1 analysis). We also extended the redshift range for supervoid search from to . We argued that the expected signal of supervoids is higher when combining a large density smoothing and a sparser tracer sample (higher luminosity). With these a priori analysis choices, our data is more similar to the Jubilee mock catalogues that we use to estimate the ISW signal. We mapped out 87 supervoids to probe previous claims of excess ISW signals coming from these vast hills imbedded in the gravitational potential. For DES data alone, we found an excess imprinted profile with amplitude. This observed value is higher than the Jubilee CDM estimate with a moderate confidence.
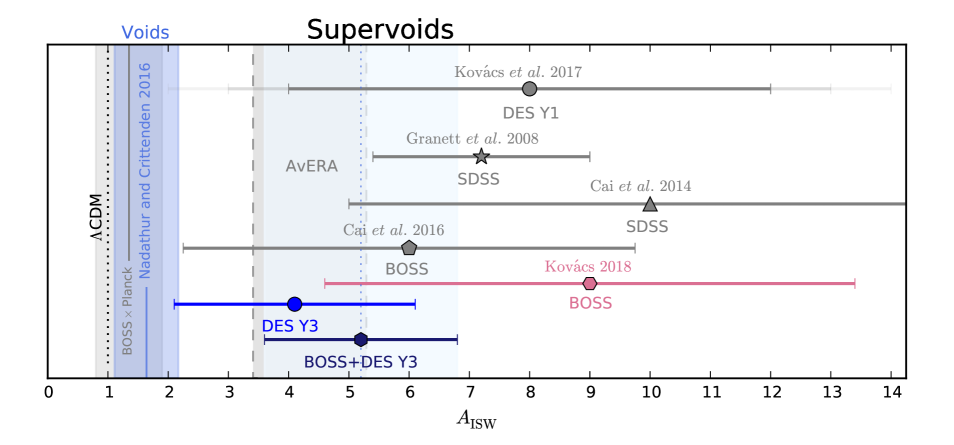
The combination with independent BOSS data reveals an excess ISW signal of supervoids with amplitude, corresponding to a observation (see Table 2). The tension with CDM predictions is equivalent to . This moderately significant observation of excess ISW-like signals of supervoids is consistent with several previous estimates based, at least in part, on merged voids (Granett et al., 2008; Cai et al., 2014, 2017; Kovács et al., 2017; Kovács, 2018), but inconsistent with presumably more optimal measurements that use full cross-correlation or a more detailed decomposition of the cosmic web as an estimator (see e.g. Planck 2015 results. XXI., 2016; Nadathur & Crittenden, 2016; Stölzner et al., 2018).
The origin of this excess is of course not necessarily cosmological but at least the signal has now been proven to be robust. We also know that it shows no CMB color dependence which excludes some possibilities. A residual contamination, coming from unresolved extragalactic point sources, may still be blamed though (see e.g. Millea et al., 2012), since dust from galaxies at all redshifts contributes to the CMB temperature fluctuations, which, in turn, would result in a positive correlation between CMB temperatures and galaxy density (see e.g. Ho et al., 2008). However, Hernández-Monteagudo & Smith (2013) reported that realistic contaminations of this kind leave a different imprint than what has been observed by Granett et al. (2008) thus this possibility seems unlikely.
| Cross-correlated data sets | S/N | Tension | |
|---|---|---|---|
| DES Y3 Planck | 2.1 | ||
| DES Y3+BOSS DR12 Planck | 3.3 |
In the theory ground, it is typically assumed that neither modifications of the concordance model, given other precise constraints (Nadathur et al., 2012), nor e.g. simple modified gravity scenarios seem to alleviate the ISW tension (e.g. Cai et al., 2014). However, it is interesting to see that the amount of the excess signal is close to what is expected in the AvERA (Average Expansion Rate Approximation) cosmology. Rácz et al. (2017) calculate the expansion rate of local mini-universes and average the volume increment spatially to get the global scale factor increment for an otherwise normal -body simulation. Recently, Beck et al. (2018) reported an enhanced amplitude using ISW auto-correlation functions for multipoles in the AvERA model. This excess is sourced by a characteristically higher growth factor derivative at where these supervoids may reprocess the CMB light. In general, modified gravity theories with alternative growth rates might provide some ground to discuss such excess signals, related especially to spatial perturbations in dark energy that are expected to mainly alter large-scale physics and their unique ISW effect is their main hope to be uncovered (see e.g. Weller & Lewis, 2003; Bean & Doré, 2004; Hu & Scranton, 2004; Mota et al., 2008; de Putter et al., 2010).
All things considered, the observational evidence for an excess ISW signal of supervoids is still not fully conclusive but certainly warrants further studies as it practically remains unexplained. There are, however, other anomalies in cosmology that may be related to the ISW mystery.
Firstly, our results provide a framework to re-think the qualitatively similar case of the CMB Cold Spot (see e.g. Cruz et al., 2005; Finelli et al., 2015; Szapudi et al., 2015; Kovács & García-Bellido, 2016; Naidoo et al., 2016, 2017). With a significant enhancement of the density-temperature correlation at large scales, the Cold Spot and the Eridanus supervoid can plausibly be related via this unexpected excess signal. Naively, the recent findings by Mackenzie et al. (2017), based on a pencil beam-like galaxy survey centered on the Cold Spot, suggest that the Eridanus supervoid is not special and thus we should expect similar cold spots elsewhere in the sky where they see similar depression in pencil beam-like statistics. However, this approach ignores the role of the environment of these supervoids, or in other words fails to map the full extent of these large structures. More recently, Courtois et al. (2017) showed that a significant basin of repulsion is located in the proximate direction toward the Cold Spot, using the wide-area three-dimensional gravitational velocity field within . With wide-angle DES redMaGiC photo- data in the Cold Spot area, we will map this area in greater details (Kovács et al. in prep.) to see the full extent of the Eridanus supervoid. We note that the biggest supervoid identified in the present Y3 analysis is of radius and of central galaxy underdensity (equivalent to a matter underdensity of with the simple DES redMaGiC linear galaxy bias ). While these void parameters are comparable to those of the Eridanus supervoid, the redshift is higher in this case with (corresponding to a smaller angular size) thus the expected ISW imprint is less strong and harder to clearly detect than that of a supervoid at .
Secondly, these new findings raise the possibility that the moderate tensions between cosmological parameters determined from the late Universe and those from CMB anisotropies may arise because both the local cosmic web and the CMB maps are in fact problematic. Speculatively, supervoids and inhomogeneities may be more influential than expected. This can contribute to biases in the determination of the Hubble constant (see e.g. Bernal et al., 2016), and at the same time imprint unexpected secondary anisotropies in the CMB that can, in principle, alter several cosmological observables and lead to anomalies (Schwarz et al., 2016).
In summary, we argue that smaller catalogues of the largest voids may be more informative about dark energy than presumably optimal techniques. We observe possible problems at the largest scales and averaging may wash out the interesting new features. In the Dark Energy Survey Collaboration, we aim to continue this research along slightly different lines, including measurements of the imprint of these supervoids in CMB lensing convergence maps, and extensions of the measurements to supercluster samples. In the near future, we believe that, beyond a better understanding of the methodologies and possible re-analyses, new cosmic web decomposition data from experiments like the Dark Energy Spectroscopic Instrument (DESI) (Levi et al., 2013) and the Euclid mission (Amendola et al., 2013) will further constrain the ISW signal.
Acknowledgments
This paper has gone through internal review by the DES collaboration. It has been assigned DES paper ID DES-2018-0343 and IFT preprint number IFT-UAM/CSIC-19-005.
Funding for the DES Projects has been provided by the U.S. Department of Energy, the U.S. National Science Foundation, the Ministry of Science and Education of Spain, the Science and Technology Facilities Council of the United Kingdom, the Higher Education Funding Council for England, the National Center for Supercomputing Applications at the University of Illinois at Urbana-Champaign, the Kavli Institute of Cosmological Physics at the University of Chicago, the Center for Cosmology and Astro-Particle Physics at the Ohio State University, the Mitchell Institute for Fundamental Physics and Astronomy at Texas A&M University, Financiadora de Estudos e Projetos, Fundação Carlos Chagas Filho de Amparo à Pesquisa do Estado do Rio de Janeiro, Conselho Nacional de Desenvolvimento Científico e Tecnológico and the Ministério da Ciência, Tecnologia e Inovação, the Deutsche Forschungsgemeinschaft and the Collaborating Institutions in the Dark Energy Survey.
The Collaborating Institutions are Argonne National Laboratory, the University of California at Santa Cruz, the University of Cambridge, Centro de Investigaciones Energéticas, Medioambientales y Tecnológicas-Madrid, the University of Chicago, University College London, the DES-Brazil Consortium, the University of Edinburgh, the Eidgenössische Technische Hochschule (ETH) Zürich, Fermi National Accelerator Laboratory, the University of Illinois at Urbana-Champaign, the Institut de Ciències de l’Espai (IEEC/CSIC), the Institut de Física d’Altes Energies, Lawrence Berkeley National Laboratory, the Ludwig-Maximilians Universität München and the associated Excellence Cluster Universe, the University of Michigan, the National Optical Astronomy Observatory, the University of Nottingham, The Ohio State University, the University of Pennsylvania, the University of Portsmouth, SLAC National Accelerator Laboratory, Stanford University, the University of Sussex, Texas A&M University, and the OzDES Membership Consortium.
Based in part on observations at Cerro Tololo Inter-American Observatory, National Optical Astronomy Observatory, which is operated by the Association of Universities for Research in Astronomy (AURA) under a cooperative agreement with the National Science Foundation.
The DES data management system is supported by the National Science Foundation under Grant Numbers AST-1138766 and AST-1536171. The DES participants from Spanish institutions are partially supported by MINECO under grants AYA2015-71825, ESP2015-66861, FPA2015-68048, SEV-2016-0588, SEV-2016-0597, and MDM-2015-0509, some of which include ERDF funds from the European Union. IFAE is partially funded by the CERCA program of the Generalitat de Catalunya. AK has also been supported by a Juan de la Cierva fellowship from MINECO. Research leading to these results has received funding from the European Research Council under the European Union’s Seventh Framework Program (FP7/2007-2013) including ERC grant agreements 240672, 291329, 306478, and 615929. We acknowledge support from the Australian Research Council Centre of Excellence for All-sky Astrophysics (CAASTRO), through project number CE110001020, and the Brazilian Instituto Nacional de Ciênciae Tecnologia (INCT) e-Universe (CNPq grant 465376/2014-2).
This manuscript has been authored by Fermi Research Alliance, LLC under Contract No. DE-AC02-07CH11359 with the U.S. Department of Energy, Office of Science, Office of High Energy Physics. The United States Government retains and the publisher, by accepting the article for publication, acknowledges that the United States Government retains a non-exclusive, paid-up, irrevocable, world-wide license to publish or reproduce the published form of this manuscript, or allow others to do so, for United States Government purposes.
The authors thank the Jubilee team for providing their LRG mock data and ISW maps based on their N-body simulation that was performed on the Juropa supercomputer of the Jülich Supercomputing Centre (JSC).
This work has made use of public data from the SDSS-III collaboration. Funding for SDSS-III has been provided by the Alfred P. Sloan Foundation, the Participating Institutions, the National Science Foundation, and the U.S. Department of Energy Office of Science. The SDSS-III website is http://www.sdss3.org/.
References
- Aiola et al. (2015) Aiola S., Kosowsky A., Wang B., 2015, Phys. Rev. D, 91, 043510
- Amendola et al. (2013) Amendola L., Appleby S., Bacon D., Baker T., Baldi M., Bartolo N., Blanchard A., Bonvin C., 2013, Living Reviews in Relativity, 16, 6
- Barreira et al. (2014) Barreira A., Li B., Baugh C. M., Pascoli S., 2014, JCAP, 8, 059
- Bean & Doré (2004) Bean R., Doré O., 2004, Phys. Rev. D, 69, 083503
- Beck et al. (2018) Beck R., Csabai I., Rácz G., Szapudi I., 2018, MNRAS, 479, 3582
- Bernal et al. (2016) Bernal J. L., Verde L., Riess A. G., 2016, JCAP, 10, 019
- Cabré et al. (2007) Cabré A., Fosalba P., Gaztañaga E., Manera M., 2007, MNRAS, 381, 1347
- Cai et al. (2014) Cai Y.-C., Li B., Cole S., Frenk C. S., Neyrinck M., 2014, MNRAS, 439, 2978
- Cai et al. (2017) Cai Y.-C., Neyrinck M., Mao Q., Peacock J. A., Szapudi I., Berlind A. A., 2017, MNRAS, 466, 3364
- Cautun et al. (2018) Cautun M., Paillas E., Cai Y.-C., Bose S., Armijo J., Li B., Padilla N., 2018, MNRAS, 476, 3195
- Courtois et al. (2017) Courtois H. M., Tully R. B., Hoffman Y., Pomarède D., Graziani R., Dupuy A., 2017, ApJL, 847, L6
- Crittenden & Turok (1996) Crittenden R. G., Turok N., 1996, Physical Review Letters, 76, 575
- Cruz et al. (2005) Cruz M., Martínez-González E., Vielva P., Cayón L., 2005, MNRAS, 356, 29
- Dark Energy Survey Collaboration (2016) Dark Energy Survey Collaboration 2016, MNRAS, 460, 1270
- de Putter et al. (2010) de Putter R., Huterer D., Linder E. V., 2010, Phys. Rev. D, 81, 103513
- Eisenstein et al. (2005) Eisenstein D. J., Zehavi I., Hogg D. W., et al. 2005, ApJ, 633, 560
- Elvin-Poole et al. (2018) Elvin-Poole J., Crocce M., Ross A. J., Giannantonio T., et al. 2018, Phys. Rev. D, 98, 042006
- Finelli et al. (2015) Finelli F., García-Bellido J., Kovács A., Paci F., Szapudi I., 2015, MNRAS, 455, 1246
- Flaugher et al. (2015) Flaugher B., Diehl H. T., Honscheid K., The DES Collaboration 2015, AJ, 150, 150
- Flender et al. (2013) Flender S., Hotchkiss S., Nadathur S., 2013, JCAP, 2, 13
- Fosalba & Gaztañaga (2004) Fosalba P., Gaztañaga E., 2004, MNRAS, 350, L37
- Fosalba et al. (2003) Fosalba P., Gaztañaga E., Castander F. J., 2003, ApJL, 597, L89
- Giannantonio et al. (2012) Giannantonio T., Crittenden R., Nichol R., Ross A. J., 2012, MNRAS, 426, 2581
- Gorski et al. (2005) Gorski K. M., Hivon E., et al. 2005, ApJ, 622, 759
- Granett et al. (2015) Granett B. R., Kovács A., Hawken A. J., 2015, MNRAS, 454, 2804
- Granett et al. (2008) Granett B. R., Neyrinck M. C., Szapudi I., 2008, ApJL, 683, L99
- Hamaus et al. (2016) Hamaus N., Pisani A., Sutter P. M., Lavaux G., Escoffier S., Wandelt B. D., Weller J., 2016, Physical Review Letters, 117, 091302
- Hawken et al. (2017) Hawken A. J., Granett B. R., Iovino A., Guzzo L., Peacock J. A., de la Torre S., et al. 2017, Astronomy and Astrophysics, 607, A54
- Hernández-Monteagudo & Smith (2013) Hernández-Monteagudo C., Smith R. E., 2013, MNRAS, 435, 1094
- Hinshaw et al. (2013) Hinshaw G., Larson D., Komatsu E., et al. 2013, ApJS, 208, 19
- Ho et al. (2008) Ho S., Hirata C., Padmanabhan N., Seljak U., Bahcall N., 2008, Physical Review D, 78, 043519
- Hotchkiss et al. (2015) Hotchkiss S., Nadathur S., Gottlöber S., Iliev I. T., Knebe A., Watson W. A., Yepes G., 2015, MNRAS, 446, 1321
- Hu & Scranton (2004) Hu W., Scranton R., 2004, Phys. Rev. D, 70, 123002
- Ilić et al. (2013) Ilić S., Langer M., Douspis M., 2013, A&A, 556, A51
- Kitaura et al. (2016) Kitaura F.-S., Chuang C.-H., Liang Y., Zhao C., Tao C., Rodriguez-Torres S., Eisenstein D. J., Gil-Marin H., Kneib J.-P., McBride C., Percival W. J., Ross A. J., Sanchez A. G., Tinker J., Tojeiro R., Vargas-Magana M., Zhao G.-B., 2016, Physical Review Letters, 116, 171301
- Kovács (2018) Kovács A., 2018, MNRAS, 475, 1777
- Kovács & García-Bellido (2016) Kovács A., García-Bellido J., 2016, MNRAS, 462, 1882
- Kovács & Granett (2015) Kovács A., Granett B. R., 2015, MNRAS, 452, 1295
- Kovács et al. (2017) Kovács A., Sánchez C., García-Bellido J., the DES collaboration 2017, MNRAS, 465, 4166
- Levi et al. (2013) Levi M., Bebek C., Beers T., Blum R., Cahn R., Eisenstein D., Flaugher B., Honscheid K., Kron R., Lahav O., McDonald P., Roe N., Schlegel D., representing the DESI collaboration 2013, ArXiv e-prints: 1308.0847
- Mackenzie et al. (2017) Mackenzie R., Shanks T., Bremer M. N., Cai Y.-C., Gunawardhana M. L. P., Kovács A., Norberg P., Szapudi I., 2017, MNRAS, 470, 2328
- Marcos-Caballero et al. (2016) Marcos-Caballero A., Fernández-Cobos R., Martínez-González E., Vielva P., 2016, MNRAS, 460, L15
- Melchior et al. (2014) Melchior P., Sutter P. M., Sheldon E. S., Krause E., Wandelt B. D., 2014, MNRAS, 440, 2922
- Millea et al. (2012) Millea M., Doré O., Dudley J., Holder G., Knox L., Shaw L., Song Y.-S., Zahn O., 2012, ApJ, 746, 4
- Mota et al. (2008) Mota D. F., Shaw D. J., Silk J., 2008, ApJ, 675, 29
- Nadathur (2016) Nadathur S., 2016, MNRAS, 461, 358
- Nadathur & Crittenden (2016) Nadathur S., Crittenden R., 2016, ApJL, 830, L19
- Nadathur & Hotchkiss (2015) Nadathur S., Hotchkiss S., 2015, MNRAS, 454, 889
- Nadathur et al. (2017) Nadathur S., Hotchkiss S., Crittenden R., 2017, MNRAS, 467, 4067
- Nadathur et al. (2012) Nadathur S., Hotchkiss S., Sarkar S., 2012, JCAP, 6, 42
- Nadathur et al. (2014) Nadathur S., Lavinto M., Hotchkiss S., Räsänen S., 2014, Phys. Rev. D, 90, 103510
- Naidoo et al. (2016) Naidoo K., Benoit-Lévy A., Lahav O., 2016, MNRAS, 459, L71
- Naidoo et al. (2017) Naidoo K., Benoit-Lévy A., Lahav O., 2017, MNRAS, 472, L65
- Neyrinck (2008) Neyrinck M. C., 2008, MNRAS, 386, 2101
- Planck 2013 results. XIX. (2014) Planck 2013 results. XIX. 2014, A&A, 571, A19
- Planck 2015 results. XI. (2016) Planck 2015 results. XI. 2016, A&A, 594, A11
- Planck 2015 results. XXI. (2016) Planck 2015 results. XXI. 2016, A&A, 594, A21
- Pollina et al. (2017) Pollina G., Hamaus N., Dolag K., Weller J., Baldi M., Moscardini L., 2017, MNRAS, 469, 787
- Pollina et al. (2018) Pollina G., Hamaus N., Paech K., Dolag K., Weller J., Sánchez C., Rykoff E. S., Jain B., Abbott T. M. C., Allam S., Avila S., et al. 2018, ArXiv e-prints
- Rácz et al. (2017) Rácz G., Dobos L., Beck R., Szapudi I., Csabai I., 2017, MNRAS, 469, L1
- Rees & Sciama (1968) Rees M. J., Sciama D. W., 1968, Nature, 217, 511
- Renk et al. (2017) Renk J., Zumalacárregui M., Montanari F., Barreira A., 2017, JCAP, 10, 020
- Rozo et al. (2016) Rozo E., Rykoff E. S., Abate A., et al. 2016, MNRAS, 461, 1431
- Rykoff et al. (2014) Rykoff E. S., Rozo E., Busha M. T., et al. 2014, ApJ, 785, 104
- Sachs & Wolfe (1967) Sachs R. K., Wolfe A. M., 1967, ApJL, 147, 73
- Sánchez et al. (2017) Sánchez C., Clampitt J., Kovács A., et al. 2017, MNRAS, 465, 746
- Schwarz et al. (2016) Schwarz D. J., Copi C. J., Huterer D., Starkman G. D., 2016, Classical and Quantum Gravity, 33, 184001
- Stölzner et al. (2018) Stölzner B., Cuoco A., Lesgourgues J., Bilicki M., 2018, Phys. Rev. D, 97, 063506
- Sutter et al. (2014) Sutter P. M., Lavaux G., Hamaus N., Wandelt B. D., Weinberg D. H., Warren M. S., 2014, MNRAS, 442, 462
- Sutter et al. (2012) Sutter P. M., Lavaux G., Wandelt B. D., Weinberg D. H., 2012, ApJ, 761, 187
- Sutter et al. (2014) Sutter P. M., Lavaux G., Wandelt B. D., Weinberg D. H., Warren M. S., 2014, MNRAS, 438, 3177
- Szapudi et al. (2015) Szapudi I., Kovács A., Granett B. R., Frei Z., Silk J., Burgett W., Cole S., Draper P. W., Farrow D. J., Kaiser N., Magnier E. A., Metcalfe N., Morgan J. S., Price P., Tonry J., Wainscoat R., 2015, MNRAS, 450, 288
- The Dark Energy Survey Collaboration (2005) The Dark Energy Survey Collaboration 2005, arXiv:astro-ph/0510346
- Watson et al. (2014) Watson W. A., Diego J. M., Gottlöber S., Iliev I. T., Knebe A., Martínez-González E., Yepes G., Barreiro R. B., González-Nuevo J., Hotchkiss S., Marcos-Caballero A., Nadathur S., Vielva P., 2014, MNRAS, 438, 412
- Weller & Lewis (2003) Weller J., Lewis A. M., 2003, MNRAS, 346, 987
Affiliations
1 Institut de Física d’Altes Energies (IFAE), The Barcelona Institute of Science and Technology, Campus UAB, 08193 Bellaterra (Barcelona), Spain
2 Instituto de Astrofísica de Canarias (IAC), Calle Vía Láctea, E-38200, La Laguna, Tenerife, Spain;
Departamento de Astrofísica, Universidad de La Laguna (ULL), E-38206, La Laguna, Tenerife, Spain
3 Department of Physics and Astronomy, University of Pennsylvania, Philadelphia, PA 19104, USA
4 Instituto de Física Teórica IFT-UAM/CSIC, Universidad Autónoma de Madrid, Cantoblanco 28049 Madrid, Spain
5 Jodrell Bank Center for Astrophysics, School of Physics and Astronomy,
University of Manchester, Oxford Road, Manchester, M13 9PL, UK
6 Universitäts-Sternwarte, Fakultät für Physik, Ludwig-Maximilians Universität München, Scheinerstr. 1, 81679 München, Germany
7 Department of Astronomy/Steward Observatory, 933 North Cherry Avenue, Tucson, AZ 85721-0065, USA
8 Institute of Cosmology & Gravitation, University of Portsmouth, Portsmouth, PO1 3FX, UK
9 Cerro Tololo Inter-American Observatory, National Optical Astronomy Observatory, Casilla 603, La Serena, Chile
10 Department of Physics & Astronomy, University College London, Gower Street, London, WC1E 6BT, UK
11 Fermi National Accelerator Laboratory, P. O. Box 500, Batavia, IL 60510, USA
12 Kavli Institute for Particle Astrophysics & Cosmology, P. O. Box 2450, Stanford University, Stanford, CA 94305, USA
13 SLAC National Accelerator Laboratory, Menlo Park, CA 94025, USA
14 CNRS, UMR 7095, Institut d’Astrophysique de Paris, F-75014, Paris, France
15 Sorbonne Universités, UPMC Univ Paris 06, UMR 7095, Institut d’Astrophysique de Paris, F-75014, Paris, France
16 Centro de Investigaciones Energéticas, Medioambientales y Tecnológicas (CIEMAT), Madrid, Spain
17 Laboratório Interinstitucional de e-Astronomia - LIneA, Rua Gal. José Cristino 77, Rio de Janeiro, RJ - 20921-400, Brazil
18 Department of Astronomy, University of Illinois, 1002 W. Green Street, Urbana, IL 61801, USA
19 National Center for Supercomputing Applications, 1205 West Clark St., Urbana, IL 61801, USA
20 Physics Department, 2320 Chamberlin Hall, University of Wisconsin-Madison, 1150 University Avenue Madison, WI 53706-1390
21 Institut de Ciències de l’Espai, IEEC-CSIC, Campus UAB, Carrer de Can Magrans, s/n, 08193 Bellaterra, Barcelona, Spain
22 Observatório Nacional, Rua Gal. José Cristino 77, Rio de Janeiro, RJ - 20921-400, Brazil
23 George P. and Cynthia Woods Mitchell Institute for Fundamental Physics and Astronomy, and Department of Physics and Astronomy, Texas A&M University, College Station, TX 77843, USA
24 Department of Physics, IIT Hyderabad, Kandi, Telangana 502285, India
25 Department of Physics, University of Michigan, Ann Arbor, MI 48109, USA
26 Department of Physics, ETH Zurich, Wolfgang-Pauli-Strasse 16, CH-8093 Zurich, Switzerland
27 Santa Cruz Institute for Particle Physics, Santa Cruz, CA 95064, USA
28 Center for Cosmology and Astro-Particle Physics, The Ohio State University, Columbus, OH 43210, USA
29 Department of Physics, The Ohio State University, Columbus, OH 43210, USA
30 Max Planck Institute for Extraterrestrial Physics, Giessenbachstrasse, 85748 Garching, Germany
31 Harvard-Smithsonian Center for Astrophysics, Cambridge, MA 02138, USA
32 Australian Astronomical Observatory, North Ryde, NSW 2113, Australia
33 Departamento de Física Matemática, Instituto de Física, Universidade de São Paulo, CP 66318, São Paulo, SP, 05314-970, Brazil
34 Department of Astrophysical Sciences, Princeton University, Peyton Hall, Princeton, NJ 08544, USA
35 Department of Astronomy, University of Michigan, Ann Arbor, MI 48109, USA
36 Institució Catalana de Recerca i Estudis Avançats, E-08010 Barcelona, Spain
37 Excellence Cluster Universe, Boltzmannstr. 2, 85748 Garching, Germany
38 Jet Propulsion Laboratory, California Institute of Technology, 4800 Oak Grove Dr., Pasadena, CA 91109, USA
39 Department of Physics and Astronomy, Pevensey Building, University of Sussex, Brighton, BN1 9QH, UK
40 School of Physics and Astronomy, University of Southampton, Southampton, SO17 1BJ, UK
41 Brandeis University, Physics Department, 415 South Street, Waltham MA 02453
42 Instituto de Física Gleb Wataghin, Universidade Estadual de Campinas, 13083-859, Campinas, SP, Brazil
43 Computer Science and Mathematics Division, Oak Ridge National Laboratory, Oak Ridge, TN 37831
44 Argonne National Laboratory, 9700 South Cass Avenue, Lemont, IL 60439, USA