The Birth of A Coronal Mass Ejection
Abstract
The Sun’s atmosphere is frequently disrupted by coronal mass ejections (CMEs), coupled with flares and energetic particles. In the standard picture, the coupling is explained by magnetic reconnection at a vertical current sheet connecting the flare loops and the CME, with the latter embedding a helical magnetic structure known as flux rope. As it jumps upward due to instabilities or loss of equilibrium, the flux rope stretches the overlying coronal loops so that oppositely directed field is brought together underneath, creating the current sheet. However, both the origin of flux ropes and their nascent paths toward eruption remain elusive. Here we present an observation of how a stellar-sized CME bubble evolves continuously from plasmoids, mini flux ropes that are barely resolved, within half an hour. The eruption initiates when plasmoids springing from a vertical current sheet merge into a leading plasmoid occupying the upper tip of the current sheet. Rising at increasing speed to stretch the overlying loops, this leading plasmoid then expands impulsively into the CME bubble, in tandem with hard X-ray bursts. This observation illuminates for the first time a complete CME evolutionary path that has the capacity to accommodate a wide variety of plasma phenomena by bridging the gap between micro-scale dynamics and macro-scale activities.
-
1
CAS Key Laboratory of Geospace Environment, Department of Geophysics and Planetary Sciences, University of Science and Technology of China, Hefei 230026, China; rliu@ustc.edu.cn
-
2
Institute of Physics/IGAM & Kanzelhöhe Observatory, University of Graz, Universitätsplatz 5, 8010 Graz, Austria
-
3
Institute of Physics and Astronomy, University of Potsdam, 14476 Potsdam, Germany; bkliem@uni-potsdam.de
-
4
Mullard Space Science Laboratory, University College London, Holmbury St. Mary, Dorking, Surrey RH5 6NT, UK
-
5
Synergetic Innovation Center of Quantum Information & Quantum Physics, University of Science and Technology of China, Hefei 230026, China
Introduction
The eruptions in the solar atmosphere exhibit distinctly diverse patterns across a vast range of spatio-temporal scales, from coronal mass ejections (CMEs) in the shape of stellar-sized bubbles, to localized flares within active regions harboring sunspots, to collimated jets down to the resolution limit of modern telescopes. Fifty years of studies on flares and CMEs have converged to a standard picture: a flux rope is destabilized and a current sheet develops underneath (1), where successive magnetic reconnections add layers of plasma and magnetic flux to the snowballing CME bubble and simultaneously produce flare loops beneath the current sheet (2, 3). However, the flux rope’s origin remains elusive. It has long been debated whether the flux rope forms in a magnetically sheared arcade during the course of the eruption (4, 5), or, exists before eruption resulting either from a sub-photospheric rope emerging into the corona (6, 7) or from reconnection between coronal field lines (8, 9) driven by the gradually evolving photosphere (10). It is also debated how the eruption initiates (11), whether it is triggered by reconnection below or above the flux rope or by MHD instabilities (12). To discriminate models with observations turns out extremely difficult due to the rapid development of eruptive structures, which is convoluted by the line-of-sight confusion in the optically thin corona and the projection effects of three-dimensional structures.
Recent observation and modeling suggest that a similar mechanism involving a mini flux rope works for jets on much smaller scales (13, 14). Moreover, theoretical progress in magnetic reconnection has demonstrated an inherently time-dependent, bursty picture of the current sheet to be characteristic of high-Reynolds-number plasmas (15, 16). Mini flux ropes, also termed plasmoids, are continuously formed and ejected in a hierarchical, fractal-like fashion, which not only influences the reconnection rate but also enhances the particle acceleration efficiency in a Fermi-like process (17, 18). Thus, flux ropes are key to understanding the diverse eruptive phenomena, but is there any physical connection between flux ropes involved in micro-scale dynamics and those in global-scale activities?
Results
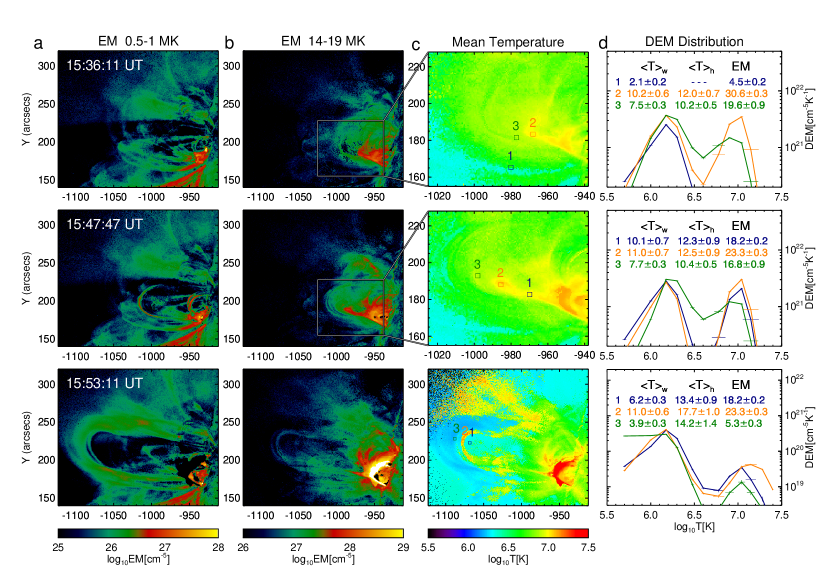
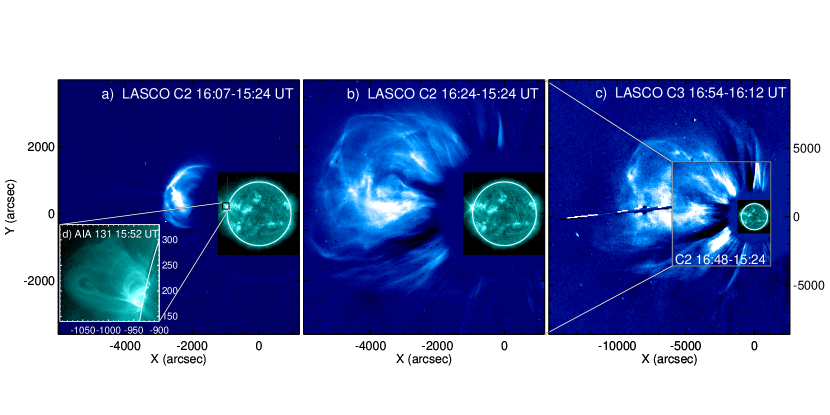
Here we present observations of how a CME (1011 cm; Figure S1) builds up from a seed that forms via the coalescence of multiple plasmoids (108 cm). The eruption occurs at the northeast solar limb at about 15:50 UT on 2013 May 13, producing an energetic X2.8-class flare and a fast, full-halo CME propagating at 1800 km s-1 in the outer corona. The flare is observed in EUV by the Atmospheric Imaging Assembly (AIA (19); Methods) onboard the Solar Dynamics Observatory (SDO) and in hard X-rays (HXRs) by the Reuven Ramaty High-Energy Solar Spectroscopic Imager (RHESSI (20)) and by the Gamma-ray Burst Monitor (GBM) onboard the Fermi Gamma-ray Space Telescope. AIA’s six EUV passbands have distinctive temperature responses and cover a wide temperature range [0.5–30 MK], which allows us to reconstruct the temperature distribution of plasma emitting along the line of sight, known as differential emission measure (DEM; Methods). HXR characteristics during the impulsive phase of this flare has been studied in detail by (21). In the following, we analyze multi-wavelength observations to understand the initiation of the CME and its connection with magnetic reconnection and particle acceleration.
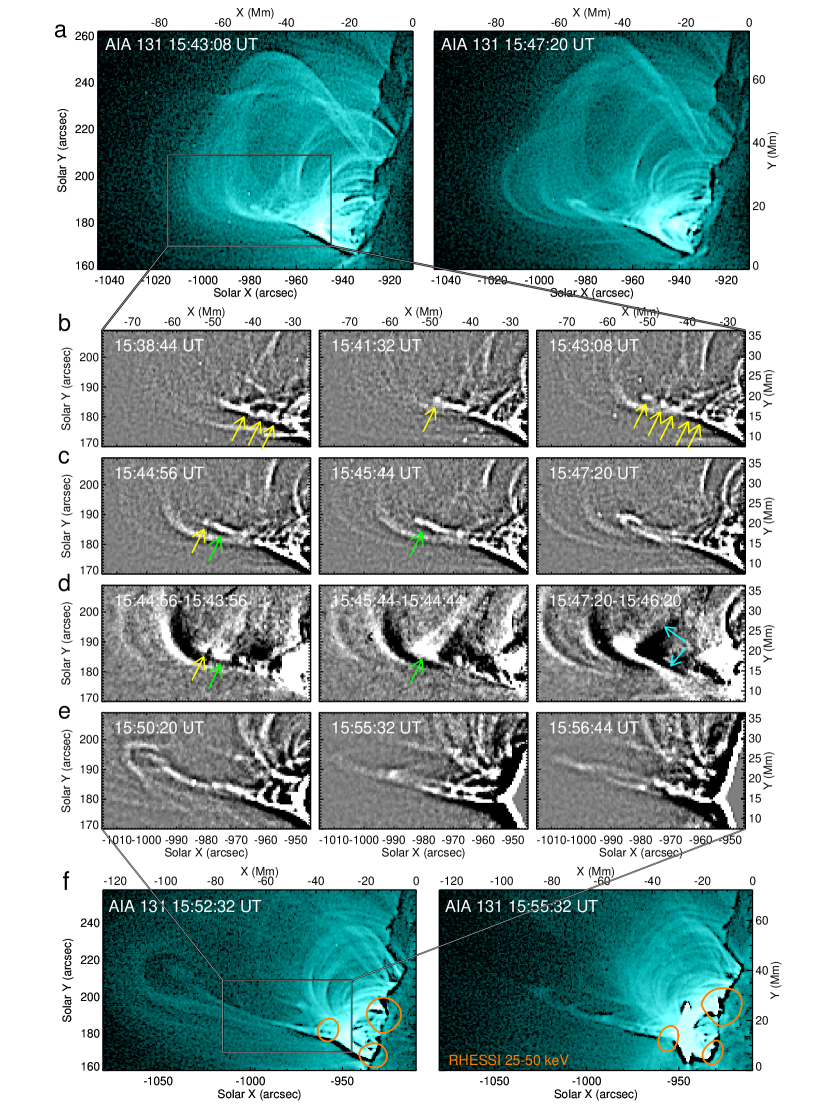
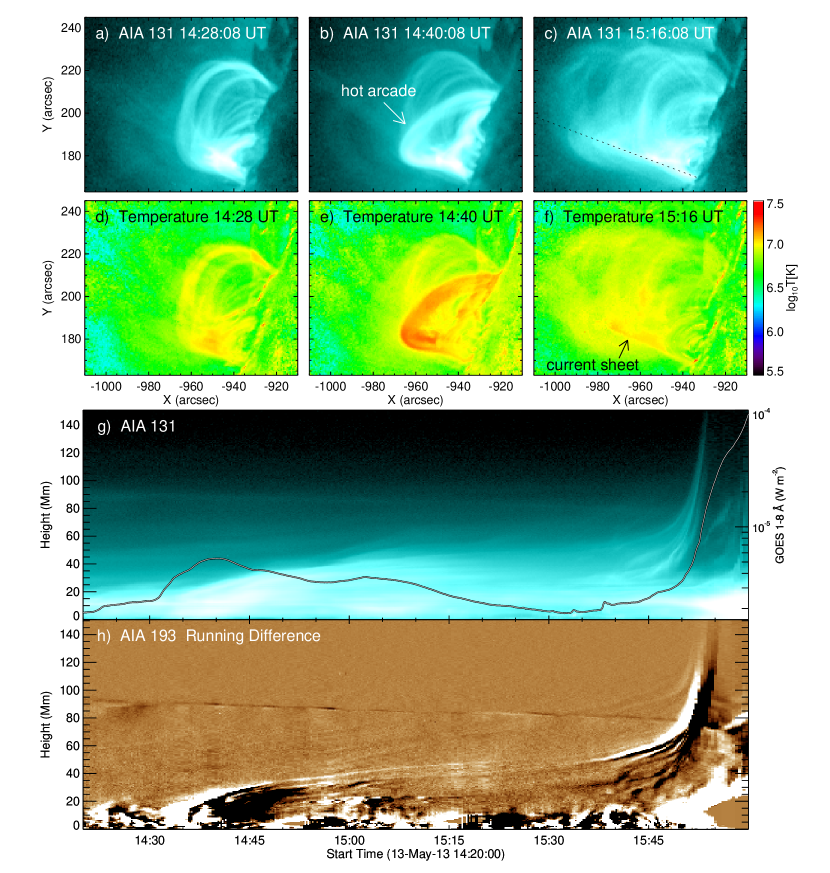
The eruption results in a typical white-light CME with a diffuse outfront and a bright inner core (Figure S1). The core bears similarity to the eruptive structure observed in the inner corona in EUV: a hollow ellipsoid connected to the top of flare loops by an extended linear feature of width 2′′ during the impulsive phase of the flare (Figure 1f). The ellipsoid is only visible in AIA’s hot passbands: best in 131 Å (Fe XXI and XXIII), fairly in 94 Å (Fe XVIII), and marginally in 335 Å (Fe XVI; Supplementary Movie 2). The linear feature is exclusively visible in 131 Å (Figure 1) and emits at 10 MK as confirmed by the DEM analysis (Figure 2; Supplementary Movie 3). The ellipsoid also has a hot outer shell, though slightly cooler than the current sheet. Both the morphological and thermodynamic features fully agree with the standard model, in which hot plasma is expected to emit not only at the vertical current sheet and the flare loops, but in the outermost layer of the flux rope, where the magnetic field is newly reconnected (2, 3), while the inner layers of plasma have cooled. Thus, the ellipsoid is identified as the flux rope and the linear feature as the vertical current sheet, similar to previous studies (22, 23, 24, 25, 26).
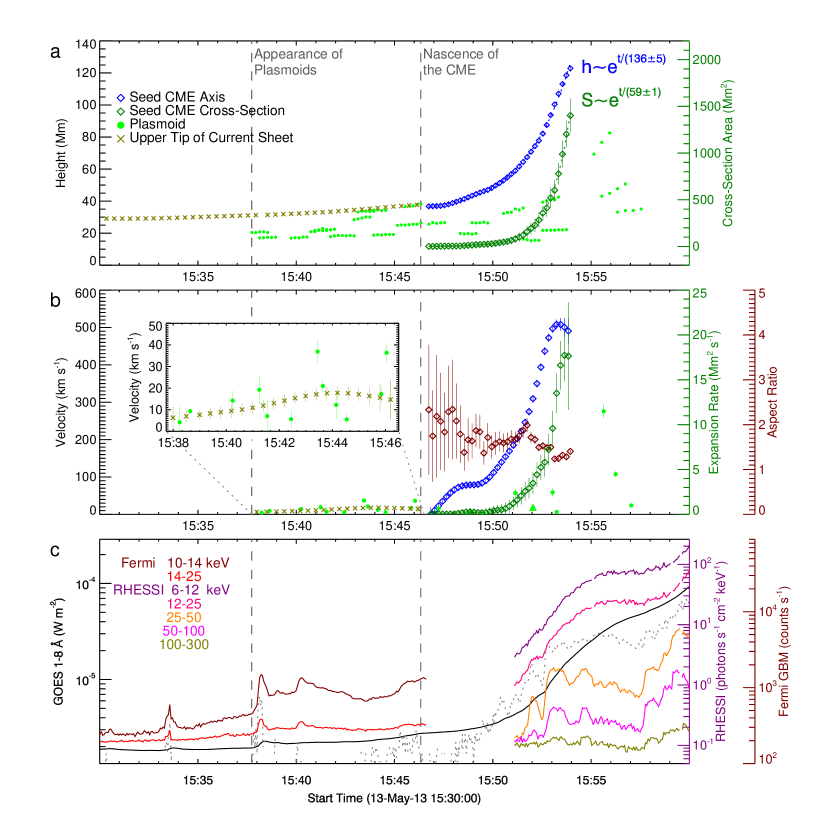
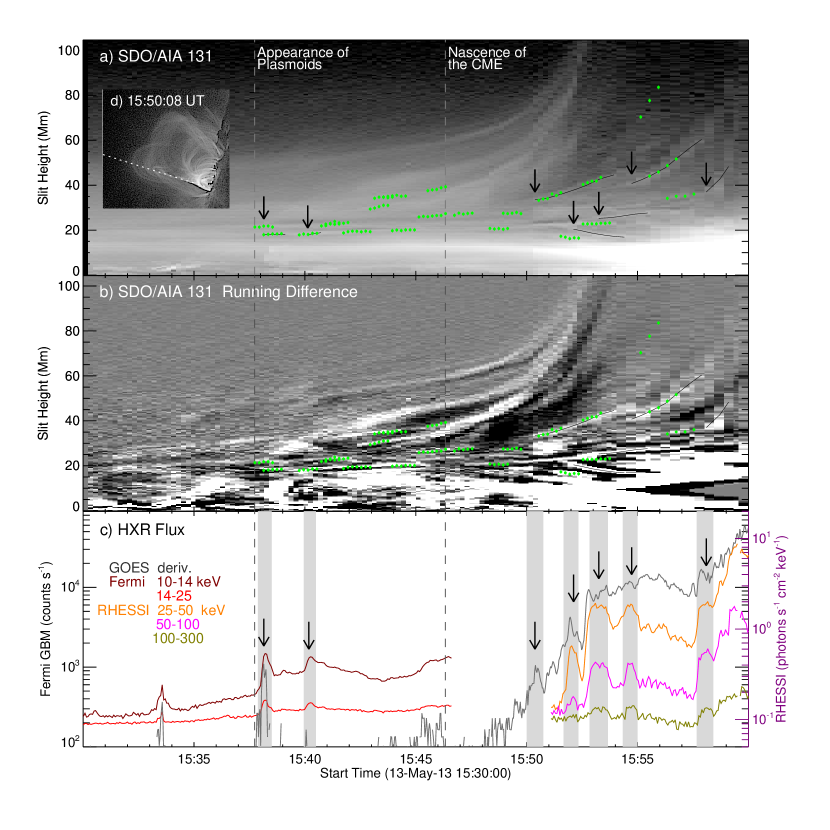
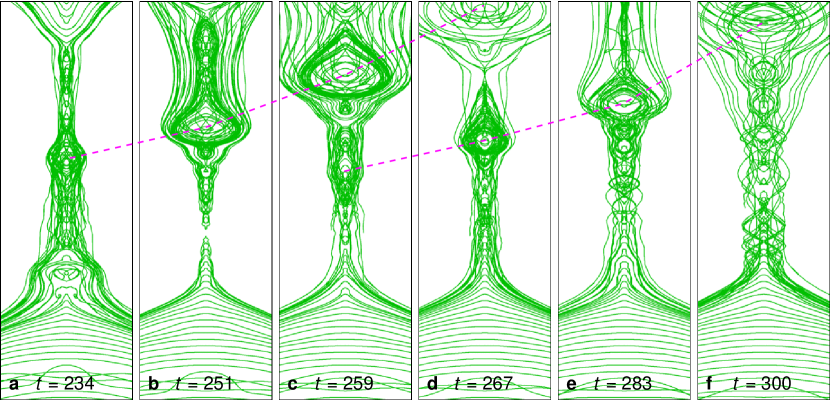
However, in the present case, the current sheet is not only present during the impulsive phase of the eruption, but evolves continuously from a shorter one visible already before the eruption. This pre-eruption current sheet is located immediately above an arcade of post-flare loops (Figure 1a), the remnant of a confined C5.3-class flare at 13:55 UT (Supplementary Notes). With similar temperatures as high as 10 MK (Figure 2[c,d]), both the post-flare arcade and the current sheet are located beneath a magnetically sheared arcade (Supplementary Notes; Supplementary Movie 4). This is inferred by performing stereoscopic triangulation on a low-lying flare loop and a high-lying coronal loop already stretched by the rising flux rope (Figure S3; Methods). As it extends upward slowly at 10 km s-1 (Figure 3b), the current sheet is fragmented into multiple plasmoids of widths 2′′ from about 15:38 UT onward (Figure 1b). With plasmoids showing up, Fermi GBM detects HXR bursts in 10–14 and 14–25 keV (Figure 3c). At 15:41:32 UT, a leading plasmoid occupies the upper tip of the current sheet (Figure 1b). Underneath, a chain of at least four other plasmoids appear at 15:43:08 UT. Along the current sheet, the following plasmoids often move faster than (inset of Figure 3b), and merge with, the leading plasmoid (Figure 1c; Supplementary Movie 1). Two successive episodes of plasmoid coalescence can be seen at 15:44:56 UT and 15:45:44 UT (Figure 1[c,d]). This dynamic behavior is well established in numerical simulations (Methods; Figure LABEL:fig:plasmoids). As a result of plasmoid coalescence, from 15:47:20 UT onward, the current sheet is led by a larger plasmoid of width 4′′, an ellipsoid characterized by hot plasma of 14–19 MK (Figure 2b, Supplementary Movie 3) .
We interpret this ellipsoid as a ‘seed’ flux rope because it continuously expands, eventually ballooning into the CME bubble, and while expanding it keeps a coherent shape, i.e., a hollow ellipsoid in AIA 131 Å with an aspect ratio of about 1.5 (Figure 3b). In the difference images that highlight the dynamic features, this seed flux rope exhibits two legs connecting to the surface, revealing its three-dimensional nature (Figure 1d; Supplementary Movie 1). In contrast, the so-called plasma blobs reported previously are seemingly isolated features in current sheets observed in EUV images (25, 26, 27) or in white-light coronagraphs (22, Liu2010). This difference is probably due to instrumental resolution and sensitivity, because the present seed flux rope is apparently the largest plasmoid ever reported in EUV.
While expanding, the flux rope becomes a hollow ellipsoid, i.e., depressed in 131 Å emission in its center, but as a whole it becomes a dark ‘cavity’ in cool passbands such as 171 Å (Figure 4 and Supplementary Movie 2). The absence of plasma emission inside the rope is well expected for a twofold reason: first, these plasmas are brought into the rope by earlier reconnections at the current sheet, and have since cooled down via conduction, radiation, and expansion, while the hot ‘rim’ is produced by the most recent reconnections; second, the dominant magnetic pressure inside the rope tends to squeeze out plasma, so that the total pressure, magnetic plus plasma pressure, is balanced with the surroundings.
As soon as it forms at about 15:47 UT, the seed flux rope starts to rise at a speed of tens of kilometers per second (Figure 3). Initially increasing with time at 1 km s-2, the rising speed temporarily plateaus at about 15:49 UT at 80 km s-1, short of the sound speed in the corona. From about 15:50 UT, the speed quickly increases at 2.5 km s-2 and reaches at about 15:53 UT a peak velocity of 530 km s-1, comparable to the Alfvén speed in the inner corona. Plasmoids still appear intermittently in the current sheet at this stage (Figures 1 and 3, Supplementary Movie 1), and they generally have larger sizes than in the early stage and move at faster speeds ranging from tens km s-1 up to 300 km s-1. In tandem with the enhanced acceleration, the rope’s cross-section area expands exponentially from 15:50 UT onward (Figure 3a), which is associated with a rapid increase in SXR and HXR fluxes, suggesting an increase in reconnection rate, which might be induced by plasmoid ejection (28, 15). The HXRs in the nonthermal range ( keV) emit with intermittent, spiky profiles (Figure 3c), which is generally taken as a signature of the reconnection-related electric field that rapidly varies with time and/or space (29), therefore modulating the particle acceleration.
Meanwhile, the expanding and rising flux rope starts to stretch and compress the overlying loops (Figure S2), which are visible both in 131 Å due to the Fe VIII line blend and in cooler passbands, namely, AIA 171, 193 and 211 Å (Figure 2, Supplementary Movie 2). The legs of these loops are first stretched longer and longer, and then, as the flux rope expands, their top part becomes wider than the lower part, exhibiting an shape (Figure 4). At 15:53 UT when the rope’s rising speed peaks over 500 km s-1, such an -shaped, thin layer appears in the EM map of hot plasma (14–19 MK) as well as the map of mean temperature (Figure 2, Supplementary Movie 3), apparently separating the overlying loops from the flux rope. Detailed DEM analysis (Methods; Figure 2d) shows that it is significantly hotter and denser than both the overlying loops and the flux rope, and hence interpreted as a quasi-separatrix layer (QSL) that wraps around the flux rope to separate the twisted from untwisted field (30). A flux rope’s QSL boundary is known as a preferential site for current concentration (31). On the solar surface, this would correspond to the boundary of the rope’s feet, which has recently been observed as a pair of irregular bright rings expanding from points during the flare impulsive phase (32), indicating a flux-rope formation process similar as reported here. Plasma compression is conducive to current steepening and dissipation in this QSL, which explains the elevated temperature and density.
Discussion
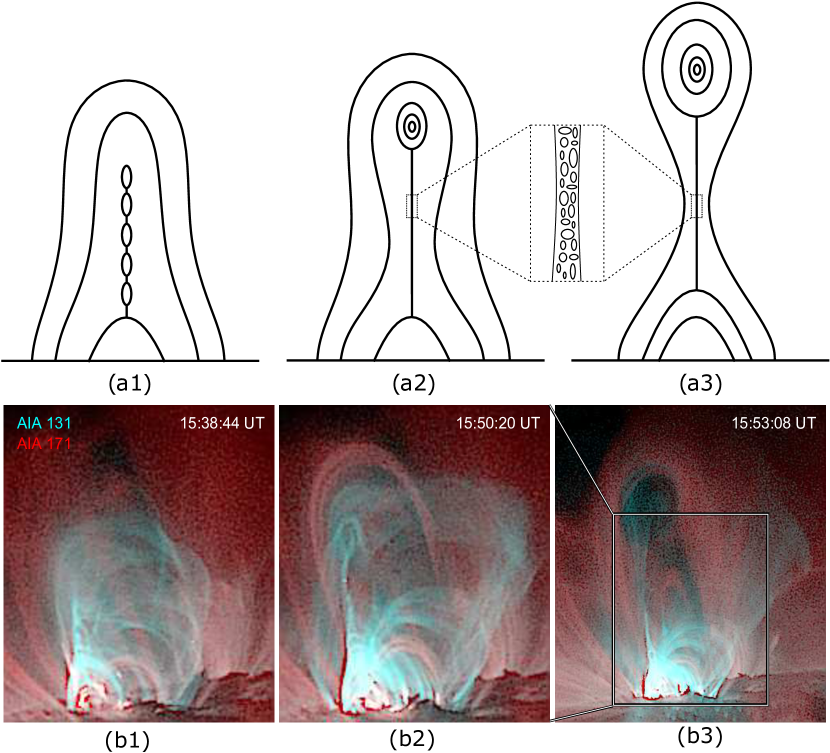
Illustrated and matched by observations in Figure 4 is the process of the CME eruption in a two-dimensional cross section: Initially a vertical current sheet exists underneath a magnetically sheared arcade (see Supplementary Notes for its formation). The current sheet extends as magnetic energy builds up slowly in the corona and breaks up into plasmoids when its length exceeds the critical wavelength for the tearing-mode instability (33) (Figure 4(a1)). In three dimensions, this corresponds to the transformation of sheared into twisted field lines via magnetic reconnection (9, 34). The plasmoids are then propelled to move along the current sheet by the magnetic tension force, while neighboring plasmoids merge into larger ones due to the coalescence instability (35).
Upward moving plasmoids eventually merge with the leading plasmoid at the upper tip of the current sheet. A coherent flux rope hence starts to form (Figure 4(a2)). Because of its hoop force (36) and the upward reconnection outflows, the rope keeps rising, stretching the overlying field and driving faster plasma inflow into the current sheet, owing to the conservation of mass, therefore thinning the current sheet and enhancing the reconnection rate. Overlying field is now reconnecting at the current sheet, adding magnetic flux to the flux rope (Figure 4(a3)); more flux makes the rope rise faster, which in turn leads to faster reconnection rate. At this point, a positive feedback is established (3, 37), and
the flux rope can grow into a runaway CME bubble. The close coupling between the flux-rope eruption and particle acceleration strongly suggests that while the plasmoids are building up into the CME, they are simultaneously cascading into smaller and smaller scales (illustrated by the inset of Figure 4(a2 and a3)) in a fractal fashion down to ion and electron kinetic scales at which the energetic particles are actually accelerated (15, 16). The observed plasmoids at a meso-scale of 108 cm thus bridge the macro- (1011 cm) and micro-scale (104 cm) flux ropes across a hierarchical spectrum.
If the overlying constraining field is strong enough, then the eruption can be confined, which is also termed failed eruption (38, 36, 39). In that case, the flux rope may temporarily settle down, and the bottom of its helical field lines can support a prominence made of relatively cool and dense plasma (40). However, as the current sheet continues to spawn plasmoids and the plasmoids continue to merge into the flux rope, the accumulated flux in the rope may eventually reach the tipping point of eruption (41). Further, whenever open field is accessible to the plasmoids, a jet ensues instead of a CME (42, 13, 14).
Methods
SDO Data and DEM Analysis
SDO/AIA provides full-disk observations of the Sun at high spatial () and temporal (12s) resolution around the clock. AIA’s six EUV passbands, i.e., 131 Å (Fe XXI for flare, peak response temperature ; Fe VIII for AR, (43)), 94 Å (Fe XVIII, ), 335 Å (Fe XVI, ), 211 Å (Fe XIV, ), 193 Å (Fe XXIV for flare, ; Fe XII for AR, ), and 171 Å (Fe IX, ), are used to calculate the differential emission measure (DEM), which characterizes the amount of optically thin plasma at a specific temperature along the line of sight. We adopted the regularized inversion code developed by Hannah&Kontar (44) and considered the DEM solutions of relative uncertainties 30% with temperature bins . The emission measure (EM) is obtained by integrating DEMs over the temperature ranges and the DEM-weighted mean temperature is calculated by . To characterize flaring plasma, we calculated for temperatures above 4 MK () besides which employs the whole temperature range, considering that plasma below 4 MK is mainly contributed by the background corona (45).
Unsharp Masking
We applied unsharp masking to SDO/AIA 131 Å images to highlight fine structures like plasmoids. First, one generates a pseudo background by smoothing the original image with a box-car, and then obtains the unsharp masked image, the residual of subtracting the background from the original, or the enhanced image by adding the original by a factor back to the residual. We adopted a smoothing window of pixels () for the early stage evolution (15:30–15:50 UT) and pixels later on for optimal effects.
Kinematics of Plasmoids and Flux Rope
We visually identified plasmoids that persist over a few frames in a series of AIA 131 Å unsharp masked images, obtained their projected heights above the solar limb, assuming an measurement error of 2 pixels (), and estimated the speed by linearly fitting the time-height profile of each plasmoid (Figure 3). Similarly we obtained the time-height profile of the current sheet tip and because of its smooth, continuous extending we derived the speed by numerical derivatives using the IDL procedure DERIV.pro.
We fitted the expanding hollow ellipsoid in AIA 131 Å by an ellipse, assigning a conservative 4 pixels for the uncertainties of the fitting parameters, i.e., the center and the two semi-axes. We considered the center as the axis of the flux rope, and derived the rising speed of the axis and the expanding rate of the ellipse area by numerical derivatives.
We have also constructed time-distance diagrams by taking slices off the original or running-difference images oriented along the current sheet (dotted line in the inset of Figure S2a) and then stacking them up chronologically. Structures moving along the slit leave clear tracks on these diagrams.
3D Perspective of the Eruption
The active region of interest, NOAA AR 11748, is located on the disk as seen from the “Behind” satellite of the Solar Terrestrial Relations Observatory (STEREO-B) (46), which is about 141.6∘ behind Earth on its ecliptic orbit on 13 May 2013. The 195 Å channel of the Extreme Ultraviolet Imager (EUVI) onboard STEREO has a similar temperature response as SDO/AIA 193 Å, which allows us to perform stereoscopic triangulation on a low-lying flare loop and a high-lying coronal loop already stretched by the rising flux rope at 15:46 UT (Figure S3(a and b)). With their true heights being recovered, the reconstructed loops are projected above a photospheric Bz map observed taken 6 days later when the active region is located near the disk center (Figure S3(c)). One can see that both the flare loop and the overlying loop are highly sheared with respect to the polarity inversion line, which is mostly east-west oriented. The space in between is supposedly occupied by the flux rope (c.f. Figure 4(b2)). Both loops are anchored in the vicinity of conjugate coronal dimmings in EUVI 195 Å (Figure S3(d)), where coronal mass escapes along the CME field into the interplanetary space, therefore mapping the CME footpoints.
Plasmoid dynamics in CME current sheet
We have studied the formation and dynamics of multiple plasmoids in a CME simulation which provides a realistic 3D setting for these processes, previously realized only in ref(47), where the formation of multiple plasmoids was also found but their coalescence was not studied. Our simulation is very similar to a less resolved simulation in (48) (see their Figure 7), here with a slightly higher growth rate of the initial torus-unstable flux rope equilibrium (49). Upon erupting, the flux rope spawns a vertical current sheet as in the standard model (2) and sets up the inflows into the current sheet. These initiate the reconnection which is allowed by the numerical diffusion of the field in the ideal MHD simulation. Careful comparison of such simulations with well-observed solar eruptions has shown that they reproduce the observed overall reconnection rate quite accurately, within a factor of two (50, 51), because the reconnection in these events is driven by the large-scale flux rope instability, whose flows regulate the reconnection rate. When the current sheet has lengthened to an aspect ratio of , multiple X- and O-lines begin to form. These always immediately tend to merge into larger O-type structures, like plasmoids, which here are small seed flux ropes extending up to current sheet half widths in the horizontal (current) direction. At most times, there are several such 3D plasmoids of different size in the current sheet. All of them are eventually ejected with the large-scale reconnection outflow, either upward into the erupted flux rope, which is topologically equivalent to the merging of the observed plasmoids with the leading one, or downward into the growing flare loop arcade. Dynamic plasmoids are seen as long as the run is continued, see Figure S4 and Supplementary Movie 5. The simulation reveals dynamic plasmoids, basically similar to the behavior seen in many 2D simulations, when the current sheet is long enough (16). Therefore, we expect the same behavior in a vertical current sheet formed prior to the onset of eruption and more slowly driven by a photospheric process as expected for the present event, once the current sheet has reached a sufficient height, i.e., aspect ratio. This, however, remains to be verified by a future simulation study.
References
- (1) Z. Svestka, E. W. Cliver, IAU Colloq. 133: Eruptive Solar Flares, Z. Svestka, B. V. Jackson, M. E. Machado, eds. (1992), vol. 399 of Lecture Notes in Physics, Berlin Springer Verlag, p. 1.
- (2) J. Lin, T. G. Forbes, J. Geophys. Res. 105, 2375 (2000).
- (3) J. Lin, J. C. Raymond, A. A. van Ballegooijen, Astrophys. J. 602, 422 (2004).
- (4) S. K. Antiochos, C. R. DeVore, J. A. Klimchuk, Astrophys. J. 510, 485 (1999).
- (5) J. T. Karpen, S. K. Antiochos, C. R. DeVore, Astrophys. J. 760, 81 (2012).
- (6) Y. Fan, Astrophys. J. 697, 1529 (2009).
- (7) V. Archontis, A. W. Hood, Astron. Astrophys. 537, A62 (2012).
- (8) A. A. van Ballegooijen, P. C. H. Martens, Astrophys. J. 343, 971 (1989).
- (9) R. L. Moore, A. C. Sterling, H. S. Hudson, J. R. Lemen, Astrophys. J. 552, 833 (2001).
- (10) T. Amari, A. Canou, J.-J. Aly, Nature 514, 465 (2014).
- (11) T. G. Forbes, et al., Space Sci. Rev. 123, 251 (2006).
- (12) R. L. Moore, A. C. Sterling, Solar Eruptions and Energetic Particles, N. Gopalswamy, R. Mewaldt, J. Torsti, eds. (American Geophysical Union, 2006), vol. 165 of Geophysical Monograph Series, p. 43.
- (13) A. C. Sterling, R. L. Moore, D. A. Falconer, M. Adams, Nature 523, 437 (2015).
- (14) P. F. Wyper, S. K. Antiochos, C. R. DeVore, Nature 544, 452 (2017).
- (15) K. Shibata, S. Tanuma, Earth, Planets, and Space 53, 473 (2001).
- (16) N. F. Loureiro, D. A. Uzdensky, Plasma Physics and Controlled Fusion 58, 014021 (2016).
- (17) J. F. Drake, M. Swisdak, H. Che, M. A. Shay, Nature 443, 553 (2006).
- (18) N. Nishizuka, K. Shibata, Physical Review Letters 110, 051101 (2013).
- (19) J. R. Lemen, et al., Solar Phys. 275, 17 (2012).
- (20) R. P. Lin, et al., Solar Phys. 210, 3 (2002).
- (21) T. Gou, A. M. Veronig, E. C. Dickson, A. Hernandez-Perez, R. Liu, Astrophys. J. Lett. 845, L1 (2017).
- (22) J. Lin, et al., Astrophys. J. 622, 1251 (2005).
- (23) R. Liu, et al., Astrophys. J. Lett. 723, L28 (2010).
- (24) S. L. Savage, D. E. McKenzie, K. K. Reeves, T. G. Forbes, D. W. Longcope, Astrophys. J. 722, 329 (2010).
- (25) R. Liu, Mon. Not. Roy. Astron. Soc. 434, 1309 (2013).
- (26) C. Zhu, R. Liu, D. Alexander, X. Sun, R. T. J. McAteer, Astrophys. J. 813, 60 (2015).
- (27) S. Takasao, A. Asai, H. Isobe, K. Shibata, Astrophys. J. 828, 103 (2016).
- (28) J. Schumacher, B. Kliem, Physics of Plasmas 3, 4703 (1996).
- (29) B. Kliem, M. Karlický, A. O. Benz, Astron. Astrophys. 360, 715 (2000).
- (30) R. Liu, et al., Astrophys. J. 818, 148 (2016).
- (31) P. Démoulin, Advances in Space Research 37, 1269 (2006).
- (32) W. Wang, et al., Nature Communications 8, 1330 (2017).
- (33) H. P. Furth, J. Killeen, M. N. Rosenbluth, Physics of Fluids 6, 459 (1963).
- (34) R. Liu, C. Liu, S. Wang, N. Deng, H. Wang, Astrophys. J. Lett. 725, L84 (2010).
- (35) P. L. Pritchett, C. C. Wu, Physics of Fluids 22, 2140 (1979).
- (36) B. Kliem, T. Török, Physical Review Letters 96, 255002 (2006).
- (37) M. Temmer, A. M. Veronig, E. P. Kontar, S. Krucker, B. Vršnak, Astrophys. J. 712, 1410 (2010).
- (38) T. Török, B. Kliem, Astrophys. J. Lett. 630, L97 (2005).
- (39) T. Amari, A. Canou, J.-J. Aly, F. Delyon, F. Alauzet, Nature 554, 211 (2018).
- (40) D. Mackay, J. Karpen, J. Ballester, B. Schmieder, G. Aulanier, Space Science Reviews 151, 333 (2010).
- (41) Q. Zhang, et al., The Astrophysical Journal 789, 133 (2014).
- (42) K. Shibata, Astrophys. Space Sci. 264, 129 (1999).
- (43) B. O’Dwyer, G. Del Zanna, H. E. Mason, M. A. Weber, D. Tripathi, Astron. Astrophys. 521, A21 (2010).
- (44) I. G. Hannah, E. P. Kontar, Astron. Astrophys. 539, A146 (2012).
- (45) T. Gou, R. Liu, Y. Wang, Solar Phys. 290, 2211 (2015).
- (46) M. L. Kaiser, et al., Space Sci. Rev. 136, 5 (2008).
- (47) K. Nishida, N. Nishizuka, K. Shibata, Astrophys. J. Lett. 775, L39 (2013).
- (48) C. J. Schrijver, C. Elmore, B. Kliem, T. Török, A. M. Title, Astrophys. J. 674, 586 (2008).
- (49) V. S. Titov, P. Démoulin, Astron. Astrophys. 351, 707 (1999).
- (50) B. Kliem, Y. N. Su, A. A. van Ballegooijen, E. E. DeLuca, Astrophys. J. 779, 129 (2013).
- (51) A. Hassanin, B. Kliem, Astrophys. J. 832, 106 (2016).
- (52) W. M. Neupert, Astrophys. J. Lett. 153, L59 (1968).
- (53) E. N. Parker, Astrophys. J. 330, 474 (1988).
- (54) J. Heyvaerts, E. R. Priest, D. M. Rust, Astrophys. J. 216, 123 (1977).
- (55) E. R. Priest, C. E. Parnell, S. F. Martin, Astrophys. J. 427, 459 (1994).
- (56) Z. Mikic, J. A. Linker, Astrophys. J. 430, 898 (1994).
- (57) R. Liu, J. Chen, Y. Wang, K. Liu, Scientific Reports 6, 34021 (2016).
- (58) J. Zhang, X. Cheng, M.-D. Ding, Nature Communications 3, 747 (2012).
- (59) S. Patsourakos, A. Vourlidas, G. Stenborg, Astrophys. J. 764, 125 (2013).
-
Acknowledgments
T.G. and R.L. are supported by NSFC 41474151, 41774150, and 41761134088. R.L. also acknowledges the Thousand Young Talents Program of China. Y.W. acknowledges support by NSFC 41774178 and 41574165. B.K. acknowledges support by the DFG and NSFC through the collaborative grant KL 817/8-1/NSFC. A.V. acknowledges support by the Austrian Science Fund (FWF) P27292-N20. This work is also supported by NSFC 41421063, CAS Key Research Program of Frontier Sciences QYZDB-SSW-DQC015, and the fundamental research funds for the central universities.
-
Competing Interests
The authors declare that they have no competing financial interests.
-
Contributions
R.L. interpreted the data and wrote the manuscript. T.G. processed and analyzed the AIA data. B.K. performed the MHD simulation. B.K., Y.W., and A.V. participated in the discussions and made contributions to finalize the manuscript.
-
Data Availability
All data needed to evaluate the conclusions in the paper are present in the paper and/or the Supplementary Materials. Additional data available from authors upon request.
Supplementary Figures
Supplementary Movies
-
Supplementary Movie 1
Plasmoid coalescence developing into a seed CME. The bottom left panel shows AIA 131 Å images enhanced by unsharp masking, and the inset highlights the current sheet region and plasmoids. The bottom right panel shows the corresponding running-difference images.
-
Supplementary Movie 2
The eruption observed by SDO/AIA’s six EUV channels. Different features show up in different passbands: the plasmoids and current sheet in 131 Å, the flux rope in 131, 94 and 335 Å, the overlying coronal loops in 211, 193 and 171 Å.
-
Supplementary Movie 3
Temperature structure of the eruption revealed by the DEM analysis.
-
Supplementary Movie 4
Formation and evolution of the sheared arcade during the earlier confined C5.3-class flare.
-
Supplementary Movie 5
Plasmoid dynamics in the vertical current sheet of a CME simulation.
Supplementary Notes
While small-scale current sheets exist ubiquitously in the corona because of the continuous shuffling and intermixing of field-line footpoints in the photospheric convection (53), a large-scale current sheet can be produced in the corona in numerous ways besides the well-known heliospheric current sheet, e.g., when an emerging flux collides with the coronal field (54), when a moving bipole bumps into surrounding magnetic structures (55), when a shearing magnetic arcade collapses under a hypothesized global resistive MHD instability (56) or interacts with an overlying magnetic null point (5), or, when a quadrupole field is arranged in certain ways (57).
The formation of the pre-existing current sheet in the present study can be traced back to a C5.3-class confined flare that starts at 13:55 UT and peaks at 14:40 UT, one hour before the X2.8-class flare. An arcade of loops rises and expands into the corona at 8 km s-1 from 14:30 UT, in tandem with the appearance of flare loops underneath (Figure S3; Supplementary Movie 4). This arcade resembles the so-called “hot channel”(58), as being heated to temperatures over 10 MK, but unlike those interpreted as the proxy of flux ropes (e.g., 58, 59), it shows no signature of twist. The structure fades away as it cools down, from SDO/AIA 131 and 193 Å, as well as from an alternative perspective in STEREO-B/EUVI 195 Å (Figuree LABEL:suppfig:2view). We suggest that this hot arcade illuminates flux that erupts to produce this confined C5.3 flare, whose associated reconnection heats the plasma involved. As the expanding arcade becomes faint a bright linear feature appears only in 131 Å from 15:00 UT, which is as hot as the flare loops underneath (10 MK), therefore being interpreted as the current sheet. The sustained heating is attributed to slow magnetic reconnection ongoing at the current sheet, until fast reconnection is triggered at the onset of the imminent X2.8 flare.