Merits and constraints of low- experimental data for the proton radius determination
Abstract
The question of the determination of the proton charge radius from electron scattering data led to an unprecedented experimental effort for measurements of the electric form factor of the proton at low and very low momentum transfer in electron and muon elastic scattering. On the basis of basic properties of densities and fitting bias considerations, a procedure is developed in order to evaluate the impact of forthcoming data on . Particularly, it is shown that a 0.1% precision on these future cross section data is necessary to establish indisputably the -value as determined from lepton scattering. The ProRad (Proton Radius) experiment at the PRAE (Platform for Research and Applications with Electrons) facility in Orsay is further discussed, especially the experimental method to meet this stringent constraint.
pacs:
13.40.GpElectromagnetic form factors and 14.20.DhProperties of protons and neutrons and 06.20.JrDetermination of fundamental constants1 Introduction
The proton charge radius puzzle Poh14 arose from the significant disagreement between measurements of the proton radius from the Lamb shift of muonic hydrogen Poh10 and from electron scattering experiments Ber10 as well as the spectroscopy of atomic hydrogen Moh12 . The spectroscopy of muonic hydrogen by the CREMA Collaboration Poh10 effectively turned upside down the world of atomic and subatomic physics, not only because of the measured value of the proton charge radius but even more so because of the superb quality of the experimental result, which does not leave room for any ambiguity. This result was confirmed by a further measurement of the CREMA Collaboration from the spectroscopy of muonic deuterium Poh16 . However, the recent release of two high accuracy atomic hydrogen measurements, one Bey17 in better agreement with the CREMA value and the other Fle17 with the CODATA value Moh16 , is further questioning the spectroscopy measurements of the proton radius.
As a consequence of this puzzle, the electron elastic scattering technique was deeply revisited, from its basic principles up
to its interpretation. In contrast to atomic spectroscopy, lepton scattering ( or ) off protons provides
an indirect measurement of the proton radius obtained from the slope of the electric form factor at zero-momentum transfer
(, expressed in fm-2 units)111In this work, we use bold small-letters () for three-vectors, small
letters () for the module of three-vectors, and capital letters () for
four-vectors.. Within a relativistic approach, the quantity measured by scattering experiments can be formally related to
the char-ge radius of the proton in the proton Breit frame where the zero-component of the electromagnetic current involves
solely the electric form factor . In this frame, = and is the exact Wigner transform of the
quantum charge distribution. Whether the electron scattering radius is exactly the same as the spectroscopy radius can
however be questioned. It has been suggested for a long time that some relativistic effects Lic70 occur and may affect
data interpretation Kel02 . The internal structure of the nucleon further complicates the problem. The light-cone
framework offers a model independent interpretation of form factors in terms of transverse densities Mil07 , but does
not provide a clear link (if any) with the spectroscopy radius. These relativistic issues are still not satisfactorily solved
and are related in part to the fundamental problem of the non-relativistic reduction of a relativistic quantum field
theory Lor18 .
Considering the existing data set, the required zero-extra-polation plays a significant role in data interpretation, as
observed by several groups Hil10 ; Kra14 ; Lee15 . The -domain of interest for data interpolation is a further concern,
especially because of the sensitivity of the obtained proton radius to the considered maximum Hig16 ; Gri16 .
Ideally, one would like to obtain a result independent of the functional form of the extrapolation and of the data momentum
region. A pseudo-data method was recently proposed to efficiently control the sensitivity to the functional
form Yan18 ; Hay18 . A similar method is developed here to use the sensitivity to the data interpolation region in order
to obtain precision constraints on forthcoming electron scattering experiments at low .
As of today, the proton charge radius puzzle remains unsolved and calls for new spectroscopy and scattering data. An unprecedented world-wide experimental effort with respect to the scattering technique is under progress, investigating on the one hand lepton non-universality and on the other hand the precision frontier. The low- experimental effort, under consideration in the present work, pertains to the latter and gathers several technically different projects at different facilities. The main purpose of the study presented here is to evaluate the impact of low- experiments on the proton radius extraction, or conversely, the constraints on upcoming experimental data in order to firmly and unambiguously establish the value of the proton radius as measured by the electron scattering technique.
The next section revisits the basics of the relationship between the form factor and the probability density function, and
elaborates the constraints on the data intrinsic to the density functional. The following section explores the constraints on
the data fitting procedure from higher order density moments. The previous features are combined in the remaining sections to
define a method for evaluating the impact of low- experiments. Finally, the ProRad (Proton Radius) experiment under
development at the PRAE (Platform for Research and Applications with Electrons) facility in Orsay Mar17 is discussed,
in particular the experimental technique allowing to reach the required precision constraint.
2 Density and form factor
The probability charge density function of a quantum static object of charge 1 (in unit of the electron charge) is normalized to 1 over the whole configuration space following
| (1) |
The radius attached to this density is defined as the mean value of the squared-position operator
| (2) |
assuming a spherically symmetric density. In the non-relativistic approach, the form factor corresponding to this extended object can be defined as the Fourier transform of the spatial probability density
| (3) |
which inversion gives
| (4) |
with =1 following the normalization given in Eq. 1. Determining from (or the inverse) requires the knowledge over the full spatial (momentum) range of the integral. Since the experimental knowledge is limited, models have to be used to follow the procedure underlaid in Eq. 3-4. Considering the multipole expansion of the exponential function and the series representation of the 0th-order spherical Bessel function, Eq. 3 becomes
| (5) |
where
| (6) |
with
| (7) |
This establishes that the form factor depends on the even moments of the spatial probability density, and that it can be expressed as a function of . It should be stressed that the -dependence results directly from using the series expansion of the Bessel function. Consequently, it is limited to the validity domain of this representation. The derivative of Eq. 5 with respect to writes
| (8) |
from which the radius is deduced as
| (9) |
Hence, the radius is commonly defined as the slope of the form factor at =. It corresponds in that sense to the slope of a mathematical function deduced from experimental data. When the zero -point is experimentally inaccessible, as in the case of elastic electron scattering, the determination of the radius requires an extrapolation of the knowledge acquired in domains where . Minimizing systematical effects, the measurement of the radius through extrapolation from a low domain close to the physical point = is thought to be robust. This motivates the current world wide experimental effort to measure the proton electric form factor at low momentum transfer.
The previous description defined the experimental method applied in elastic electron scattering experiments to determine the radius of nucleons and nuclei. While established on firm theoretical grounds, the experimental realization of this approach necessarily suffers limitations, in particular the sensitivity to the data fitting procedure Lee15 ; Hig16 ; Gri16 . One can understand this feature by rewriting Eq. 5 as
| (10) |
where the sum in the right-hand side represents the relative correction to the first order term , originating from higher order terms in the expansion. The fitting of experimental data is nothing else than a mathematical reproduction of Eq. 10. Since the correction term scales with powers of , it is intuitive that the higher , the larger the influence of the correction. In other words, extracting the radius by extrapolating the knowledge of the form factor from domains at large amplifies the sensitivity of the procedure to the functional form of through the dependence on higher order terms in the series expansion.
The magnitude of the correction terms in Eq. 10 involves the ratio of the moments of the spatial probability density, and as such is model dependent. Considering the limited experimental knowledge, the choice of a density model is a delicate issue. However, any model should represent a physically possible case, particularly, it should ensure the convergence of the expansion at high order values, that is
| (11) |
For a given density model, the ’s coefficients can be evaluated to any order in the expansion. Considering for instance the generic form
| (12) |
where is a normalization constant defined as
| (13) |
the moments of the spatial density write
| (14) |
and specifically, the radius is given by
| (15) |
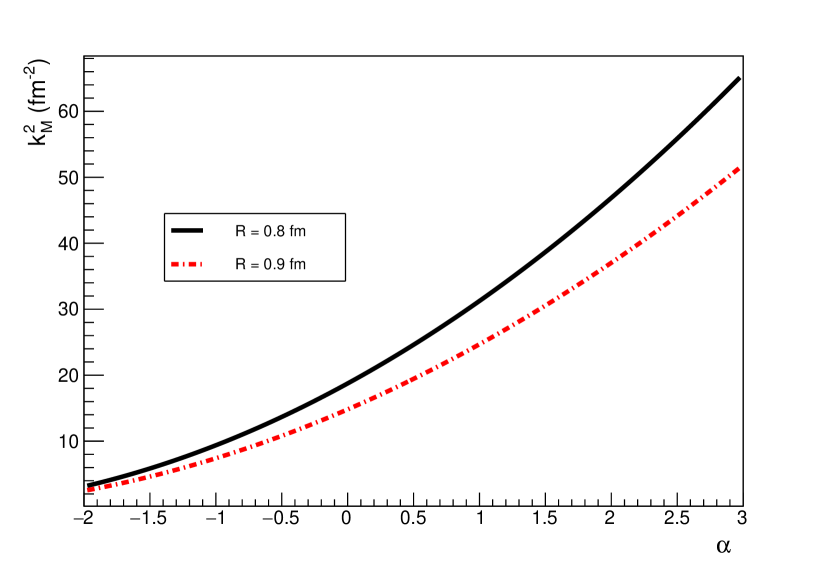
The convergence criterion of the series for the density model and radius considered here writes
| (16) |
which limits the -range over which the series representation of the Fourier transform can be used. Since data fitting mimics the series representation, the convergence criterion effectively restricts the ability to extract any possible density functionals from any measured -domain. This is expressed in Fig. 1 which shows the -evolution of for a radius variable in the range 0.8-0.9 fm. At a fixed , the relation Eq. 16 acts as the minimum acceptable -parameter for data fitting. The small domain only allows for the largest -phase-space.
The restriction of the -domain can in principle be released if the form factor data are fitted against the Fourier transform of the density. Considering as example Eq. 12, the form factor can be derived analytically from the Fourier transform of the density as
| (17) |
which indicates that is most generally a -dependent function. Apart from the specific case of the dipole form factors (=0), it is only in the limit that Eq. 17 reduces to a pure -dependence, consistently with the validity range of the serial expansion. However, such an approach remains strongly model dependent since the true shape of the density is unknown.
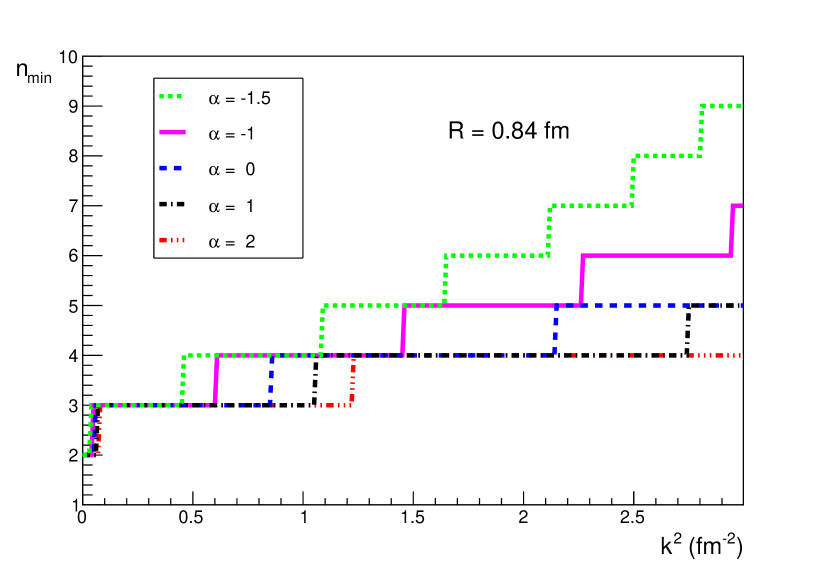
For a given density model, the relative correction from each term in Eq. 10 can be evaluated. Requiring the value of the form factor at to be precise within some accuracy corresponds to limiting the effects of the higher order terms. This leads to a minimal order of the expansion which intuitively increases with . Figure 2 shows the -evolution of the minimal order required to correctly describe the form factor at with a 510-4 accuracy, that is
| (18) |
Considering a fixed radius of = fm, the different -models are compared in Fig. 2. There exists a -domain (up to 2 fm) where is weakly depending on the specific density model. Such a domain is of experimental interest since it does not suffer from density related bias, i.e. this restricted -domain is not limited by the convergence criterion and does not bias the shape of the density that can be extracted from data. Note that the 510-4 accuracy constraint does only affect the specific value of but not the global behaviour. Additionally, the restriction to this limited kinematical domain naturally preserves the analyticity properties of the proton form factors Hil10 .
These features are strong indications that the low-momentum transfer region up to 2 fm-2 is most suitable for a robust determination of the radius through the -dependence of the form factor.
3 Data fitting and radius
The previous section established the existence of a density dependent relationship between the series representation of the form factor up to a certain momentum transfer , and the expansion order required to contain higher order effects on . should not be confused with the order of a polynomial fit. However, the data fitting procedure can be inspired from these density dependent considerations. While a minimal order limit is suggested, there is no maximum order limit that can be used to describe the data. Fits with too many parameters may still give acceptable results with excellent and confidence probability but different radius value Lee15 ; Ber14 . However, using an expansion order higher than what is expected to describe the data would generate overfitting problems and could lead to biased results.
This feature is illustrated further with a pseudo-data procedure. A thousand data sets have been generated following a dipole parameterization assuming the radius value = fm. The position in and the measurement errors of the pseudo-data are taken from the Mainz 2010 data set Ber10-1 restricted to the momentum transfer range = fm-2, corresponding to = (Fig. 2). Note that the specific value of this limit is not determinant for the present discussion. The form factor value at a given follows a normal distribution centered on the dipole expectation value with a gaussian width corresponding to the error at that same . Each pseudo-data set is then fitted with polynomials of different order ()
| (19) |
to extract the () parameters of the form factor expansion, and the corresponding moments of the density leading to
| (20) |
For each moment, the compatibility criterion () between the dipole reference value and the measured value of the ith-moment of the density from the fit of pseudo-data with the nth-order polynomial is defined as
| (21) |
where is the moment error, and is expressed in units of the standard deviation ().
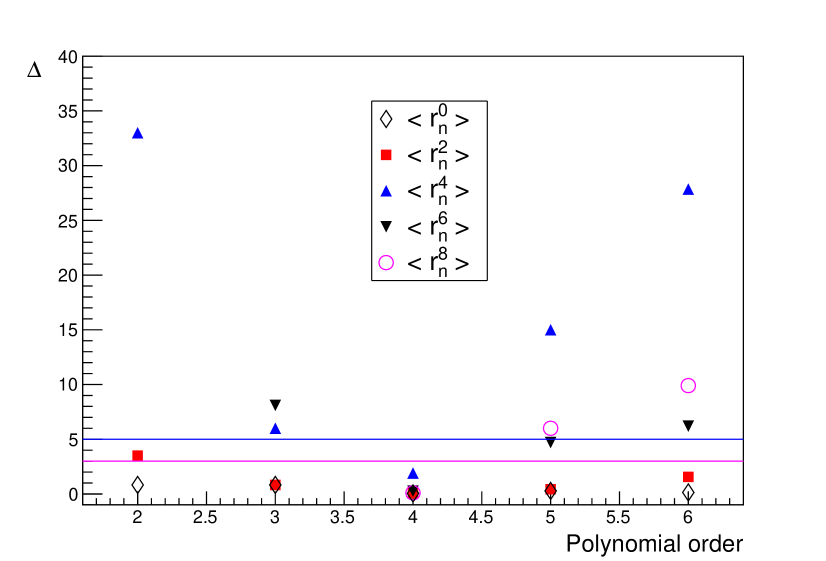
Figure 3 shows the compatibility criterion as a function of the order of the polynomial used to fit pseudo-data. It clearly indicates the existence of a maximum polynomial order limit at which zeroth, first and higher order moments are recovered from the pseudo-data. Fits with a polynomial order smaller than shows systematics deviations from reference values. Fits with polynomial order higher than still recover consistent zeroth and first moment but rapidly fail higher moments. recovery should be understood as the convergence of the fit toward the reference value in the case of an infinite number of pseudo-experiments, but it does not exclude the possibility for a single experiment to find a different . Similarly to the first order moment, higher order moments are physics observables of the density and should be recovered by the fitting procedure. The failure of the fit for higher order moments is a direct consequence of data overfitting, i.e. fitting unphysical fluctuations from point-to-point, and indicates that a maximum polynomial order limit should be considered. The present empirical study suggests to keep = to ensure a reasonable determination of the density moments.
4 Impact of low momentum transfer data
4.1 The experimental status
The current world data set for the electric form factor of the proton with momentum transfer smaller than 2 fm-2
(Tab. 1) consists of 753 experimental points obtained from Rosenbluth separation
experiments Dud63 ; Bor75 or cross section measurements assuming some relationship between the electric and magnetic form
factors Ber10-1 ; Han63 ; Fre66 ; Aki72 ; Mur74 ; Sim80 ; Mih17 : 22 data from early experiments prior to
1970 Dud63 ; Han63 ; Fre66 , 43 data from experiments over the period 1970-1980 Bor75 ; Aki72 ; Mur74 ; Sim80 , and 688 data
from the recent Mainz experiments Ber10-1 ; Mih17 . Out of this data set, 454 data feature a momentum transfer smaller
than 1 fm-2.
Following previous sections, a fit of experimental data up to 2 fm-2 requires a
4th-order polynomial in while a 3rd-order polynomial suffices up to 1 fm-2. The results
of the fits of the world data with these polynomials, which generic expression is defined in Eq. 19, is reported in
Tab. 2. Note that all the data falling in the momentum range of interest are considered with no
specific restriction nor adjustment, as for instance the floating normalization of the Mainz data set Ber14 . Such a
procedure, which would allow to improve the quality of the fits and to refine the proton radius value, is not the purpose of
the present discussion. represents the value of the form factor at zero momentum transfer, corresponding by convention
to the unit proton electric charge and is actually reproduced with a per-mil or better accuracy by existing data. Depending on
the maximum momentum transfer considered, the world data set supports a proton radius either in agreement or in disagreement
with the muonic hydrogen measurement. The objective of upcoming elastic scattering experiments in the low momentum transfer
region is not only to allow for a new determination of the proton radius but most importantly to provide a momentum
independent proton radius below 2 fm-2, accurate enough to indisputably establish whether electron scattering
measurements of the proton radius are or not consistent with the spectroscopy measurements of muonic atoms. Then, the
potential impact of the future experiments can be quantified in terms of the precision of expected data.
| Data | Ref. | Data Number | |
|---|---|---|---|
| Set | fm-2 | fm-2 | |
| ① | Ber10-1 + Mih17 | 405 | 688 |
| ② | ① + Sim80 | 420 | 706 |
| ③ | ② + Bor75 | 423 | 713 |
| ④ | ③ + Mur74 | 434 | 724 |
| ⑤ | ④ + Aki72 | 441 | 731 |
| ⑥ | ⑤ + Fre66 | 442 | 735 |
| ⑦ | ⑥ + Han63 | 452 | 750 |
| ⑧ | ⑦ + Dud63 | 454 | 753 |
| Data | |||||
|---|---|---|---|---|---|
| (fm-2) | (fm) | Set | |||
| 1.0 | 3 | 0.99926(65) | 0.839(16) | 1.186 | ① |
| 0.99934(65) | 0.840(16) | 1.174 | ② | ||
| 0.99934(65) | 0.841(16) | 1.169 | ③ | ||
| 0.99928(65) | 0.839(16) | 1.177 | ④ | ||
| 0.99914(65) | 0.829(16) | 1.321 | ⑤ | ||
| 0.99914(65) | 0.830(16) | 1.321 | ⑥ | ||
| 0.99915(65) | 0.830(16) | 1.311 | ⑦ | ||
| 0.99915(65) | 0.830(16) | 1.302 | ⑧ | ||
| 2.0 | 4 | 1.00052(51) | 0.875(10) | 0.995 | ① |
| 1.00056(50) | 0.875(10) | 0.989 | ② | ||
| 1.00056(50) | 0.875(10) | 1.001 | ③ | ||
| 1.00052(50) | 0.874(10) | 1.010 | ④ | ||
| 1.00060(50) | 0.871(10) | 1.105 | ⑤ | ||
| 1.00060(50) | 0.871(10) | 1.103 | ⑥ | ||
| 1.00058(50) | 0.870(10) | 1.118 | ⑦ | ||
| 1.00058(50) | 0.870(10) | 1.112 | ⑧ |
4.2 The method
The landscape of upcoming low momentum transfer elastic scattering experiments is particularly rich. At the Thomas Jefferson National Accelerator Facility, the PRad experiment will provide data in the momentum range 5.010-3-1.5 fm-2, by measuring at small scattering angles the elastic cross section relative to the Møller cross section, using a high resolution electromagnetic calorimeter Gas11 . The Initial State Radiation technique applied to elastic scattering at the Mainz Microtron (MAMI) facility will provide further measurements of in the range 8.010-3-0.7 fm-2 Mih18 . Another experiment at MAMI will use a Time Projection Chamber to detect the recoil elastic protons, investigating the momentum transfer range 2.510-2-0.5 fm-2 Den18 . The Ultra Low (ULQ2) project Sud18 , under development at the Research Center for Electron Photon Science of Tohoku University, will determine in the range 8.010-3-0.2 fm-2 by measuring scattering relative to C with a CH2 target. At the Platform for Research and Applications with Electrons (PRAE Mar17 ) in Orsay, the ProRad experiment will measure elastic scattering relative to Møller scattering to obtain data in the range 2.510-4-7.510-3 fm-2. While the main focus of the MUSE experiment Gil17 at the Paul Scherrer Institut is about elastic scattering, it will also measure scattering to provide data in the range 4.010-2-2.0 fm-2. These experiments will constitute an impressive data set of 320 future measurements at low momentum transfer, using different experimental methods and techniques.
In order to determine the impact of these new measurements, the data set is restricted to transfer momenta below 2 fm-2. Each planned data is characterized by its -momentum transfer and the expected precision on the proton electric form factor , which is the parameter of the study. A pseudo-data set is generated according to the 3rd- or 4th-order polynomial corresponding to existing data (Tab. 2) leading to a reference proton radius . Each data is further redistributed according to a gaussian whose mean and standard deviation correspond to the polynomial projection and the absolute error , respectively. The resulting data set added to the already existing world data set is then fitted with a 3rd- or 4th-order polynomial depending on the selected maximum momentum, which provides the measurement of the proton radius relevant to this data set. This procedure is repeated 1000 times to obtain the distribution of the measurements which gaussian adjustment provides the measured proton radius and the error attached to the initial relative error input. Finally, the comparison between and measures the impact of expected data.
4.3 Potential of upcoming data
The merits of upcoming experiments are expressed in terms of the evaluators
| (22) | |||||
| (23) |
with
| (24) | |||||
| (25) |
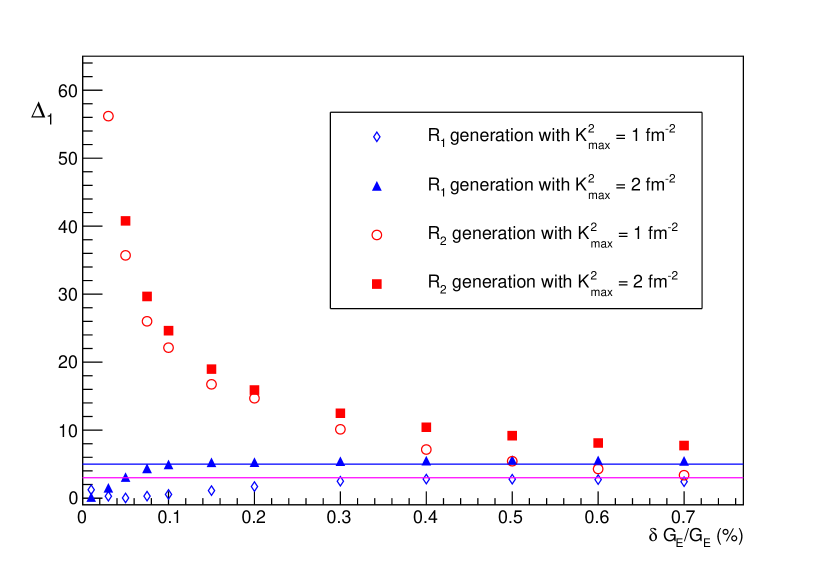
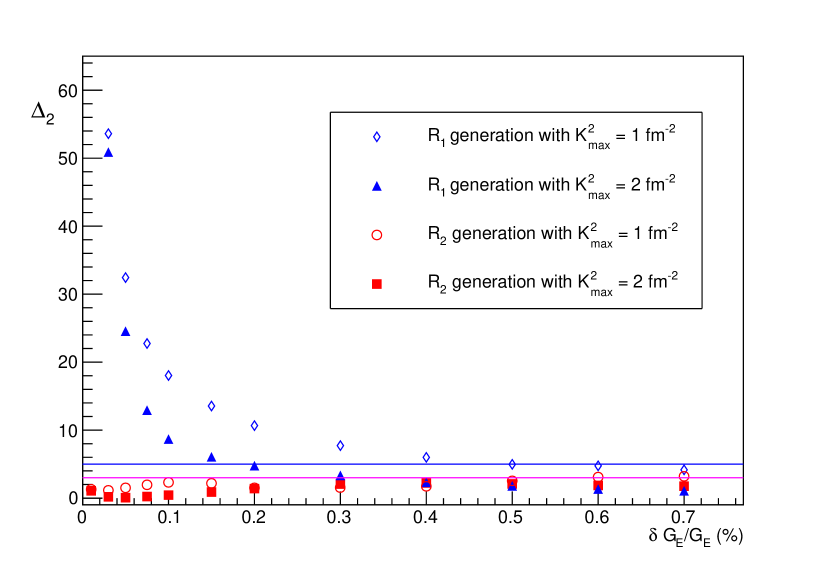
quantifies the compatibility of the measured proton radius, taking into account existing and expected data up to 1 fm-2 () or 2 fm-2 (), with the reference value obtained from the fit of existing data up to 1 fm-2. quantifies the compatibility with the reference value obtained from the fit of existing data up to 2 fm-2. and are chosen from Tab. 2 considering the complete world data set.
For very accurate pseudo-data, one would expect the fit procedure to converge to the radius value selected to generate
pseudo-data. Correspondingly, one of the (,) evaluators should be small () while the other should
be large (). For low accuracy, the procedure would be dominated by existing data. In
Fig. 4 and 5, the difference between open and full symbols
indicates the effect of the maximum momentum transfer (1 or 2 fm-2), and the difference between each open or full symbols
indicates the radius corresponding to generated pseudo-data ( or ). Both figures exhibit the same expected trend as
the accuracy of pseudo-data increases: the estimator of pseudo-data generated with a value different from the reference one
rapidly increases while the estimator of pseudo-data generated with the reference value slowly decreases. Depending on the
generation scenario, the precision on forthcoming data required for a consistent determination of the proton radius can be
seriously demanding: if the true radius is , an accuracy of 0.4% would statistically confirm this value and reject
, independently of ; in the opposite case, an accuracy of 0.3% is required to confirm and reject
when considering data up to 1 fm-2, and as low as 0.05% for data up to 2 fm-2. This suggests that low-
experimental data to come would conclusively establish the electron scattering measurement of the proton radius only if a
0.1% precision on cross section sensitive observables is reached. This is definitively a stringent constraint on experiments,
especially considering systematical effects.
5 The ProRad experiment at PRAE
5.1 The PRAE facility
The PRAE facility Mar17 is a multidisciplinary R&D facility based on an electron accelerator delivering a high-performance beam (Tab. 3) with energy up to 70 MeV (Phase I) upgradable to 140 MeV (Phase II). It gathers several scientific communities involved in subatomic physics, radiobiology, instrumentation and particle accelerators for the completion of unique measurements. In the energy range 30-70 MeV, the ProRad experiment will contribute to the low- experimental effort by providing high accuracy measurements of the electric form factor of the proton in the lowest ever measured momentum transfer range. The 50-140 MeV electron energy range will allow developing pre-clinical studies of new radiotherapy methods aiming for a better treatment of cancer. Over the full energy range, PRAE beams will provide the tools to characterize and optimize instrumentation techniques for the next generation of detectors used in medical imaging, subatomic physics, particle physics, spatial technology and astrophysics.
| Beam parameters @ LinAc end | PRAE | Unit |
|---|---|---|
| Maximum Energy | 70(I) - 140(II) | MeV |
| Repetition rate | 50 | Hz |
| Relative energy spread | % | |
| Bunch charge | 0.00005-2 | nC |
| Bunch length | m | |
| Number of micro-bunches/train | 1 |
The electron beam generated by a radio-frequency gun accelerates inside a 3.4 m (Phase I) long LinAc section based on high-gradient 3 GHz S-band cavities operating at a 50 Hz repetition rate Bar17 . Two of these sections will be installed in Phase II of the project. A beam energy compression section constituted of a magnetic chicane and a dechirper structure, follows the accelerating section, and allows to reduce the beam energy dispersion to a few 0.01%. Flexible beam optics is ensured by several magnets to cope the different beam characteristics and operation modes depending on the application. The PRAE facility is currently under construction at the Laboratoire de l’Accélérateur Linéaire in Orsay. First beam delivery is planned for 2021.
5.2 The ProRad experimental setup
Following the accelerating and beam characterization sections of the PRAE machine, the ProRad experimental setup (Fig. 6) features a reaction chamber followed by a vacuum vessel closed by an end-cap supporting the detector elements. The experiment is designed to measure with a 0.1% accuracy the ratio
| (26) |
representing the cross section of the elastic electron scattering off protons () relative to the Møller cross section (). The reaction chamber hosts a windowless target made of a 15 m diameter solid hydrogen jet Cos12 , effectively concretizing a pure and nearly point-like target. Scattered electrons propagate over 2 m inside the vacuum vessel till the detection area. The ProRad detector follows simple and robust considerations for particle identification, position, and energy measurements in a non-magnetic environment at energies well below the pion production threshold. It consists of 28 elementary cells organized around the beam in a -symmetrical arrangement and located at 4 different scattering angles between 6∘ and 15∘ (Fig. 6). The elementary cell is placed right after a 100 m thick mylar foil acting as vacuum exit window, and is composed of two layers of thin scintillator strips followed by a cylindrical BGO (Bi4Ge3O12) crystal.
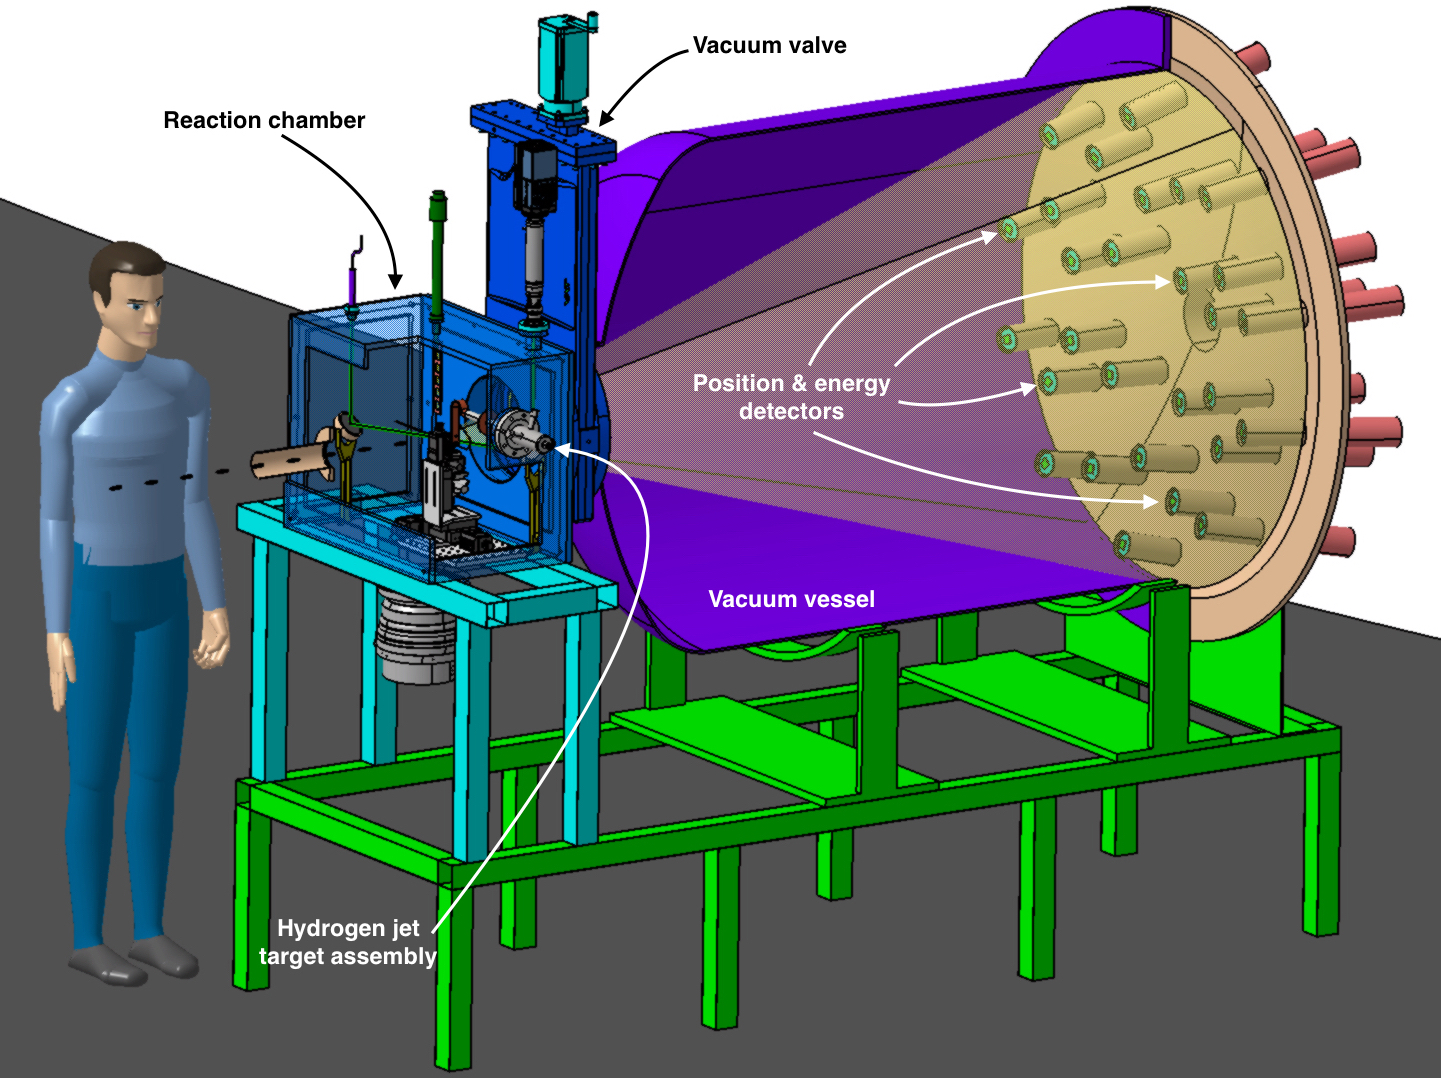
The scintillator hodoscope acts all at once as a neutral particle discriminator, a charged particle tagger, and a position detector. The scintillator strip fired by the scattered electron defines the electron scattering angle. The elementary angular volume, i.e. the angle binning of experimental data, corresponds to the 20 mm high, 4 mm wide, and 1.3 mm thick strip size. Taylor development techniques allow to transport the strip integrated experimental cross section at the strip center with a very high accuracy, such that the critical parameter is the actual strip location within the experiment reference frame. The ProRad goal is a full mapping of the detector with an accuracy better than 0.1 mm.
Electrons penetrating the central region of the BGO crystal are tagged by the scintillator hodoscope and absorbed by the
crystal where they leave an energy deposit signal. The same crystal simultaneously measures elastic and Møller electrons.
At each scattering angle, the energy difference between elastic and Møller electrons allow to distinguish between the two
processes. The accuracy of this separation is an important parameter of the experiment. It is a convoluted effect of each
single crystal properties and of the knowledge of the radiative tail associated to elastic and Møller scattering. The
ProRad collaboration aims at a better than 0.1% description of these effects which contribute to the systematics of the
measurement.
5.3 Control of systematics
The electric form factor of the proton is deduced from the experimental cross section ratio according to the expression
| (27) | |||||
where is the magnetic form factor of the proton and are the electron and proton mass.
In the first term of the right hand side of Eq. 27, the experimental observable () is corrected by several factors: the kinematical coefficient ; the factor originating from radiative effects in and scatterings; finally, the ratio of the Møller cross section to the electron elastic scattering cross section off a point-like proton, evaluated theoretically. In the very low momentum transfer region considered at ProRad, the magnetic form factor correction (second term of the right hand side of Eq. 27) is very small and can be evaluated precisely enough to weakly contribute to the systematics of the measurement. The control of radiative effects with high precision is a challenge that all electron scattering experiments and specifically the low- experimental effort are facing. These have been revisited to take into account lepton mass effects Aku15 of importance at low energies. Further developments to improve the description of higher order effects Arb15 ; Tom18 are pursued, such that the current theoretical knowledge of radiative effects is reasonably expected to be better than 0.1%. Additionally, the deconvolution of the energy spectra registered by each detector provides an experimental handle on the radiative tail.
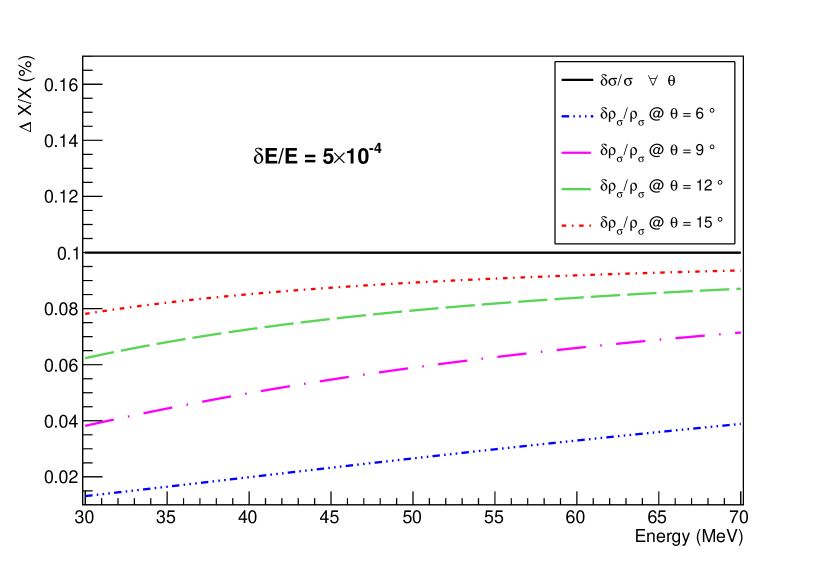
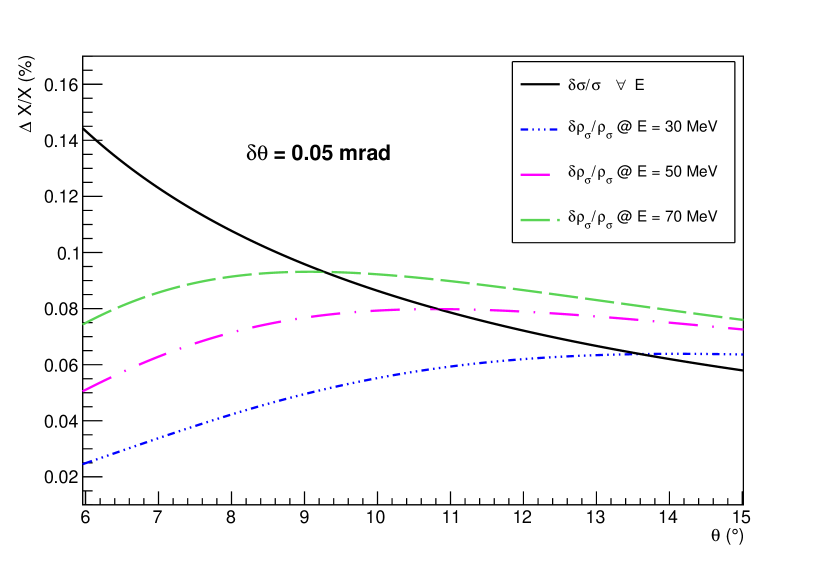
The dominant source of ProRad systematical error originates from the theoretically determined cross section ratio which transfers into the knowledge of the electron beam energy and scattering angle. Measuring the deviation of the beam in a precisely known magnetic field provided by a dipole, the PRAE goal is to determine the absolute beam energy with a 510-4 accuracy, similarly to the ARC energy measurement Mar98 implemented in the Hall A of the Jefferson Laboratory Alc04 . Figure 7 (left) shows the relative sensitivity of experimental observables in the ProRad energy and angular range at a fixed . The expected resolution allows a 0.1% precision on the elastic cross section, independently of the scattering angle. However, this observable suffers much larger systematics from the target luminosity and the detector efficiency. It is the benefit of the cross section ratio to become independent of these quantities and to further reduce the sensitivity to the beam energy. The knowledge of the angular dispersion of the electron beam, of the location of the interaction vertex, and of the location of each scintillator hodoscope combine into the electron scattering angle systematics. Thanks to the PRAE beam properties, the quasi-point-like nature of the target, and the precision of the mechanical assembly of the detector, ProRad aims to obtain a 0.05 mrad systematical error on the scattering angle. The effect of this precision on experimental observables is shown on Fig. 7 (right) for the beam energies considered at ProRad. It is particularly noticed that the cross section ratio allows to reduce the sensitivity to the angular resolution, and is the only viable observable at small angle to contain angular systematics below 0.1%.
6 Conclusion
In summary, this work discusses the correlation between the precision of forthcoming electron scattering experiments at
low- and their expected impact on the determination of the proton charge radius. It is shown that a 0.1% precision on
cross section related experimental observables is necessary to unambiguously establish the value of the proton radius measured
by the electron scattering technique, i.e. to obtain a value independent of the maximum momentum transfer () considered for experimental data interpolation in the region limited to 2 fm-2. This puts stringent
metrological constraints on experiments. The technique to meet these requirements in the specific case of the ProRad
experiment, that will investigate at PRAE the lowest ever measured momentum range, has been presented.
The experimental data fitting procedure has been shown to be an intricate process comprising basic density concerns, the
region of interpolation, and the fit functional. The convergence criterion of the series representation of the form factor can
introduce a bias in the density which is minimized if the interpolation region is restricted to 2 fm-2. Larger momenta
region can still be considered within a Fourier transform approach which leads to -dependent functionals instead of the
commonly used -dependence. Within a polynomial approach, it is shown that the polynomial order is constrained to a
minimal value depending on , and a maximum value constrained by the reliable reconstruction of higher
order moments of the density. It is most likely a general feature that, with respect to the determination of the proton
radius, a fit functional is limited to a momentum range of validity. This stresses the importance of pseudo-data methods in
this problem.
Acknowledgements.
We would like to thank Cédric Lorcé for enlightening discussion. This work was supported by the LabEx Physique des 2 Infinis et des Origines (ANR-10-LABX-0038) in the framework « Investissements d’Avenir » (ANR-11-IDEX-01), the french Ile-de-France region within the SESAME framework, and the LIA IDEATE.References
- (1) J.C. Bernauer, R. Pohl, Scientific American 310 (2014) 32.
- (2) (CREMA Collaboration) R. Pohl et al. Nature 466 (2010) 213.
- (3) (A1 Collaboration) J.C. Bernauer et al. Phys. Rev. Lett. 105 (2010) 242001.
- (4) P.J. Mohr, B.N Taylor, D.B. Newell, Rev. Mod. Phys. 84 (2012) 1527.
- (5) (CREMA Collaboration) R. Pohl et al. Science 353 (2016) 669.
- (6) A. Beyer et al. Science 358 (2017) 79.
- (7) H. Fleurbaey, Doctorat Thesis, Université Pierre et Marie Curie, Paris (France), 2017.
- (8) P.J. Mohr, D.B. Newell, B.N Taylor, Rev. Mod. Phys. 88 (2016) 035009.
- (9) A.L. Licht, A. Pagnamenta, Phys. Rev. D 2 (1970) 1150.
- (10) J.J. Kelly, Phys. Rev. C 66 (2002) 065203.
- (11) G.A. Miller, Phys. Rev. Lett. 99 (2007) 112001.
- (12) C. Lorcé, Private Communication.
- (13) R.J. Hill, G. Paz, Phys. Rev. D 82 (2010) 113005.
- (14) E. Kraus, K.E. Mesick, A. White, R. Gilman, S. Strauch, Phys. Rev. C 90 (2014) 045206.
- (15) G. Lee, J.R. Arrington, R. Hill, Phys. Rev. D 92 (2015) 013013.
- (16) D.W. Higinbotham, A. Amin Kabi, V. Lin, D. Meekins, B. Norum, B. Sawatzky, Phys. Rev. C 93 (2016) 055207.
- (17) K. Griffioen, C. Carlson, S. Maddox, Phys. Rev. C 93 (2016) 065207.
- (18) X. Yan, D.W. Higinbotham, D. Dutta, H. Gao, A. Gasparian, M. Khandaker, N. Liyanage, E. Pasyuk, C. Peng, W. Xiong, arXiv:1803.01629 (2018).
- (19) T.B. Hayward, K.A. Griffioen, arXiv:1804.09150 (2018).
- (20) D. Marchand, EPJ Web of Conf. 138 (2017) 01012.
- (21) (A1 Collaboration) J.C. Bernauer et al. Phys. Rev. C 90 (2014) 015206.
- (22) J.C. Bernauer, Ph.D. Dissertation, Johannes Gutenberg Universität, Mainz (Germany), 2010.
- (23) B. Dudelzak, G. Sauvage, P. Lehmann, Il Nuovo Cim. 28 (1963) 18.
- (24) F. Borkowski, G.G. Simon, V.H. Walther, R.D. Wendling, Nucl. Phys. B 93 (1975) 461;
- (25) L.N. Hand, D.G. Miller, R. Wilson, Rev. Mod. Phys. 35 (1963) 335.
- (26) D. Frèrejacque, D. Benaksas, D. Drickey, Phys. Rev. 141 (1966) 1308.
- (27) Yu.K. Akimov et al. Sov. Phys. JEPT 35 (1972) 651.
- (28) J.J. Murphy, II, Y.M. Shin, D.M. Skopik, Phys. Rev. C 9 (1974) 2125.
- (29) G.G. Simon, Ch. Schmitt, F. Borkowski, V.H. Walther, Nucl. Phys. A 333 (1980) 381.
- (30) (A1 Collaboration) M. Mihovilovič et al. Phys. Lett. B 771 (2017) 194.
- (31) (PRad Collaboration) A. Gasparian, D. Dutta, H. Gao, M. Khandaker, Jefferson Lab Experiment E12-11-106 (2011).
- (32) M. Mihovilovič, Private Communication.
- (33) A. Denig, Private Communication.
- (34) T. Suda Private Communication.
- (35) R. Gilman, E.J. Downie, G. Ron, S. Strauch et al. arXiv:1709.09753 (2017).
- (36) S. Barsuk et al. IPAC2017, JaCoW (2017) THPVA079.
- (37) R.A. Costa Fraga, A. Kalinin, M. Kühnel, D.C. Hochhaus, A. Schottelius, J. Polz, M.C. Kaluza, P. Neumayer, R.E. Grisenti, Rev. Sci. Inst. 83 (2012) 025102.
- (38) I. Akushevich, H. Gao, A. Ilyichev, M. Meziane, Eur. Phys. J. A 51 (2015) 1.
- (39) A.B. Arbuzov, T.V. Kopylova, Eur. Phys. J. C 75 (2015) 603.
- (40) O. Tomalak, Few-Body Syst. 59 (2018) 87.
- (41) D. Marchand, Doctorate Thesis, Université Blaise Pascal, Clermont-Ferrand (France), 1998.
- (42) J. Alcorn et al. Nucl. Inst. Meth. A 552 (2004) 294.