Ongoing Resurfacing of KBO Eris by Volatile Transport in Local, Collisional, Sublimation Atmosphere Regime
Abstract
Kuiper belt object (KBO) Eris is exceptionally bright with a greater visible geometric albedo than any other known KBO. Its infrared reflectance spectrum is dominated by methane, which should form tholins that darken the surface on timescales much shorter than the age of the Solar System. Thus one or more ongoing processes probably maintain its brightness. Eris is predicted to have a primarily nitrogen atmosphere that is in vapor pressure equilibrium with nitrogen-ice and is collisional (not ballistic). Eris’s eccentric orbit is expected to result in two atmospheric regimes: (1) a period near perihelion when the atmosphere is global (analogous to the atmospheres of Mars, Triton, and Pluto) and (2) a period near aphelion when only a local atmosphere exists near the warmest region (analogous to the atmosphere of Io). A numerical model developed to simulate Eris’s thermal and volatile evolution in the local atmosphere regime is presented. The model conserves energy, mass, and momentum while maintaining vapor pressure equilibrium. It is adaptable to other local, collisional, sublimation atmospheres, which in addition to Io and Eris, may occur on several volatile-bearing KBOs. The model was applied for a limiting case where Eris is fixed at aphelion and has an initial nitrogen-ice mass everywhere equal to the precipitable column of nitrogen in Pluto’s atmosphere during the New Horizons encounter (the resultant mass if the Pluto atmosphere collapsed uniformly onto the surface). The model results indicate that (1) transport of nitrogen in the local, collisional, sublimation atmosphere regime is significant, (2) changes of Eris’s albedo or color from nitrogen transport may be observable, and (3) uniform collapse of a global, nitrogen atmosphere likely cannot explain Eris’s anomalous albedo in the present epoch. Seasonal volatile transport remains a plausible hypothesis to explain Eris’s anomalous albedo and geologic processes that renew Pluto’s brightest surfaces, such as convection and glaciation, may also be operating on Eris.
keywords:
Eris; Local Atmosphere; Volatile Transport; Thermal Modeling; Albedo1 Motivation: The High Albedo of KBO Eris
Eris is a large Kuiper belt object (KBO) with a radius that is 0.98 of Pluto’s and a mass relative to Pluto of 1.27 (Sicardy et al., 2011; Brown and Schaller, 2007). It has an eccentric orbit, ranging from 38 AU to 98 AU from the Sun over a 557-year period. Eris was at aphelion in 1977 and in 2018 is at a heliocentric distance of 96 AU. Eris is also exceptionally bright with a visible geometric albedo of 0.96 (Sicardy et al., 2011), the highest geometric albedo of any known KBO. Methane-ice dominates its infrared reflectance spectrum (Brown et al., 2005). Shifts of the methane absorption features indicate bulk abundances of 90% and 10% (Tegler et al., 2010). Dysnomia is the only known satellite of Eris and has an orbital period of 16 days (Brown and Schaller, 2007).
Stern et al. (1988) predicted that a high albedo and methane-ice on Pluto (and by analogy other KBOs) implied recent or ongoing renewal of the surface because methane should form tholins that darken the surface on timescales much shorter than the age of the Solar System (see also Johnson (1989)). This prediction was confirmed in spectacular fashion by the New Horizons exploration of Pluto, which not only found that bright surfaces are also young surfaces but also that Pluto has extraordinarily bright surfaces that are also exceptionally young (Stern et al., 2015; Buratti et al., 2017; Robbins et al., 2017). Temporal changes from ongoing surface renewal, however, were not observed on Pluto over the brief interval of the New Horizons flyby (Hofgartner et al., 2018). Thus Eris’s anomalously high albedo, along with the detection of methane-ice, strongly suggests that one or more ongoing processes maintain its brightness and resupply methane to its surface.
Atmospheric freeze-out (collapse onto the surface) as Eris recedes from its perihelion heliocentric distance of 38 AU to 98 AU at aphelion is commonly invoked to explain its high albedo (e.g., Brown et al. (2005); Sicardy et al. (2011)). The 500-year period of Eris’s orbit prohibits direct observational evaluation of this hypothesis but it can be investigated with a numerical thermal model. We assess the hypothesis of atmospheric collapse of a Triton/Pluto-like nitrogen atmosphere for the anomalously high albedo of Eris using coupled thermal and transport models.
In section 2 we argue that Eris’s eccentric orbit is expected to result in two atmospheric regimes: (1) a period near perihelion when the atmosphere is global and (2) a period near aphelion when only a local atmosphere exists near the warmest (approximately subsolar) region. In both regimes the atmosphere is collisional (not ballistic), composed primarily of nitrogen, and is maintained by vapor pressure equilibrium (VPE) with solid-phase nitrogen (nitrogen-ice). The global regime is analogous to the atmospheres of Mars, Triton, and Pluto and the local regime to that of Io.
Section 3 describes a model we developed to simulate thermal and volatile evolution in the local, collisional, sublimation atmosphere (LCSA) regime. The coupled thermal-transport model conserves energy, mass, and momentum while maintaining VPE. The LCSA regime is unique to Io on large bodies closer to the Sun than KBOs and has received less study than other atmospheric regimes. Several large KBOs are now known to have volatile deposits on their surfaces and expected to be in the local atmosphere regime for parts of their orbits (Young and McKinnon, 2013). Thus, the local atmosphere regime may be common in the Solar System and will probably become a topic of increased study. The model in section 3 is adaptable to other bodies with local atmospheres and is a possible starting point for future studies of their thermal and volatile evolutions.
In section 4 we demonstrate the implementation of the coupled thermal-transport model and use it to test the hypothesis of atmospheric collapse for the anomalously high albedo of Eris in a limiting case where Eris is held at aphelion. This is followed by a discussion of the implications of the results of the model simulations and conclusions.
2 Global and Local, Collisional, Sublimation Atmospheres
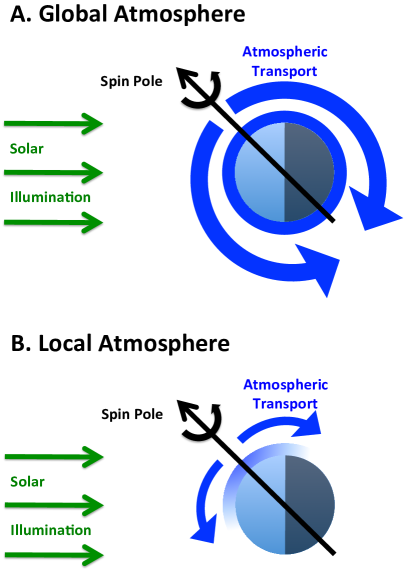
We refer to an atmosphere where the primary constituent is in VPE with solid-phase surface deposits (volatile-ice) as a sublimation atmosphere. A global sublimation atmosphere has approximately uniform surface pressure everywhere around the globe (isobaric); due to VPE, the volatile-ice has an approximately uniform temperature around the globe (isothermal; Fig. 1; Trafton and Stern (1983)). Condensation occurs where energy balance requires latent heat to be added (generally at the winter pole) and sublimation where latent heat is subtracted (summer pole). If the sublimating mass is greater than the condensing mass, the pressure of the atmosphere increases everywhere and vice versa. Mars, Triton, and Pluto have global sublimation atmospheres. Note that these are different from Earth’s atmosphere because its primary constituent is always in the vapor phase. Water condenses/sublimates toward VPE but it is a minor constituent that does not hold the pressure isobaric and the condensed phases isothermal.
If temperature/pressure changes in one region are much faster than the time required to communicate those changes over the globe, VPE cannot sustain a global atmosphere. We approximate the timescale of local pressure changes as the timescale for atmospheric freeze-out (radiative collapse), which is estimated as the ratio of the latent heat that must be emitted to condense a column of atmosphere to the radiative flux. The timescale for communicating pressure changes is approximately the pole-to-pole distance divided by the sound speed. We define as the ratio of these two timescales
| (1) |
where is mass of atmosphere per unit area, is latent heat of sublimation/condensation, is surface emissivity, is the Stefan-Boltzmann constant, is volatile-ice surface temperature, is planetary radius, is speed of sound, is vapor pressure, is gravitational acceleration, is the Avogadro constant, is the Boltzmann constant, and is molecular mass. If then a sublimation atmosphere is global. If , atmospheric transport cannot keep up with condensation in dark regions and an atmosphere will exist only locally over sublimating regions (Fig. 1). This atmosphere will have pressure gradients that will result in horizontal transport of the vapor away from the warmest regions. We refer to this regime as a local sublimation atmosphere.
Trafton and Stern (1983) argued that a sublimation atmosphere would be in the global regime if the wind speed required to hold the volatile-ice isothermal is much less than the speed of sound. Assuming that the whole globe is covered by isothermal volatile-ice, they also showed that the steady-state wind speed , is
| (2) |
For this special case, and the condition that for a sublimation atmosphere to be global is equivalent within a factor of to the condition that the wind speed be much less than the speed of sound ().
Table 1 gives for several planetary bodies known to have sublimation atmospheres. For Mars, Triton, and Pluto, we find 20, 90, and 200 respectively, consistent with their global atmospheres, and for Io, , consistent with its local atmosphere. We note that for Triton and Pluto during the Voyager 2 and New Horizons encounters is greater than the for Mars, suggesting that at those times their atmospheres were more stable against collapse than the atmosphere of Mars. When Pluto is at aphelion, however, (assuming the same emissivity and albedo to calculate the planetary equilibrium temperature) and thus its atmosphere is less stable against collapse. The atmosphere is less stable against collapse but since it does not provide a good indication of whether or not the atmosphere does collapse; the parameter is only useful for distinguishing between global and local atmospheres when or . Research focused on the stability of Pluto’s atmosphere suggests that a high thermal inertia prevents collapse of its global sublimation atmosphere (e.g.,Young (2013); Olkin et al. (2015)).
| Mars () | 20 | |
| Io () | 200 | |
| Triton () | 90 | |
| Pluto () | 200 | |
| Eris (, perihelion, A=0.9) | 0.008 | 200 |
| Eris (, aphelion, A=0.9) | ||
| Eris (, perihelion, A=0.5) | 200 | |
| Eris (, aphelion, A=0.5) | 20 | |
| Eris (, perihelion, A=0.1) | 2000 | |
| Eris (, aphelion, A=0.1) | 0.09 | 3000 |
| Eris (, perihelion, A=0.9) | 0.001 | |
| Eris (, aphelion, A=0.9) | ||
| Eris (, perihelion, A=0.5) | 0.04 | 5000 |
| Eris (, aphelion, A=0.5) | ||
| Eris (, perihelion, A=0.1) | 2 | |
| Eris (, aphelion, A=0.1) | 0.03 |
Methane dominates the reflectance spectrum of Eris (Brown et al., 2005); however, shifts of the methane absorption features indicate bulk abundances of 10% and 90% , similar to the bulk abundances on Pluto (Tegler et al., 2010). Thus nitrogen is likely the primary constituent of any atmosphere on Eris, as it is on Triton and Pluto, and dominates the latent heat of sublimation. The visible geometric albedo of Eris is known but not its bolometric Bond albedo; these parameters are related but not uniquely. The Bond albedo is equal to the geometric albedo multiplied by the phase integral and if Eris’s phase integral is similar to that of the brightest Saturnian satellites, then (Sicardy et al., 2011). Since the present bolometric Bond albedo is not known and the albedo could change in time (from change of the illuminated hemisphere or surface evolution), we consider a range of bolometric Bond albedos. For nitrogen on Eris, at aphelion we find for bolometric Bond albedos of respectively and at perihelion . Eris is therefore predicted to have a local atmosphere at aphelion and probably transition to a global atmosphere as it approaches perihelion, depending on its bolometric Bond albedo. If methane is taken as the dominant constituent of any atmosphere on Eris, we find that Eris is likely always in the local atmosphere regime, except possibly for very dark albedos right at perihelion. This difference is due to the lower volatility of methane compared to nitrogen (e.g., Fray and Schmitt (2009)) and demonstrates that if nitrogen is present in sufficient quantity on Eris, it will be the main constituent of the atmosphere.
We refer to an atmosphere as ballistic if vapor particles have no interaction with each other and follow ballistic trajectories; the converse is a collisional atmosphere. To check if an atmosphere is collisional, a useful metric is the ratio of the pressure scale height to the mean free path. We define to be this ratio
| (3) |
where is pressure scale height, is mean free path, and is kinetic diameter (diameter of effective scattering cross section). If then the atmosphere is collisional and if then the atmosphere is ballistic. Note that is the inverse of the Knudsen number.
For Mars, Io, Triton, and Pluto we find, and respectively, consistent with their collisional atmospheres. For nitrogen on Eris, depending on albedo and solar distance (Table 1). We note that is for Eris only for the very coldest planetary equilibrium temperatures. Since the temperature of the subsolar point is greater than the planetary equilibrium temperature, even for high albedos and at aphelion Eris likely does have a collisional atmosphere at the subsolar point. For methane on Eris, except for the highest planetary equilibrium temperatures.
We therefore predict that Eris has a nitrogen, LCSA for part if not all of its orbit and possibly a nitrogen, global, collisional, sublimation atmosphere when it is closest to the Sun.
3 Coupled Thermal-Transport Numerical Model of Local, Collisional, Sublimation Atmospheres
3.1 Numerical Thermal Model of Global, Collisional, Sublimation Atmospheres
Volatile transport (VT) in the global, collisional, sublimation atmosphere regime was modeled with a numerical thermal model that conserves energy and mass while maintaining VPE. Leighton and Murray (1966) developed this model to study the behavior of carbon dioxide on Mars and correctly predicted (1) that the Martian seasonal polar caps are composed primarily of carbon dioxide and (2) that the total pressure of the Martian atmosphere changes substantially over an annual cycle from exchange of carbon dioxide between the polar caps and atmosphere. The model was adapted to study the seasonal nitrogen cycles on Triton and Pluto and demonstrated that their atmospheres are strongly connected to nitrogen-ice on their surfaces by VPE, analogous to carbon dioxide on Mars (e.g.,Hansen and Paige (1992, 1996)). This type of thermal model was used extensively to study thermal and volatile behavior on Mars, Triton, and Pluto, and the code for a refined version of the model that is computationally efficient for a broad phase space of initial conditions is publicly available (Young, 2017).
In the global atmosphere regime, atmospheric transport is able to keep pace with pressure changes from sublimation/condensation and maintains approximately uniform pressure over the globe. The models described above assume a uniform pressure (and by VPE, a uniform volatile-ice temperature), which implicitly incorporates transfer of energy and mass, so these models do not explicitly track the atmospheric transport. These models also include subsurface conduction, but subsurface conduction can be ignored if the surface is covered by isothermal volatile-ice. For this simplified case, these models have three variables: volatile-ice temperature , vapor pressure , and volatile-ice mass per unit area , all of which vary with time but only varies with position. The variables are determined by three equations: conservation of energy and mass and VPE; only the equation for conservation of energy varies with position (solved locally at each position). The assumption of uniform pressure is not valid in the local atmosphere regime and atmospheric transport of mass and energy must be explicitly modeled.
3.2 Meteorological Model of Local, Collisional, Sublimation Atmospheres
VT in the LCSA regime was modeled with a vertically integrated meteorological model that conserves energy, mass, and momentum. Ingersoll et al. (1985) developed this model to study the behavior of sulfur dioxide on Io. Their model has three variables: , , and wind speed , all of which vary with position, and three equations, all of which also vary with position. The model prescribed the volatile-ice temperature distribution, did not include latent heat, and assumed symmetry about the subsolar/antisolar axis. As a result, both the thermal and temporal behavior were not explicitly modeled. While all of these assumptions were shown to be reasonably appropriate for Io, none are valid for a general LCSA.
3.3 Coupled Thermal-Transport Numerical Model of Local, Collisional, Sublimation Atmospheres
We combine elements of the two types of models discussed above to model the LCSA regime with a coupled thermal-transport numerical model. As in the global thermal model, energy and mass are conserved while maintaining VPE, but for the local regime all of these equations vary with position and are solved at each location individually rather than averaged globally. As in the local meteorological model, the atmospheric transport of volatile material due to pressure gradients is tracked explicitly via the conservation of momentum. The transport of mass and energy from this atmospheric transport is added to their respective conservation equations. The coupled thermal-transport model conserves energy, mass, and momentum while maintaining VPE. Fig. 2 depicts some, but not all, of the components of this model. The model is adaptable to any planetary body with a LCSA.
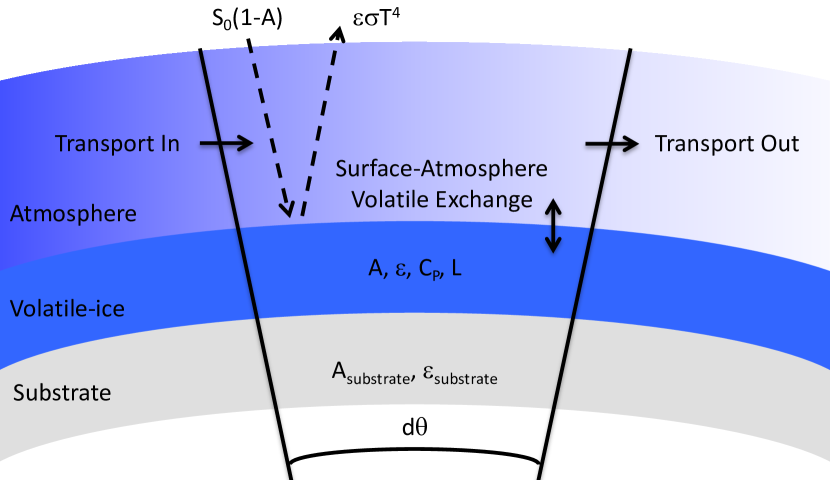
Conservation of Energy: The difference between absorbed and emitted radiation is balanced by changes of temperature and phase,
| (4) |
where is incident solar flux, is surface bolometric Bond albedo, is surface emissivity, is the Stefan-Boltzmann constant, is surface temperature, is mass of solid-phase volatile deposit (volatile-ice) per unit area, is volatile-ice heat capacity at constant pressure, is time, and is latent heat of volatile-ice sublimation. , , and vary with position and time where and are variables to be solved and is known (see for example, Sanchez-Lavega (2011) for the expression for as a function of position and time).
The heat capacity of solid-phase nitrogen for relevant temperatures is given in Scott (1976) and we use those values in this work. As in Hansen and Paige (1996), the model tracks whether the nitrogen-ice is in its (cubic crystal structure) or (hexagonal crystal structure) phase. It uses the values provided therein for the latent heat of sublimation of each phase and the latent heat of the phase change.
Internal energy sources and conduction between the surface and subsurface could be incorporated into the equation for conservation of energy as done in other thermal models. However, for surfaces covered by volatile-ice in VPE with the atmosphere, subsurface conduction is a minor term in the equation and can be ignored. The present-day radiogenic heat flux to Pluto’s surface is estimated to be W/m2 (e.g., McKinnon et al. (2016)). Eris should not have a drastically different heat flux. Assuming Pluto and Eris have two component interiors with densities of 1000 kg/m3 (water-ice) and 3500 kg/m3 (rock), that all of their radiogenic energy comes from their rocky material, and that the radiogenic power per unit mass of rock is the same for both bodies, the present-day radiogenic heat flux to Eris’s surface is W/m2. The solar flux at 98 AU is W/m2. Thus even at Eris’s great aphelion distance, solar energy significantly exceeds the expected internal energy and therefore neglecting the internal contribution should only modestly affect the results. Similarly, the heat capacity of the atmosphere is another term that could be included in the equation for conservation of energy. But, for the low atmospheric pressures on Eris, the magnitude of this term is always 2% the magnitude of the latent heat term, which is less than the uncertainty in the latent heat of sublimation. We have decided not to include internal energy, subsurface conduction, and atmospheric heat capacity in this first application of the model because they are minor terms in the equation for conservation of energy and would introduce additional assumptions and/or variables.
Conservation of Mass: The volatile-ice deposits and atmosphere exchange mass through condensation/sublimation while conserving their total mass. Since the mass of atmosphere per unit area is where is vapor pressure and is gravitational acceleration,
| (5) |
where corresponds to volatile-ice sublimation and to condensation. The total change of pressure at each position is the sum of the contributions from exchange with the volatile-ice and atmospheric transport,
| (6) |
where is planetary radius, is polar angle from the location with the highest pressure, and is the vector component of the wind speed (). The second term after the last equality is the vertically integrated divergence of the meridional mass flux, as in Ingersoll et al. (1985). We have ignored the zonal mass flux since we’re interested in seasonal meridional transport and the zonal component averages to zero over a diurnal cycle. The pressure of the atmosphere is determined by VPE so
| (7) |
From the above two equations, the equation for conservation of mass is
| (8) |
Conservation of Momentum: Newton’s second law for a fluid is,
| (9) |
where is the vapor density which we determine from the equation of state for an ideal gas. If we again vertically integrate the meridional component and ignore the zonal component this equation simplifies to,
| (10) |
Vapor Pressure Equilibrium: Fray and Schmitt (2009) provide the pressure-temperature relation of VPE for (among many other volatiles of astrophysical interest) for the relevant temperatures and we use their relation.
Thus the model has four variables: , , , and , all of which vary with position and time, and four equations: conservation of energy, mass, and momentum and VPE, all of which vary with position.
4 Volatile Transport on Eris in the Local, Collisional, Sublimation Atmosphere Regime
In the first application of the coupled thermal-transport numerical model we test the hypothesis of atmospheric freeze-out (radiative collapse) for the anomalously high albedo of Eris (e.g., Brown et al. (2005); Sicardy et al. (2011)). Since Eris’s perihelion distance is similar (within several AU) to that of Pluto’s heliocentric distance during the New Horizons encounter, the volatile-ice deposit from atmospheric collapse can be crudely estimated by assuming Eris had a Pluto-like atmosphere when it was near perihelion and it subsequently condensed uniformly over the surface. We use an initial volatile-ice mass equal to the precipitable nitrogen in Pluto’s atmosphere as measured by New Horizons, kg/m2 (corresponds to a nitrogen-ice layer mm thick; Young et al. (2018)). In the simulations, Eris is held at its aphelion distance, where the incident solar flux is a minimum, as a limiting case. If, even in this extreme limit, VT is not negligible, then VT must be significant throughout the orbit of Eris. Similarly, we assume a friction force between the atmosphere and surface that reduces the wind speeds by a factor of 10. Greater wind speeds result in greater VT. The Bond albedo is equal to the geometric albedo multiplied by the phase integral and if a phase integral similar to the brightest Saturnian satellites is assumed then (Sicardy et al., 2011). For consistency with other studies of thermal and volatile evolution of KBOs, an emissivity of 0.9 is assumed (e.g., Stansberry et al. (2008)). The rotation period of Eris was considered in several projects, however, there is significant disagreement, ranging from approximately 14 hours to 16 days (e.g. Carraro et al. (2006); Sheppard (2007); Maris and Carraro (2008); Duffard et al. (2008); Roe et al. (2008); Rabinowitz and Owainati (2014)). We consider this parameter to be presently unknown and for simplicity choose a rotation period equal to the orbital period of its satellite Dysnomia, Earth days (Rabinowitz and Owainati, 2014). Similarly, Eris’s rotational pole is unknown so we assume it is equal to the pole of Dysnomia’s orbit which corresponds to an obliquity of and a subsolar latitude of in the current epoch (recall that Eris is currently near aphelion; Brown and Schaller (2007)). There is uncertainty in all of these initial conditions and parameters but the primary purposes of this first application of the coupled thermal-transport model are: (1) to demonstrate the applicability of the model and (2) determine whether VT in the local atmosphere regime on Eris is significant or negligible. Careful consideration of the VT as these parameters and initial conditions are varied is left to a follow-on study.
The four model outputs: volatile-ice temperature , vapor pressure , meridional wind speed , and volatile-ice mass per unit area , are shown in figure 3. The output nitrogen-ice temperatures are reasonable, there is a diurnal oscillation, the maximum is near the subsolar latitude shortly after local noon, and the values are comparable to the planetary equilibrium temperature ( 23 K). There is, however, a diurnal oscillation at the pole that is not realistic for the case of zonal symmetry. This oscillation is a result of ignoring zonal transport in the model. If all longitudes were included in the model, the contribution to the transport term at the pole in equation 8 from each longitude would oscillate with time of day but their sum would be a constant. Since not all longitudes are modeled, the transport term at the pole is not a constant but oscillates with time of day resulting in an oscillation of the volatile-ice temperature. Since we’re primarily interested in the net transport away from the pole and the oscillation is small (nearly imperceptible in figure 3) this unphysical oscillation does not affect the results and conclusions.
The vapor pressures in figure 3 are similarly reasonable. The pressure of the atmosphere at the surface is constrained by a stellar occultation to be Pa (1 confidence level) over the limb of the disk but could be greater away from the limb (Sicardy et al., 2011). The terminator, approximately the limb (since the subsolar and sub-Earth point on Eris when it is at aphelion are separated by ), is the black line in the figure. The predicted pressures at the limb are consistent with the upper limit, ranging from Pa, equal to the upper limit, to many orders of magnitude smaller depending on latitude. The meridional wind speeds range from zero at the location of the temperature/pressure maximum (an imposed boundary condition as in Ingersoll et al. (1985)) to approximately half the sound speed. In their study of Io’s LCSA, Ingersoll et al. (1985) predicted wind speeds a few times the sound speed and concluded that supersonic speeds were a general feature of the transport. Since the simulation in figure 3 assumed that friction decreased the meridional wind speed of the atmosphere to 10% of the frictionless speed, our results are similar to the predictions for Io. The volatile-ice mass oscillates due to exchange of nitrogen between the volatile-ice and atmosphere (more of the nitrogen is in the vapor phase on the day side, when temperatures are higher, and vice versa). There is also a net transport of nitrogen-ice from latitudes near the summer pole toward latitudes near the equator. The net transport does not extend all the way to the winter pole (the coldest region), however, because the pressures become too small to transport appreciable quantities of the volatile. Thus all four of the output variables are well-behaved and reasonable.
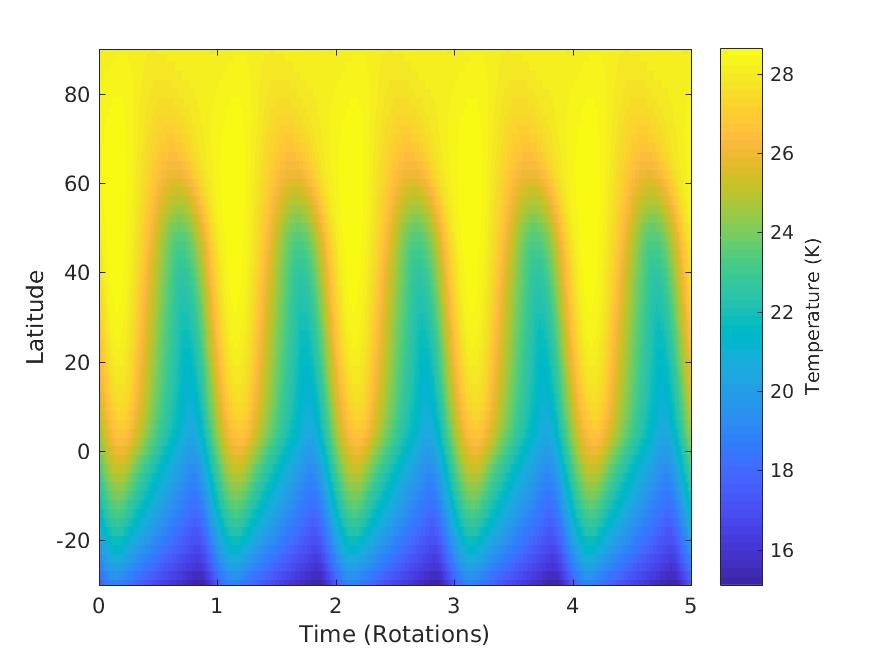
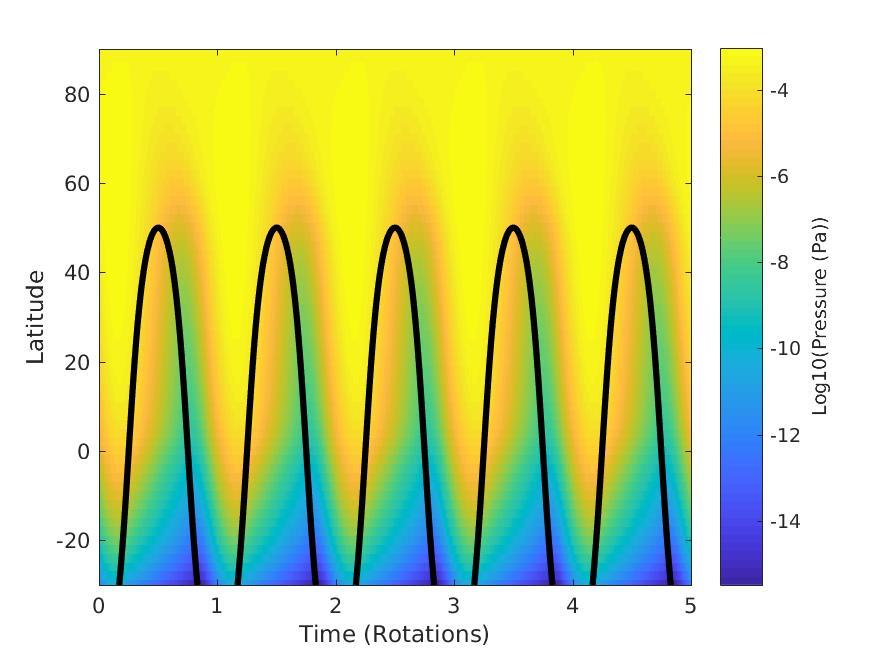
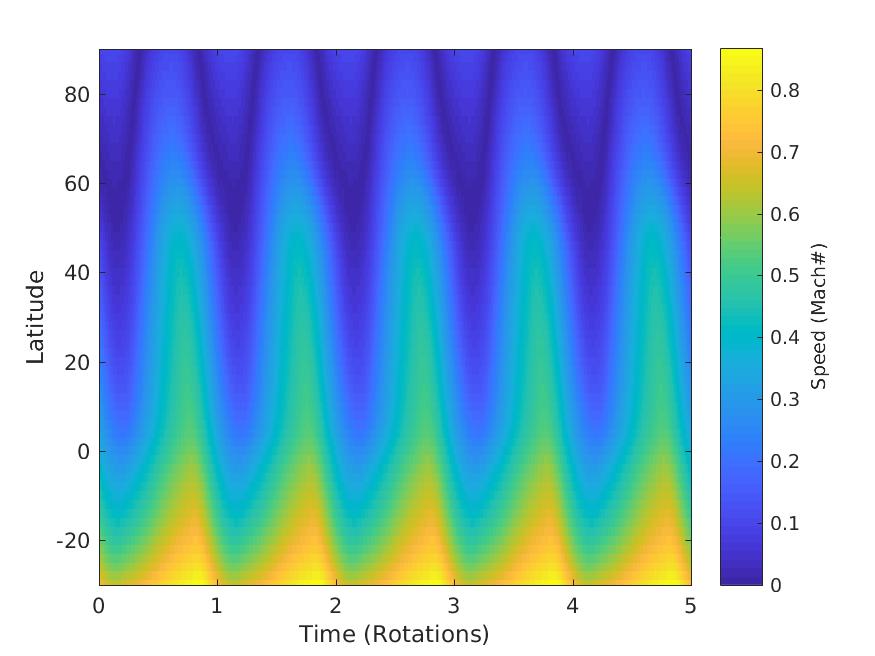
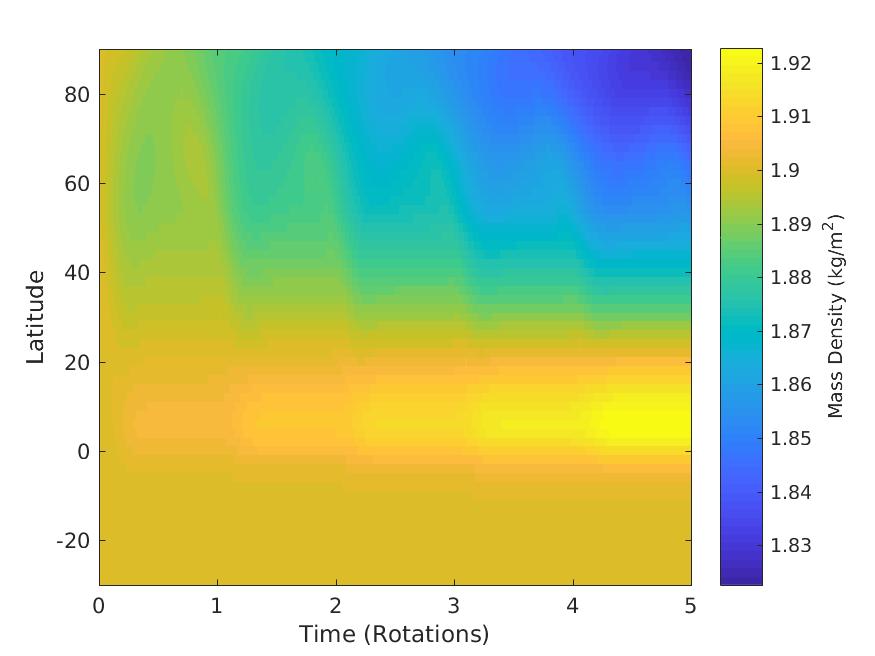
Figure 4 (a) shows the nitrogen-ice mass per unit area for 23 rotation periods (approximately one Earth-year) for the same initial conditions as in figure 3. After 1 year the pole has lost an appreciable amount ( 20% or 400 m thick layer) of nitrogen-ice to the equator. In this simulation the pole of Eris is free of nitrogen-ice after less than 6 Earth-years. Thus for the limiting case described above and assuming reasonable parameters, VT on Eris can significantly alter the surface on decadal timescales. Even in the local atmosphere regime, at the very cold temperatures of an almost 100 AU solar distance, VT could be an important process on Eris. The importance of VT for the surface evolution increases at closer heliocentric distances, where greater insolation increases volatile-ice temperature and the corresponding vapor pressure which results in greater atmospheric transport.
The VT rate is substantially higher for some modest changes to the model parameters. Panels (b) and (c) of figure 4 show the nitrogen-ice mass per unit area when the bolometric Bond albedo of the nitrogen-ice is decreased from 0.6 to 0.5 or the subsolar latitude is increased from to . Both of these changes result in a small, 1 K increase in the maximum temperature of the nitrogen-ice but in comparison with panel (a), the transport of nitrogen is significantly greater, approximately twice as much mass loss from the pole, for the same time period. Thus the VT and thermal evolution are sensitive to the thermal parameters. This sensitivity roots from the sensitive dependence of nitrogen vapor pressure on nitrogen-ice temperature. Small changes in temperature correspond to larger relative changes in vapor pressure and the higher vapor pressure enables the transport of more material by the atmosphere. Changes that reduce the maximum temperature of the nitrogen-ice, such as increasing the albedo, significantly reduce the mass transport by the atmosphere. Since the simulations in figures 3 and 4 were for Eris at aphelion, however, VT will increase dramatically for closer heliocentric distances. These examples demonstrate that the local atmosphere on Eris could transport significant volatile mass and uniform condensation of a Pluto-like atmosphere may not be able to explain the anomalously high geometric albedo of Eris in the present epoch, several decades past aphelion. While uniform atmospheric freeze-out may not be able to explain the anomalously high geometric albedo of Eris, seasonal VT remains a plausible hypothesis and will be investigated in a future application of the model.
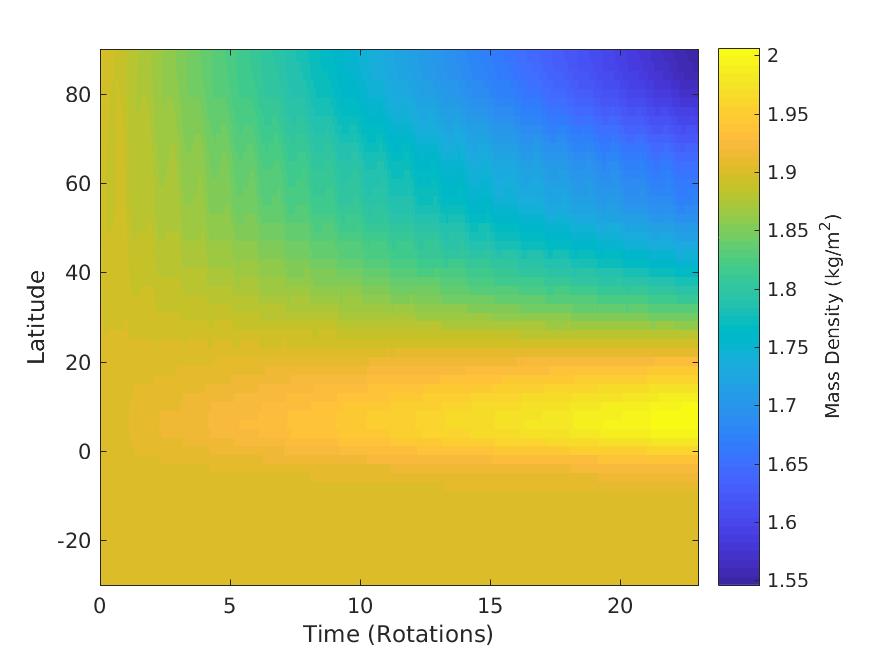
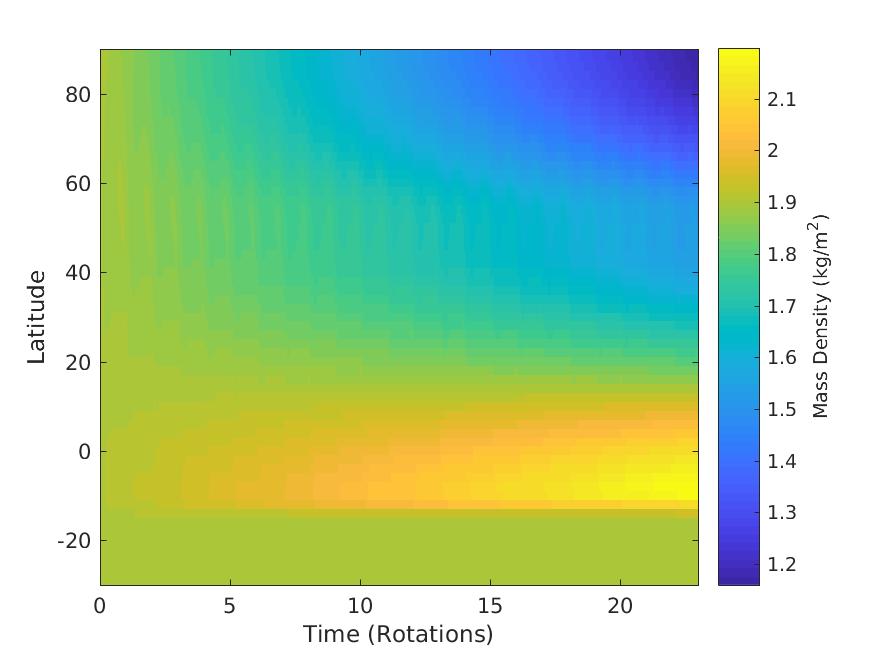
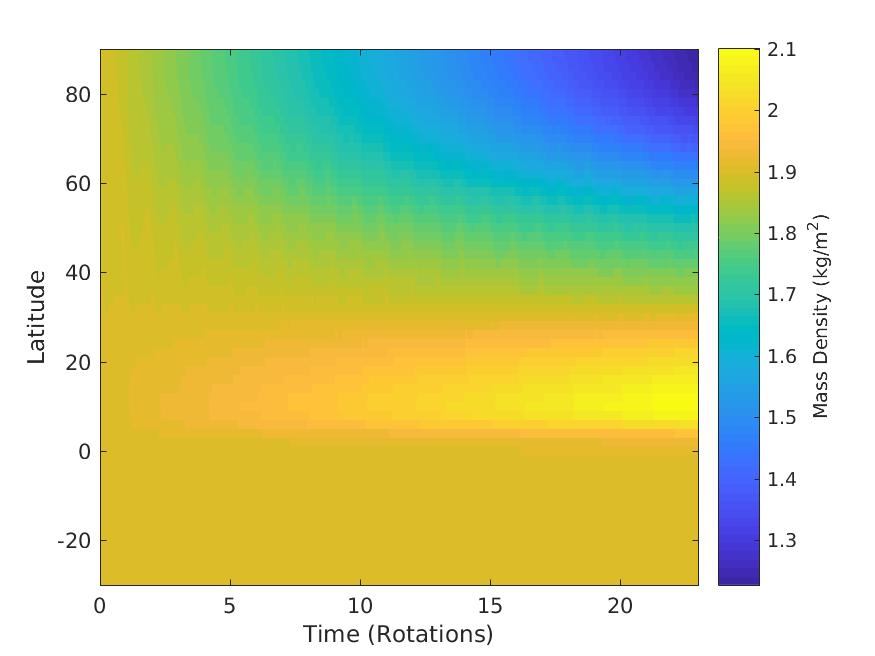
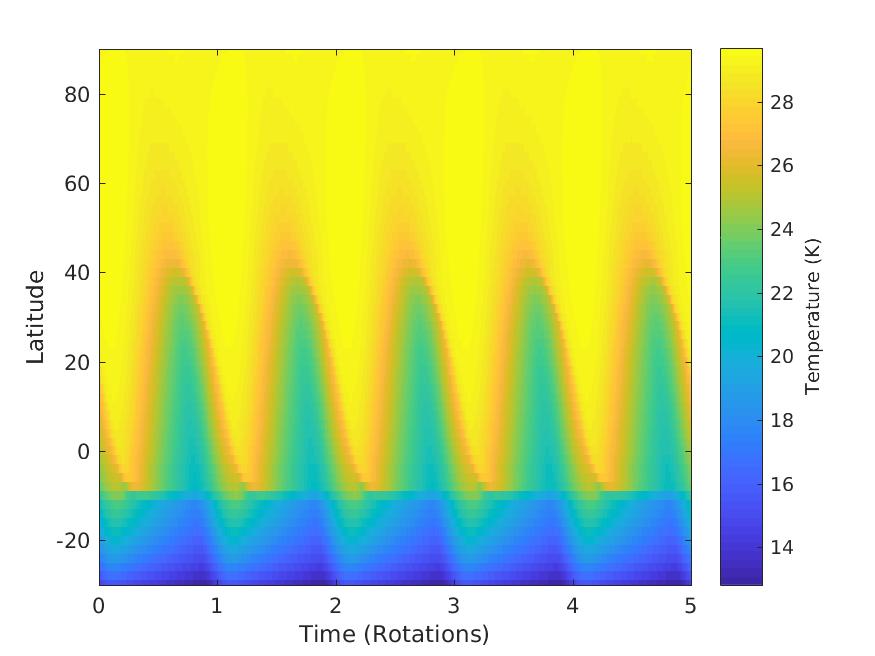
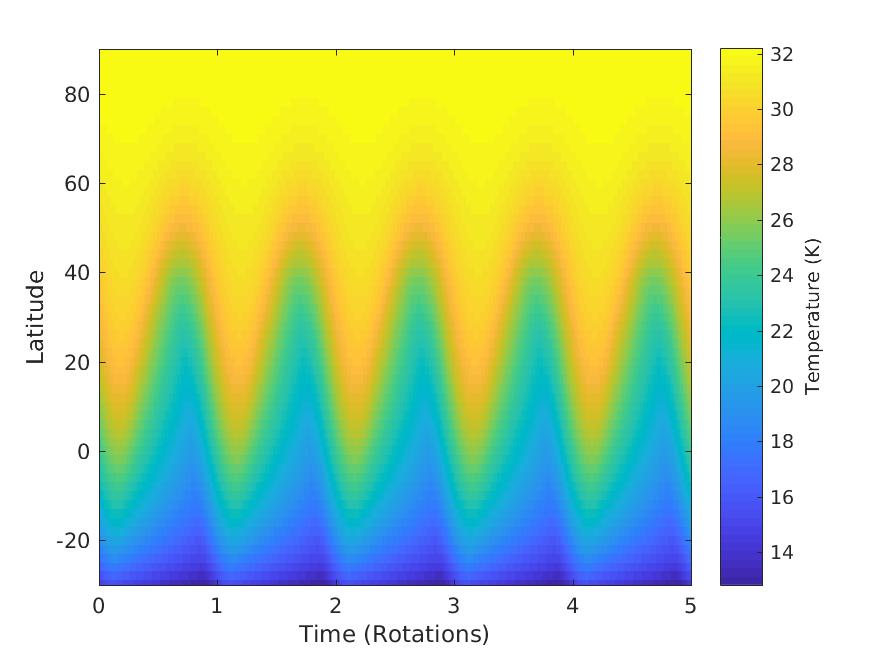
Figure 5 compares the temperature distributions from the coupled thermal-transport model and the thermal model without any atmospheric transport. For the thermal-only case, the transport of volatile material by the atmosphere is ignored by setting the second term of equation 8 to zero. This is an unphysical scenario because the atmosphere will have pressure gradients that will accelerate the vapor and transport material but it is useful for getting a sense of the significance of the transport component of the model. From comparison of the two temperature distributions, it is concluded that the transport does have a significant effect on the energy balance. The movement of nitrogen and the latent heat from its sublimation/condensation is effective at transporting energy from warmer to cooler regions and tends to homogenize the volatile-ice surface temperature. Just as for mass transport, the energy transport depends sensitively on the thermal parameters and increases as temperature increases. In fact, the modifications from the initial conditions of the simulation in figure 3 were selected to increase the apparent difference between the thermal-transport and thermal-only temperature distributions by increasing temperature.
5 Discussion
The first implication to emphasize from the results of the coupled thermal-transport numerical model for a local, collisional, sublimation atmosphere is that volatile transport (VT) on Eris in this regime can be significant. At a maximum surface pressure of 1-10 nbar, it is tempting to dismiss the atmosphere as negligible with no significant influence on the global energy and mass distributions but the model results demonstrate that this is not the case. Nitrogen is a very volatile material that sublimates into the vapor phase at the very cold temperatures of the distant Kuiper belt; nitrogen transport, even at heliocentric distances of AU, can modify the surface of Eris. We expect the conclusion that VT is an important surface process will also apply to any other bodies in the Kuiper belt that have substantial nitrogen reservoirs, likely only large bodies (Schaller and Brown, 2007). Since carbon monoxide has a similar volatility to nitrogen this statement is also true for any bodies with substantial carbon monoxide reservoirs, although there may not be any bodies in the Kuiper belt where the carbon monoxide inventory exceeds that of nitrogen.
Atmospheric freeze-out (radiative collapse) is a prevalent hypothesis for the anomalously high geometric albedo of Eris (e.g., Brown et al. (2005); Sicardy et al. (2011)). Based on the results shown in figure 4, however, we conclude that uniform collapse of a global, nitrogen, sublimation atmosphere (that may exist on Eris when it is closer to the Sun, analogous to the atmospheres on Triton and Pluto) likely does not explain Eris’s albedo. This conclusion is true for most bolometric Bond albedos but since the VT depends sensitively on the thermal parameters, it does not hold for extremely high bolometric Bond albedos. The general hypothesis of seasonal VT (e.g., cycling of volatile-ice between different surface regions each orbital period) remains a plausible explanation for the anomalous albedo of Eris and should be investigated. The discovery of terrains with exceptionally high albedos on Pluto (Buratti et al., 2017) that are renewed primarily by other processes, such as convection and glaciation (e.g., McKinnon et al. (2016); Moore et al. (2016)) leads us to propose that geologic processes other than seasonal VT may also be renewing the surface of Eris. As previously noted, Eris likely has a greater radiogenic heat flux than Pluto, a consideration that increases the plausibility of endogenic resurfacing.
Another implication of the results of the coupled thermal-transport model is that evolution of nitrogen-ice deposits on Eris may result in changes of albedo that are observable with Earth-based telescopes. The results shown in figure 4 suggest the mass-loss rate from the current summer pole is 1-10 mm of nitrogen-ice per decade. If the summer hemisphere is covered by nitrogen-ice of a similar thickness and the underlying surface is darker, then the removal of the nitrogen-ice may be detectable in the coming decades. Note that Pluto’s volatile-rich regions are brighter than its volatile-poor regions and are also brighter than Charon’s volatile-poor surface (Buratti et al., 2017). Similarly, VT could result in detectable changes of Eris’s color between observations (see Buratti et al. (2011) and Buratti et al. (2015) and references therein for discussions of albedo and color changes of Triton and Pluto from VT).
Aside from the prediction that the transport of nitrogen-ice may be observable as a change of the albedo or color of Eris, which is based on the results of the model for the volatile-ice mass, the results for the atmospheric pressure may also be testable. The pressure at the limb can be measured using stellar occultations and we predict a strong variation in pressure with position. For the parameters given in the caption of figure 3, the maximum pressure above the limb is predicted to be nbar. A previous stellar occultation constrained the pressure at the limb, using two chords, to be nbar ( confidence level; Sicardy et al. (2011)). Increasing the chord density and reducing the threshold pressure for detection could lead to the detection of Eris’s local atmosphere with a future occultation.
6 Conclusions
The parameter is useful for estimating whether a sublimation atmosphere is in the global regime with approximately uniform surface pressure over the globe or in the local regime with significant horizontal pressure gradients. Based on this parameter, KBO Eris likely has a global, nitrogen atmosphere at perihelion and a local, nitrogen atmosphere at aphelion. The parameter (inverse Knudsen number) indicates that the atmosphere on Eris is probably always collisional.
A coupled thermal-transport numerical model developed to simulate thermal and volatile evolution in the local, collisional, sublimation atmosphere (LCSA) regime was introduced. The model conserves energy, mass, and momentum while maintaining vapor pressure equilibrium. It is adaptable to any LCSA, an atmospheric regime that occurs on Io and is expected on several objects in the Kuiper belt for parts of their orbits (Young and McKinnon, 2013).
The model results indicate that volatile transport (VT) on Eris, even at its aphelion distance of nearly 100 AU, can be significant. The nitrogen-ice temperatures are 30 K and vapor pressures are 10 nbar but the significant pressure gradients in the local atmosphere regime result in transport of nitrogen mass, that integrated over the long timescales associated with such a distant orbit, can be significant as compared to the column mass of the atmospheres of Triton and Pluto. Although Eris is 96 AU from the Sun in 2018, VT may result in changes in albedo or color that are observable with Earth-based telescopes. The model predictions for the atmospheric pressure may also be testable using a stellar occultation.
The thermal and volatile evolution in the LCSA regime depends sensitively on the thermal and transport model parameters. Bolometric Bond albedo, emissivity, rotation period, and rotation pole are important parameters for simulating VT on Eris that are not strongly constrained. Measurement of these parameters is encouraged.
Uniform collapse of a global sublimation atmosphere, that presumably existed on Eris when it was near perihelion, is probably not the primary reason for its anomalously high geometric albedo in the present epoch, when it is several decades past aphelion. This conclusion is true for most bolometric Bond albedos but since the VT depends sensitively on the thermal parameters, it does not hold for extremely high bolometric Bond albedos. The more general hypothesis of seasonal VT remains a plausible explanation for Eris’s anomalous albedo. Other geologic processes such as convection and glaciation that are now thought to be the primary processes renewing Pluto’s brightest surfaces (e.g., McKinnon et al. (2016); Moore et al. (2016)) are also plausible hypotheses for Eris’s high albedo.
Acknowledgements
Jason Hofgartner was supported by an appointment to the NASA Postdoctoral Program at the NASA Jet Propulsion Laboratory, California Institute of Technology administered by Universities Space Research Association through a contract with NASA. This work was inspired by the New Horizons exploration of Pluto. We thank two anonymous reviewers for their service and helpful comments.
References
References
- Brown and Schaller (2007) Brown, M. E., Schaller, E. L., Jun. 2007. The Mass of Dwarf Planet Eris. Science 316, 1585.
- Brown et al. (2005) Brown, M. E., Trujillo, C. A., Rabinowitz, D. L., Dec. 2005. Discovery of a Planetary-sized Object in the Scattered Kuiper Belt. The Astrophysical Journal 635, L97–L100.
- Buratti et al. (2011) Buratti, B. J., Bauer, J. M., Hicks, M. D., Hillier, J. K., Verbiscer, A., Hammel, H., Schmidt, B., Cobb, B., Herbert, B., Garsky, M., Ward, J., Foust, J., Apr. 2011. Photometry of Triton 1992-2004: Surface volatile transport and discovery of a remarkable opposition surge. Icarus 212, 835–846.
- Buratti et al. (2015) Buratti, B. J., Hicks, M. D., Dalba, P. A., Chu, D., O’Neill, A., Hillier, J. K., Masiero, J., Banholzer, S., Rhoades, H., May 2015. Photometry of Pluto 2008-2014: Evidence of Ongoing Seasonal Volatile Transport and Activity. Astrophysical Journal Letters 804, L6.
- Buratti et al. (2017) Buratti, B. J., Hofgartner, J. D., Hicks, M. D., Weaver, H. A., Stern, S. A., Momary, T., Mosher, J. A., Beyer, R. A., Verbiscer, A. J., Zangari, A. M., Young, L. A., Lisse, C. M., Singer, K., Cheng, A., Grundy, W., Ennico, K., Olkin, C. B., May 2017. Global albedos of Pluto and Charon from LORRI New Horizons observations. Icarus 287, 207–217.
- Carraro et al. (2006) Carraro, G., Maris, M., Bertin, D., Parisi, M. G., Dec. 2006. Time series photometry of the dwarf planet ERIS (2003 UB313). Astronomy and Astrophysics 460, L39–L42.
- Duffard et al. (2008) Duffard, R., Ortiz, J. L., Santos Sanz, P., Mora, A., Gutiérrez, P. J., Morales, N., Guirado, D., Mar. 2008. A study of photometric variations on the dwarf planet (136199) Eris. Astronomy and Astrophysics 479, 877–881.
- Fray and Schmitt (2009) Fray, N., Schmitt, B., Dec. 2009. Sublimation of ices of astrophysical interest: A bibliographic review. Planetary and Space Science 57, 2053–2080.
- Hansen and Paige (1992) Hansen, C. J., Paige, D. A., Oct. 1992. A thermal model for the seasonal nitrogen cycle on Triton. Icarus 99, 273–288.
- Hansen and Paige (1996) Hansen, C. J., Paige, D. A., Apr. 1996. Seasonal Nitrogen Cycles on Pluto. Icarus 120, 247–265.
- Hofgartner et al. (2018) Hofgartner, J. D., Buratti, B. J., Devins, S. L., Beyer, R. A., Schenk, P., Stern, S. A., Weaver, H. A., Olkin, C. B., Cheng, A., Ennico, K., Lauer, T. R., McKinnon, W. B., Spencer, J., Young, L. A., New Horizons Science Team, Mar. 2018. A search for temporal changes on Pluto and Charon. Icarus 302, 273–284.
- Ingersoll et al. (1985) Ingersoll, A. P., Summers, M. E., Schlipf, S. G., Dec. 1985. Supersonic meteorology of Io - Sublimation-driven flow of SO2. Icarus 64, 375–390.
- Johnson (1989) Johnson, R. E., Nov. 1989. Effect of irradiation on the surface of Pluto. Geophysical Research Letters 16, 1233–1236.
- Leighton and Murray (1966) Leighton, R. B., Murray, B. C., Jul. 1966. Behavior of Carbon Dioxide and Other Volatiles on Mars. Science 153, 136–144.
- Maris and Carraro (2008) Maris, M., Carraro, G., Nov. 2008. An analysis of the Eris (2003 UB313) light curve. Planetary and Space Science 56, 1874–1877.
- McKinnon et al. (2016) McKinnon, W. B., Nimmo, F., Wong, T., Schenk, P. M., White, O. L., Roberts, J. H., Moore, J. M., Spencer, J. R., Howard, A. D., Umurhan, O. M., Stern, S. A., Weaver, H. A., Olkin, C. B., Young, L. A., Smith, K. E., Beyer, R., Buie, M., Buratti, B., Cheng, A., Cruikshank, D., Dalle Ore, C., Gladstone, R., Grundy, W., Lauer, T., Linscott, I., Parker, J., Porter, S., Reitsema, H., Reuter, D., Robbins, S., Showalter, M., Singer, K., Strobel, D., Summers, M., Tyler, L., Banks, M., Barnouin, O., Bray, V., Carcich, B., Chaikin, A., Chavez, C., Conrad, C., Hamilton, D., Howett, C., Hofgartner, J., Kammer, J., Lisse, C., Marcotte, A., Parker, A., Retherford, K., Saina, M., Runyon, K., Schindhelm, E., Stansberry, J., Steffl, A., Stryk, T., Throop, H., Tsang, C., Verbiscer, A., Winters, H., Zangari, A., New Horizons Geology, G. a. I. T. T., Jun. 2016. Convection in a volatile nitrogen-ice-rich layer drives Pluto’s geological vigour. Nature 534, 82–85.
- Moore et al. (2016) Moore, J. M., McKinnon, W. B., Spencer, J. R., Howard, A. D., Schenk, P. M., Beyer, R. A., Nimmo, F., Singer, K. N., Umurhan, O. M., White, O. L., Stern, S. A., Ennico, K., Olkin, C. B., Weaver, H. A., Young, L. A., Binzel, R. P., Buie, M. W., Buratti, B. J., Cheng, A. F., Cruikshank, D. P., Grundy, W. M., Linscott, I. R., Reitsema, H. J., Reuter, D. C., Showalter, M. R., Bray, V. J., Chavez, C. L., Howett, C. J. A., Lauer, T. R., Lisse, C. M., Parker, A. H., Porter, S. B., Robbins, S. J., Runyon, K., Stryk, T., Throop, H. B., Tsang, C. C. C., Verbiscer, A. J., Zangari, A. M., Chaikin, A. L., Wilhelms, D. E., Bagenal, F., Gladstone, G. R., Andert, T., Andrews, J., Banks, M., Bauer, B., Bauman, J., Barnouin, O. S., Bedini, P., Beisser, K., Bhaskaran, S., Birath, E., Bird, M., Bogan, D. J., Bowman, A., Brozovic, M., Bryan, C., Buckley, M. R., Bushman, S. S., Calloway, A., Carcich, B., Conard, S., Conrad, C. A., Cook, J. C., Custodio, O. S., Ore, C. M. D., Deboy, C., Dischner, Z. J. B., Dumont, P., Earle, A. M., Elliott, H. A., Ercol, J., Ernst, C. M., Finley, T., Flanigan, S. H., Fountain, G., Freeze, M. J., Greathouse, T., Green, J. L., Guo, Y., Hahn, M., Hamilton, D. P., Hamilton, S. A., Hanley, J., Harch, A., Hart, H. M., Hersman, C. B., Hill, A., Hill, M. E., Hinson, D. P., Holdridge, M. E., Horanyi, M., Jackman, C., Jacobson, R. A., Jennings, D. E., Kammer, J. A., Kang, H. K., Kaufmann, D. E., Kollmann, P., Krimigis, S. M., Kusnierkiewicz, D., Lee, J. E., Lindstrom, K. L., Lunsford, A. W., Mallder, V. A., Martin, N., McComas, D. J., McNutt, R. L., Mehoke, D., Mehoke, T., Melin, E. D., Mutchler, M., Nelson, D., Nunez, J. I., Ocampo, A., Owen, W. M., Paetzold, M., Page, B., Parker, J. W., Pelletier, F., Peterson, J., Pinkine, N., Piquette, M., Protopapa, S., Redfern, J., Roberts, J. H., Rogers, G., Rose, D., Retherford, K. D., Ryschkewitsch, M. G., Schindhelm, E., Sepan, B., Soluri, M., Stanbridge, D., Steffl, A. J., Strobel, D. F., Summers, M. E., Szalay, J. R., Tapley, M., Taylor, A., Taylor, H., Tyler, G. L., Versteeg, M. H., Vincent, M., Webbert, R., Weidner, S., Weigle, G. E., Whittenburg, K., Williams, B. G., Williams, K., Williams, S., Woods, W. W., Zirnstein, E., Mar. 2016. The geology of Pluto and Charon through the eyes of New Horizons. Science 351, 1284–1293.
- Olkin et al. (2015) Olkin, C. B., Young, L. A., Borncamp, D., Pickles, A., Sicardy, B., Assafin, M., Bianco, F. B., Buie, M. W., de Oliveira, A. D., Gillon, M., French, R. G., Ramos Gomes, A., Jehin, E., Morales, N., Opitom, C., Ortiz, J. L., Maury, A., Norbury, M., Braga-Ribas, F., Smith, R., Wasserman, L. H., Young, E. F., Zacharias, M., Zacharias, N., Jan. 2015. Evidence that Pluto’s atmosphere does not collapse from occultations including the 2013 May 04 event. Icarus 246, 220–225.
- Rabinowitz and Owainati (2014) Rabinowitz, D. L., Owainati, Y., Nov. 2014. The synchronous rotations of Eris/Dysnomia and Orcus/Vanth binary systems. In: AAS/Division for Planetary Sciences Meeting Abstracts #46. Vol. 46 of AAS/Division for Planetary Sciences Meeting Abstracts. p. 510.07.
- Robbins et al. (2017) Robbins, S. J., Singer, K. N., Bray, V. J., Schenk, P., Lauer, T. R., Weaver, H. A., Runyon, K., McKinnon, W. B., Beyer, R. A., Porter, S., White, O. L., Hofgartner, J. D., Zangari, A. M., Moore, J. M., Young, L. A., Spencer, J. R., Binzel, R. P., Buie, M. W., Buratti, B. J., Cheng, A. F., Grundy, W. M., Linscott, I. R., Reitsema, H. J., Reuter, D. C., Showalter, M. R., Tyler, G. L., Olkin, C. B., Ennico, K. S., Stern, S. A., New Horizons Lorri, M. I. T., May 2017. Craters of the Pluto-Charon system. Icarus 287, 187–206.
- Roe et al. (2008) Roe, H. G., Pike, R. E., Brown, M. E., Dec. 2008. Tentative detection of the rotation of Eris. Icarus 198, 459–464.
- Sanchez-Lavega (2011) Sanchez-Lavega, A., 2011. An Introduction to Planetary Atmospheres.
- Schaller and Brown (2007) Schaller, E. L., Brown, M. E., Apr. 2007. Volatile Loss and Retention on Kuiper Belt Objects. The Astrophysical Journal 659, L61–L64.
- Scott (1976) Scott, T. A., Sep. 1976. Solid and liquid nitrogen. Physics Reports 27, 89–157.
- Sheppard (2007) Sheppard, S. S., Aug. 2007. Light Curves of Dwarf Plutonian Planets and other Large Kuiper Belt Objects: Their Rotations, Phase Functions, and Absolute Magnitudes. The Astronomical Journal 134, 787–798.
- Sicardy et al. (2011) Sicardy, B., Ortiz, J. L., Assafin, M., Jehin, E., Maury, A., Lellouch, E., Hutton, R. G., Braga-Ribas, F., Colas, F., Hestroffer, D., Lecacheux, J., Roques, F., Santos-Sanz, P., Widemann, T., Morales, N., Duffard, R., Thirouin, A., Castro-Tirado, A. J., Jelínek, M., Kubánek, P., Sota, A., Sánchez-Ramírez, R., Andrei, A. H., Camargo, J. I. B., da Silva Neto, D. N., Gomes, A. R., Martins, R. V., Gillon, M., Manfroid, J., Tozzi, G. P., Harlingten, C., Saravia, S., Behrend, R., Mottola, S., Melendo, E. G., Peris, V., Fabregat, J., Madiedo, J. M., Cuesta, L., Eibe, M. T., Ullán, A., Organero, F., Pastor, S., de Los Reyes, J. A., Pedraz, S., Castro, A., de La Cueva, I., Muler, G., Steele, I. A., Cebrián, M., Montañés-Rodríguez, P., Oscoz, A., Weaver, D., Jacques, C., Corradi, W. J. B., Santos, F. P., Reis, W., Milone, A., Emilio, M., Gutiérrez, L., Vázquez, R., Hernández-Toledo, H., Oct. 2011. A Pluto-like radius and a high albedo for the dwarf planet Eris from an occultation. Nature 478, 493–496.
- Stansberry et al. (2008) Stansberry, J., Grundy, W., Brown, M., Cruikshank, D., Spencer, J., Trilling, D., Margot, J.-L., 2008. Physical Properties of Kuiper Belt and Centaur Objects: Constraints from the Spitzer Space Telescope. pp. 161–179.
- Stern et al. (2015) Stern, S. A., Bagenal, F., Ennico, K., Gladstone, G. R., Grundy, W. M., McKinnon, W. B., Moore, J. M., Olkin, C. B., Spencer, J. R., Weaver, H. A., Young, L. A., Andert, T., Andrews, J., Banks, M., Bauer, B., Bauman, J., Barnouin, O. S., Bedini, P., Beisser, K., Beyer, R. A., Bhaskaran, S., Binzel, R. P., Birath, E., Bird, M., Bogan, D. J., Bowman, A., Bray, V. J., Brozovic, M., Bryan, C., Buckley, M. R., Buie, M. W., Buratti, B. J., Bushman, S. S., Calloway, A., Carcich, B., Cheng, A. F., Conard, S., Conrad, C. A., Cook, J. C., Cruikshank, D. P., Custodio, O. S., Dalle Ore, C. M., Deboy, C., Dischner, Z. J. B., Dumont, P., Earle, A. M., Elliott, H. A., Ercol, J., Ernst, C. M., Finley, T., Flanigan, S. H., Fountain, G., Freeze, M. J., Greathouse, T., Green, J. L., Guo, Y., Hahn, M., Hamilton, D. P., Hamilton, S. A., Hanley, J., Harch, A., Hart, H. M., Hersman, C. B., Hill, A., Hill, M. E., Hinson, D. P., Holdridge, M. E., Horanyi, M., Howard, A. D., Howett, C. J. A., Jackman, C., Jacobson, R. A., Jennings, D. E., Kammer, J. A., Kang, H. K., Kaufmann, D. E., Kollmann, P., Krimigis, S. M., Kusnierkiewicz, D., Lauer, T. R., Lee, J. E., Lindstrom, K. L., Linscott, I. R., Lisse, C. M., Lunsford, A. W., Mallder, V. A., Martin, N., McComas, D. J., McNutt, R. L., Mehoke, D., Mehoke, T., Melin, E. D., Mutchler, M., Nelson, D., Nimmo, F., Nunez, J. I., Ocampo, A., Owen, W. M., Paetzold, M., Page, B., Parker, A. H., Parker, J. W., Pelletier, F., Peterson, J., Pinkine, N., Piquette, M., Porter, S. B., Protopapa, S., Redfern, J., Reitsema, H. J., Reuter, D. C., Roberts, J. H., Robbins, S. J., Rogers, G., Rose, D., Runyon, K., Retherford, K. D., Ryschkewitsch, M. G., Schenk, P., Schindhelm, E., Sepan, B., Showalter, M. R., Singer, K. N., Soluri, M., Stanbridge, D., Steffl, A. J., Strobel, D. F., Stryk, T., Summers, M. E., Szalay, J. R., Tapley, M., Taylor, A., Taylor, H., Throop, H. B., Tsang, C. C. C., Tyler, G. L., Umurhan, O. M., Verbiscer, A. J., Versteeg, M. H., Vincent, M., Webbert, R., Weidner, S., Weigle, G. E., White, O. L., Whittenburg, K., Williams, B. G., Williams, K., Williams, S., Woods, W. W., Zangari, A. M., Zirnstein, E., Oct. 2015. The Pluto system: Initial results from its exploration by New Horizons. Science 350, aad1815.
- Stern et al. (1988) Stern, S. A., Trafton, L. M., Gladstone, G. R., Sep. 1988. Why is Pluto bright? Implications of the albedo and lightcurve behavior of Pluto. Icarus 75, 485–498.
- Tegler et al. (2010) Tegler, S. C., Cornelison, D. M., Grundy, W. M., Romanishin, W., Abernathy, M. R., Bovyn, M. J., Burt, J. A., Evans, D. E., Maleszewski, C. K., Thompson, Z., Vilas, F., Dec. 2010. Methane and Nitrogen Abundances on Pluto and Eris. The Astrophysical Journal 725, 1296–1305.
- Trafton and Stern (1983) Trafton, L., Stern, S. A., Apr. 1983. On the global distribution of Pluto’s atmosphere. Astrophysical Journal 267, 872–881.
- Young and McKinnon (2013) Young, L., McKinnon, W. B., Oct. 2013. Atmospheres on Volatile-Bearing Kuiper Belt Objects. In: AAS/Division for Planetary Sciences Meeting Abstracts. Vol. 45 of AAS/Division for Planetary Sciences Meeting Abstracts. p. 507.02.
- Young (2013) Young, L. A., Apr. 2013. Pluto’s Seasons: New Predictions for New Horizons. The Astrophysical Journal Letters 766, L22.
- Young (2017) Young, L. A., Mar. 2017. Volatile transport on inhomogeneous surfaces: II. Numerical calculations (VT3D). Icarus 284, 443–476.
- Young et al. (2018) Young, L. A., Kammer, J. A., Steffl, A. J., Gladstone, G. R., Summers, M. E., Strobel, D. F., Hinson, D. P., Stern, S. A., Weaver, H. A., Olkin, C. B., Ennico, K., McComas, D. J., Cheng, A. F., Gao, P., Lavvas, P., Linscott, I. R., Wong, M. L., Yung, Y. L., Cunningham, N., Davis, M., Parker, J. W., Schindhelm, E., Siegmund, O. H. W., Stone, J., Retherford, K., Versteeg, M., Jan. 2018. Structure and composition of Pluto’s atmosphere from the New Horizons solar ultraviolet occultation. Icarus 300, 174–199.
Copyright 2018. All rights reserved.