Evidence of a flat outer rotation curve in a starbursting disk galaxy at
Abstract
Observations of the baryon to dark matter fraction in galaxies through cosmic time are a fundamental test for galaxy formation models. Recent observational studies have suggested that some disk galaxies at host declining rotation curves, in contrast with observations of low redshift disk galaxies where stellar or HI rotation curves flatten at large radii. We present an observational counterexample, a galaxy named DSFG850.95 at (4.1 Gyr after the big bang) that hosts a flat rotation curve between radii of 6–14 kpc (1.2–2.8 disk scale lengths) and has a dark matter fraction of at the H-band half light radius, similar to the Milky Way. We create position-velocity and position-dispersion diagrams using Keck/MOSFIRE spectroscopic observations of H and [NII] emission features, which reveal a flat rotation velocity of km s-1 and an ionized gas velocity dispersion of km s-1. This galaxy has a rotation-dominated velocity field with . Ground-based H-band imaging reveals a disk with Sérsic index of , an edge-on inclination angle of , and an H-band half light radius of kpc. Our results point to DSFG850.95 being a massive, rotationally-supported disk galaxy with a high dark-matter-to-baryon fraction in the outer galaxy, similar to disk galaxies at low redshift.
Subject headings:
galaxies: kinematics and dynamics — galaxies: high-redshift — galaxies: evolution1. Introduction
In the standard CDM model of the Universe, the baryonic and dark matter components of galaxies grow in tandem from high to low redshift (e.g. White & Rees, 1978). Galactic rotation curves are an important observational probe of these matter distributions in galaxies (see Sofue & Rubin, 2001, for a brief review). Through Keplerian inference, rotation curves provide a direct method for measuring the mass enclosed within a galactocentric radius. When combined with a light profile and a mass-to-light ratio, one may estimate the distribution of dark matter in a galaxy (e.g. Carignan & Freeman, 1985; van Albada et al., 1985; Kassin et al., 2006; de Blok et al., 2008; Korsaga et al., 2018).
At low redshift (), disk galaxy rotation curves are seen to rise sharply in the inner few kpc and then flatten to a near-constant velocity (e.g. Rubin et al., 1978; McGaugh, 2016). This is caused by baryons dominating the mass density in the inner regions of galaxies while dark matter dominates in the outer regions (Kassin et al., 2006; Courteau et al., 2007; Dutton et al., 2007; Barnabè et al., 2012; Cappellari et al., 2013; Dutton et al., 2013; Martinsson et al., 2013a, b; Courteau & Dutton, 2015). Recent observational studies have begun to push galaxy rotation curve measurements to larger radii at 1 and while some find flat rotation curves (e.g. Di Teodoro et al., 2016, 2018; Xue et al., 2018), others, intriguingly, find evidence of decreasing outer-galaxy rotation curves (Lang et al., 2017; Genzel et al., 2017). These studies attribute this to a combination of decreased dark matter in galaxies at intermediate redshifts as well as increased pressure support in the outer disks. It is common for low redshift disk galaxies to show an initial decline before flattening in the outer disk (e.g. Rubin et al., 1965, 1978; McGaugh, 2016), but the low or negligible inferred dark-matter-to-total mass fractions in the Lang et al. and Genzel et al. samples imply that these initial declines will not begin to flatten if detected at higher radii.
Some studies find lower dark matter fractions in galaxies at 1 than at (Förster Schreiber et al., 2009; Price et al., 2016; Burkert et al., 2016; Wuyts et al., 2016) while others find no evolution (Stott et al., 2016; Yuan et al., 2017; Di Teodoro et al., 2016). Many of these works rely on inverting scaling relations with significant scatter, such as the Kennicutt-Schmidt relation (Kennicutt, 1998), in order to estimate gas masses. This may be the source of disagreement. There is much greater agreement among many of these studies when comparing the stellar to the total masses of the galaxies (See also Pelliccia et al., 2017).
Different simulations also make different predictions about the shapes of rotation curves at . Teklu et al. (2018) find 38% of disk galaxies with M⊙ at in the cosmological hydrodynamic simulation, Magneticum Pathfinder (K. Dolag et al., in preparation) have declining rotation beyond 4 kpc (as estimated from Figure 4 in Teklu et al. 2018). In contrast, the IllustrisTNG cosmological hydrodynamic simulations (Lovell et al., 2018) show initially declining rotation curves at that gradually flatten in the outer disk, similar to low- disk galaxies. It is clear that more observations of the outer rotation curves of high redshift galaxies and their dark matter fractions are needed to puzzle out the evolution of dark matter fractions with time.
In this paper we present the serendipitously acquired rotation curve for a known dusty star forming galaxy at , detected in H to a high galactocentric radius of 14 kpc. The galaxy exhibits a flat rotation curve, well-fit by an arctangent profile and a dark matter fraction at 14 kpc typical of disk galaxies at . The paper is organized as follows. Section 2 details the observations and data reduction, Section 3 discusses the kinematic modeling, Section 4 details the dynamical and stellar mass estimations, and Section 5 presents our conclusions. Throughout this work we adopt a Planck cosmology with H km s-1 Mpc-1 and (Planck Collaboration et al., 2016). We assume a Chabrier initial mass function (IMF; Chabrier 2003).
2. Observations and Data Reduction
The data were obtained with the Multi-Object Spectrometer For Infra-Red Exploration (MOSFIRE; McLean et al. 2010, 2012) on Keck I as part of an observational campaign to follow up a sample of 450 m- and 850 m-identified dusty star forming galaxies (DSFGs; for sample details see Casey et al., 2013, 2017). DSFGs comprise the most intense star-bursting galaxies in the Universe (See reviews by Blain et al. 2002 and Casey, Narayanan, & Cooray 2014).
Observations were made on 2013 December 31 with the full width at half maximum (FWHM) of seeing between 08–09, as measured by the telescope focus routine, MIRA. We adopt an average seeing of throughout this work. The galaxy, DSFG850.95, was observed in the H band for a total integration time of 1920 s with the slit width set to . An 15 ABBA nod pattern was used and the slit orientation was randomly placed with respect to our target due to position angle optimization driven by multiplexing. Additional observational details are described for the full parent sample in Casey et al. (2017).
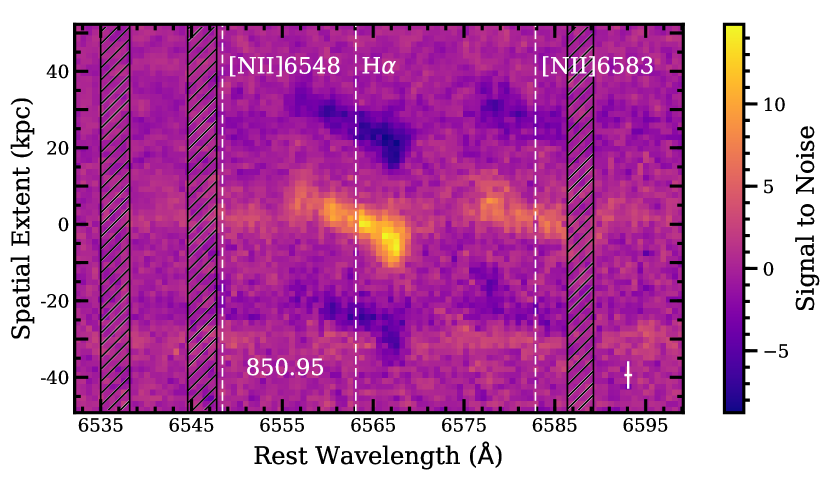
The data were reduced with the MOSPY data reduction pipeline111http://keck-datareductionpipelines.github.io/MosfireDRP/. Figure 1 plots the reduced 2D signal to noise spectrum of DSFG850.95 showing H, [NII], and continuum emission. An unrelated foreground galaxy at photometric redshift of 0.7, COSMOS 2004241 (Capak et al., 2007), sits a projected 35 to the south of DSFG850.95 and is seen in faint continuum emission in Figure 1 at spatial extent kpc. It does not affect the analysis of DSFG850.95’s rotation curve.
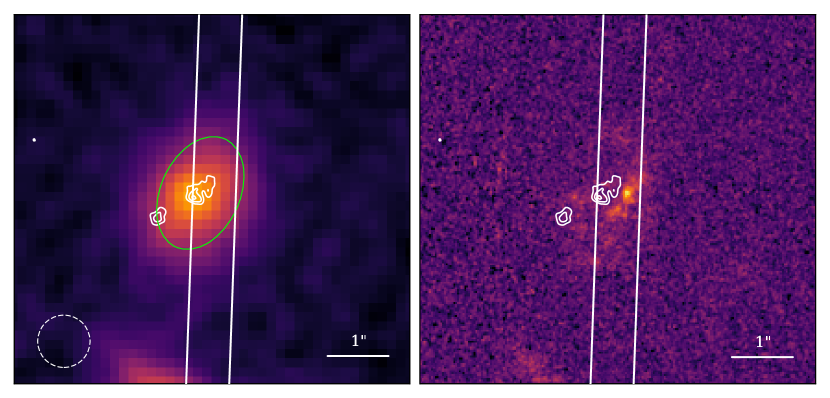
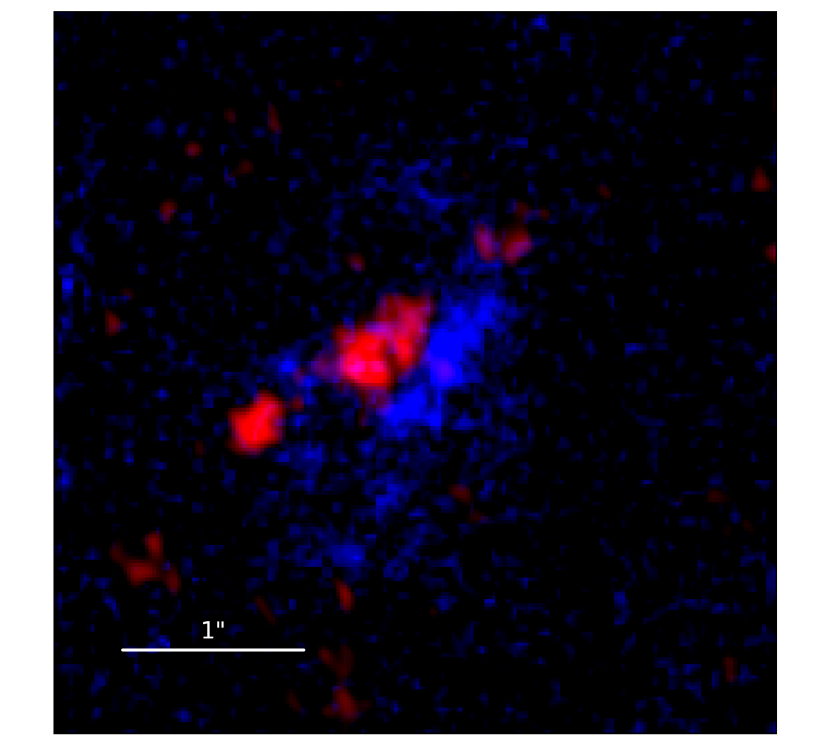
The left panel of Figure 2 shows H-band imaging (rest-frame 6400 Å), MOSFIRE slit, and ALMA 870 m dust continuum contours of DSFG850.95. The H-band FWHM of seeing was comparable to that of the MOSFIRE observations and is shown as the dashed circle. The green ellipse shows the H-band half-light radius. There is a misalignment between the position angles of the H-band exponential disk fit and the slit of , which should not strongly affect our measured radial velocities. We will discuss this further in subsection 3.1. The right panel of Figure 2 shows Hubble imaging in the F814W filter, at a rest-frame effective wavelength of 3200 Å. The centroid of UltraVISTA K-band emission was used for the slit targeting position (rest-frame 8600 Å). It shares the same positional centroid as the H-band image in the left panel of Figure 2, however the slit was slightly offset from the intended target position. The seeing on the night of the MOSFIRE observation is much larger than this offset, and is large enough to cause emission originating from positions outside the slit to be probed by the slit. This offset, therefore, does not strongly affect our analysis. Additionally, the rest-frame UV emission, which expected to originate in the same regions as the H emission is well-probed by the slit, though it is more highly extincted than the H emission. The offset between the HST and dust emission centroids does demonstrate the importance of dust obscuration in this dusty star forming galaxy, however. Figure 3 shows another look at the HST I-band imaging in blue with ALMA 870 m dust continuum in red.
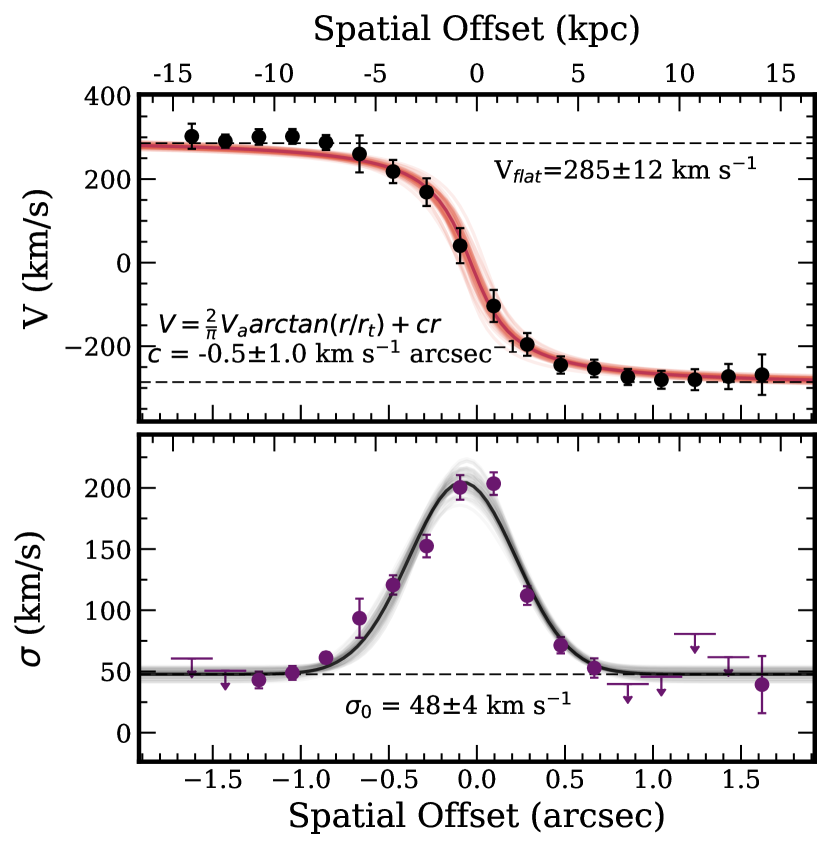
We extracted 1D spectra from the MOSFIRE data using the iraf222iraf is distributed by the National Optical Astronomy Observatories, which are operated by the Association of Universities for Research in Astronomy, Inc., under cooperative agreement with the National Science Foundation routine apall. Apertures of extraction were placed on each pixel across the galaxy with a radius equal to half the average seeing. Spectra were extracted with variance weighting. Radial velocities and velocity dispersions were measured from the extracted spectra using the splot fitting routine in iraf. We fit H, [NII], and [NII] simultaneously with fixed spacing between spectral features and tied but variable emission line full widths at half maximum (FWHM). Pixels contaminated with telluric line emission were omitted from the fits and errors in the best-fit parameters were estimated using 1000 Monte Carlo perturbations of the data by typical sky noise. Figure 4 shows the position-velocity and position-dispersion diagrams measured from these fits. The velocity curve (upper panel), corrected for galaxy inclination angle (see subsection 3.1 for details), rises steeply in the inner few kpc and then flattens to a near-constant velocity in the outer regions of the galaxy. The dispersion curve (lower panel) is centrally peaked due to the effect of beam smearing.
3. Kinematic Model
We model the rotational velocity, , and velocity dispersion, of DSFG850.95 following the method employed by e.g. Courteau (1997); Weiner et al. (2006), modified to allow for the parameterization of a possible decline in rotational velocity at high galactocentric radii. The model assumes the intrinsic rotation curve follows a modified arctan function of the form:
| (1) |
where is the asymptotic velocity, is the knee radius, is the distance from the center of the galaxy, and is the outer-galaxy slope which allows us to quantify the degree to which the rotation curve increases, flattens, or decreases.
We also measure an isotropic ionized gas velocity dispersion for the entire galaxy, , which is taken to be the vertical offset of a Gaussian fitted to the position-dispersion data in the bottom panel of Figure 4:
| (2) |
where is the value of the fitted Gaussian at each , is the amplitude, is the distance from the center of the galaxy, is the central position, is the width of the Gaussian, and is the the isotropic velocity dispersion. We choose as the representative dispersion for DSFG850.95 because it is the value the velocity dispersion approaches in the outer galaxy where beam smearing has less of an effect. Beam smearing is well known to artificially increase the observed velocity dispersion toward the centers of galaxies due to the rise in the rotation curve (e.g. Bosma, 1978; Weiner et al., 2006; Di Teodoro & Fraternali, 2015), but has less of an effect at higher galactocentric radii.
| Property | Value |
|---|---|
| 1.555 | |
| 333Average of flat rotation on both sides of DSFG850.95. | km s-1 |
| km s-1 | |
| 6 | |
| P.A.444Position angle offset between slit and H-band semi-major axis. | |
| n555Sérsic Index. | |
| 666Inclination angle. | |
| kpc | |
| kpc | |
| 777Maximum detected radius of H. | kpc |
| SFR | M⊙ yr-1 |
| M⋆ | () M⊙ |
| M | () |
| Mdyn(14 kpc) | (2.70.3) M⊙ |
| Mdyn(R1/2) | (1.90.1) M⊙ |
| (R1/2) |
We correct the observed velocity dispersions for the intrinsic instrumental dispersion prior to fitting using the equation: where is the velocity dispersion reported in Figure 4, is the FWHM of the emission line divided by 2.355 and is the combined instrumental and spectral seeing dispersion, taken to be the average width of several telluric lines measured across the unreduced spectrum ( km s-1). The reported error on is the standard deviation in the mean of the measured telluric line widths and are folded into the errors in velocity dispersion in Figure 4. Measured velocity dispersions that are less than the instrumental dispersion are unreliable because small errors on the observed dispersion correspond to large changes in the inferred physical dispersion (Weiner et al., 2006). Dispersions measured below the instrumental seeing are plotted as upper limits at 2 significance in the bottom panel of Figure 4 and are excluded from the dispersion curve fits, though their central wavelengths are still fitted for the velocity curve.
We fit the position-velocity and position-dispersion data with the pymc3 python package for Markov Chain Monte Carlo (MCMC; Salvatier et al. 2016) so that we may characterize the posterior probability distributions of our fit parameters. The light red curves in the top panel of Figure 4 show fifty randomly-chosen MC fits and the best-fit curve is plotted in dark red. The best-fit value of asymptotic velocity is km s-1, the knee radius is or kpc, and the outer slope is km s-1 arcsec-1, which is consistent with a flat slope. The best-fit velocity curve is still seen to be rising at the radius of the outermost datapoint. There is no evidence of a velocity turnover with declining rotation. The average velocity of the flat portion, taken to be the average of the datapoints between radii of 6–14 kpc, corresponding to 1.2–2.8 disk scale lengths, is km s-1.
The bottom panel of Figure 4 shows the measured velocity dispersion data with fifty randomly-selected MC fits overplotted in grey with the best-fit curve in black. The best-fit dispersion, , is 484 km s-1, typical of mildly turbulent disk galaxies at (e.g. Wright et al., 2007; Law et al., 2009; Epinat et al., 2012; Contini et al., 2012; Wisnioski et al., 2015; Simons et al., 2017).
3.1. H-Band Light Profile Fitting
Using the 2D image fitting code, GALFIT (Peng et al., 2002), we fit a Sérsic profile (Sérsic, 1963) to H-band imaging of DSFG850.95 from the UltraVISTA survey (McCracken et al., 2012, see Figure 2, above).
The fit reveals a Sérsic index of , implying an exponential disk light profile. Adding a second Sérsic component to fit a bulge causes significantly worse fits. The H-band half-light radius is kpc, or using the relation , the disk scale radius is kpc and kpc. We divide the velocities in the top panel of Figure 4 by to correct for galaxy inclination, assuming an intrinsic edge-on axis ratio of 0.25 (Wuyts et al., 2016). From our best-fit axis ratio, , we determine the galaxy has an approximately edge-on inclination of using the equation (e.g. Wuyts et al., 2016):
| (3) |
Table 1 summarizes the physical characteristics of DSFG850.95 from GALFIT and our other analyses.
There is a misalignment of between the position angles of the H-band semi-major axis and the slit. Large misalignments would result in an underprediction of the maximum rotational velocity of a galaxy, however Weiner et al. (2006) shows that the average decrease in observed rotational velocities for a slit misalignment of is small — approximately the same as the error on our measurement of .
The H-band imaging, together with the rotational velocity and velocity dispersion analyses in section 3 suggest DSFG850.95 is a rotationally-dominated disk galaxy at that is similar to massive disk galaxies at low redshift.
4. Dynamical, Stellar, Gas, and Dark Matter Masses
Our radial velocity measurements as a function of radius, corrected for galaxy inclination and ionized gas velocity dispersion support allow us to measure the total mass enclosed as a function of radius in the galaxy using the equation (e.g. Erb et al., 2003; Swinbank et al., 2004; van Starkenburg et al., 2008; Epinat et al., 2009; Di Teodoro et al., 2018):
| (4) |
where is the gravitational constant, is the galactocentric radius, and is the circular velocity, given by:
| (5) |
where is the inclination-corrected rotational velocity, (measured to be 484 km s-1) is the isotropic ionized gas velocity dispersion, and is the exponential disk scale length measured from H-band imaging. The median difference between the rotational and circular velocities is 2%, since is small compared to .
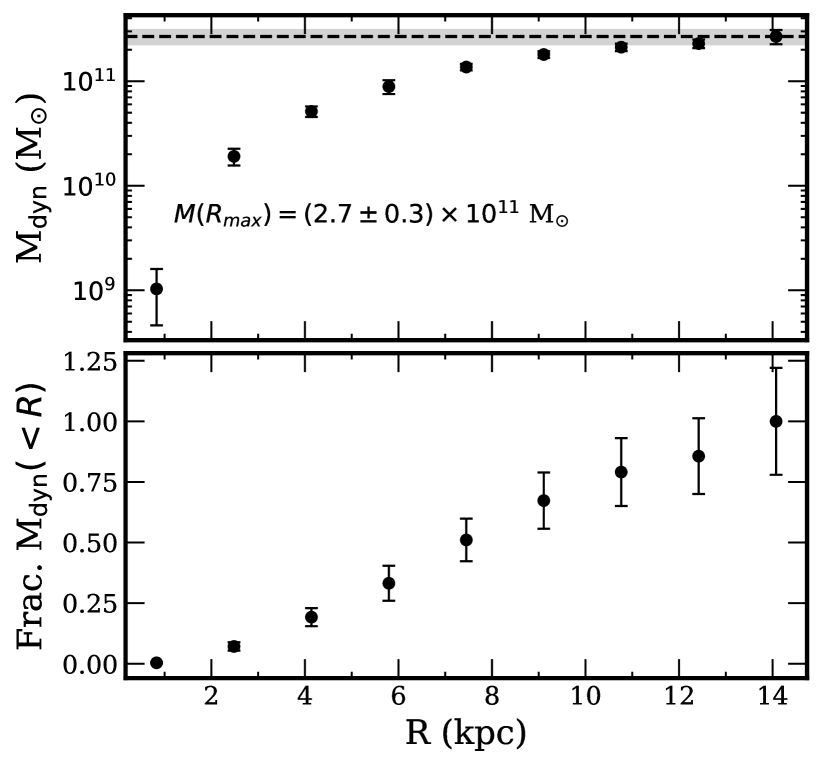
The top panel of Figure 5 shows the dynamical mass as a function of radius. The total dynamical mass enclosed within the H-band half light radius is M⊙, and within 14 kpc is M⊙. The horizontal dashed line and shaded region in the top panel of Figure 5 marks the maximum dynamical mass and its associated error. The bottom panel of Figure 5 shows the fraction of dynamical mass enclosed by radius.
Next we compare the dynamical mass at the half light radius with stellar and gas masses. Casey et al. (2017) uses MAGPHYS with the high- extension (da Cunha et al., 2008, 2015) to fit UV through sub-mm ancillary photometry from the COSMOS collaboration (Capak et al., 2007; Laigle et al., 2016) and finds a stellar mass of M⊙. We follow the procedure of Hainline et al. (2011) for similarly-selected DSFGs at similar redshifts to derive a more conservative error than Casey et al. We take the error to be half the difference between the stellar mass estimated with an instantaneous burst history and that estimated with a continuous star formation history. Thus, we arrive at a total stellar mass of M⊙. Table 1 summarizes all the estimated and measured parameters of this galaxy.
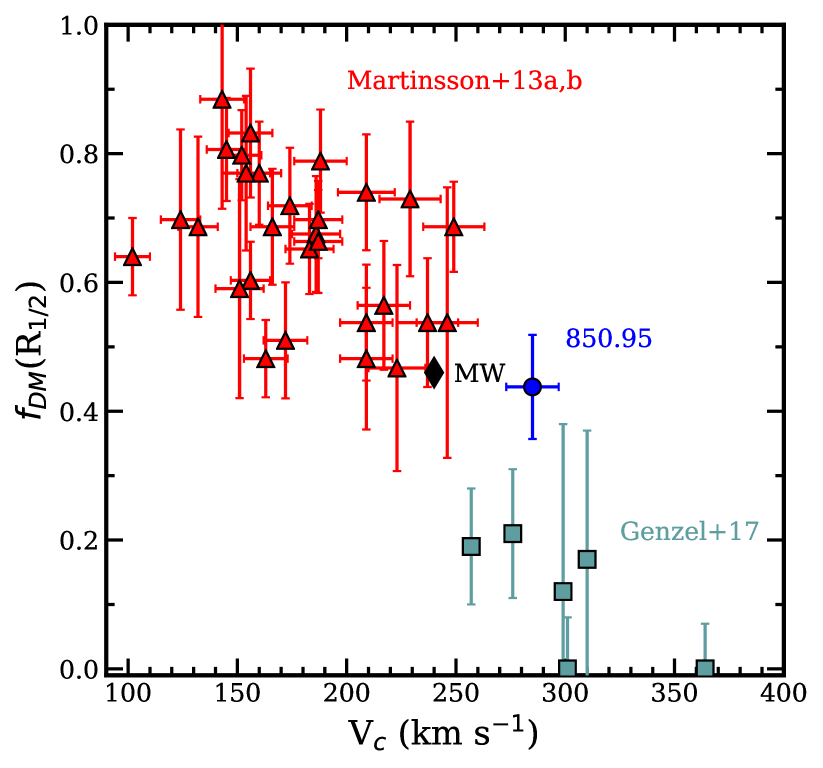
Following the prescription of Scoville et al. (2016) we use our ALMA 870 m dust continuum observations to estimate a molecular gas mass of M⊙, all of which is contained within the half light radius. We calculate the dark matter fraction at the half light radius using the equation:
| (6) |
where is half of the total stellar mass, is the gas mass, and is the dynamical mass at the half light radius. We find . Figure 6 shows the dark matter fraction as a function of circular velocities for a few studies in the literature (Martinsson et al., 2013a, b; Bland-Hawthorn & Gerhard, 2016; Genzel et al., 2017). DSFG850.95 has a dark matter fraction closer to that of the Milky Way than the galaxies in Genzel et al. (2017), though it has a higher rotational velocity than the Milky Way.
We conclude by noting that our finding of a flat rotation curve may not be inconsistent with the conclusions of Lang et al. (2017). The majority of disk galaxies in cosmological hydrodynamic simulations by Teklu et al. (2018) exhibit flat rotation curves with only 38% hosting declining rotation curves. Lang et al. (2017) split their data out into two subsamples according to the degree of pressure support, one with and the other . They define as the intrinsic, inclination corrected peak rotation velocity and as the intrinsic velocity dispersion, both equivalent to our and . The galaxies with less pressure support () have flatter outer rotation curves than those with more pressure support, supporting the conclusion that much of the observed velocity decrease in their sample is due to increased pressure support. Our rotation curve, with a is consistent with their stacked curve of galaxies with . A statistical sample of galaxy rotation curves detected well beyond 10 kpc is needed to determine the fraction of flat or declining rotation curves at high redshift.
5. Summary
Recent observations of disk galaxy rotation curves have found declining rotational velocities beyond 2.2 exponential disk scale lengths, implying intermediate redshift disk galaxies have lower dark matter fractions than galaxies as well as increased velocity dispersion support.
In this paper we present a clear counterexample from MOSFIRE observations of H and [NII] emission in the disk galaxy, DSFG850.95, showing a flat rotation curve between 6–14 kpc (1.2–2.8 disk scale lengths), well-fit by an arctangent function. At the H-band half light radius we estimate the dark matter fraction to be based on UV-through-sub-mm photometry and 870 m dust continuum observations. Ground-based H-band imaging reveals a sersic index of and an edge-on inclination angle. Taken together, these data suggest DSFG850.95 is a massive, rotationally supported disk galaxy in place by (4.1 Gyr after the big bang) with a flat rotation curve and a dark matter fraction at the half light radius, similar to low redshift disk galaxies.
References
- Barnabè et al. (2012) Barnabè, M., Dutton, A. A., Marshall, P. J., et al. 2012, MNRAS, 423, 1073
- Blain et al. (2002) Blain, A. W., Smail, I., Ivison, R. J., Kneib, J.-P., & Frayer, D. T. 2002, Phys. Rep., 369, 111
- Bland-Hawthorn & Gerhard (2016) Bland-Hawthorn, J., & Gerhard, O. 2016, ARA&A, 54, 529
- Bosma (1978) Bosma, A. 1978, PhD thesis, PhD Thesis, Groningen Univ., (1978)
- Burkert et al. (2016) Burkert, A., Förster Schreiber, N. M., Genzel, R., et al. 2016, ApJ, 826, 214
- Capak et al. (2007) Capak, P., Aussel, H., Ajiki, M., et al. 2007, ApJS, 172, 99
- Cappellari et al. (2013) Cappellari, M., McDermid, R. M., Alatalo, K., et al. 2013, MNRAS, 432, 1862
- Carignan & Freeman (1985) Carignan, C., & Freeman, K. C. 1985, ApJ, 294, 494
- Casey et al. (2014) Casey, C. M., Narayanan, D., & Cooray, A. 2014, Phys. Rep., 541, 45
- Casey et al. (2013) Casey, C. M., Chen, C.-C., Cowie, L. L., et al. 2013, MNRAS, 436, 1919
- Casey et al. (2017) Casey, C. M., Cooray, A., Killi, M., et al. 2017, ApJ, 840, 101
- Chabrier (2003) Chabrier, G. 2003, PASP, 115, 763
- Contini et al. (2012) Contini, T., Garilli, B., Le Fèvre, O., et al. 2012, A&A, 539, A91
- Courteau (1997) Courteau, S. 1997, AJ, 114, 2402
- Courteau & Dutton (2015) Courteau, S., & Dutton, A. A. 2015, ApJ, 801, L20
- Courteau et al. (2007) Courteau, S., Dutton, A. A., van den Bosch, F. C., et al. 2007, ApJ, 671, 203
- da Cunha et al. (2008) da Cunha, E., Charlot, S., & Elbaz, D. 2008, MNRAS, 388, 1595
- da Cunha et al. (2015) da Cunha, E., Walter, F., Smail, I. R., et al. 2015, ApJ, 806, 110
- de Blok et al. (2008) de Blok, W. J. G., Walter, F., Brinks, E., et al. 2008, AJ, 136, 2648
- Di Teodoro & Fraternali (2015) Di Teodoro, E. M., & Fraternali, F. 2015, MNRAS, 451, 3021
- Di Teodoro et al. (2016) Di Teodoro, E. M., Fraternali, F., & Miller, S. H. 2016, A&A, 594, A77
- Di Teodoro et al. (2018) Di Teodoro, E. M., Grillo, C., Fraternali, F., et al. 2018, MNRAS, arXiv:1801.06546
- Dutton et al. (2007) Dutton, A. A., van den Bosch, F. C., Dekel, A., & Courteau, S. 2007, ApJ, 654, 27
- Dutton et al. (2013) Dutton, A. A., Treu, T., Brewer, B. J., et al. 2013, MNRAS, 428, 3183
- Epinat et al. (2009) Epinat, B., Contini, T., Le Fèvre, O., et al. 2009, A&A, 504, 789
- Epinat et al. (2012) Epinat, B., Tasca, L., Amram, P., et al. 2012, A&A, 539, A92
- Erb et al. (2003) Erb, D. K., Shapley, A. E., Steidel, C. C., et al. 2003, ApJ, 591, 101
- Förster Schreiber et al. (2009) Förster Schreiber, N. M., Genzel, R., Bouché, N., et al. 2009, ApJ, 706, 1364
- Genzel et al. (2017) Genzel, R., Schreiber, N. M. F., Übler, H., et al. 2017, Nature, 543, 397
- Hainline et al. (2011) Hainline, L. J., Blain, A. W., Smail, I., et al. 2011, ApJ, 740, 96
- Kassin et al. (2006) Kassin, S. A., de Jong, R. S., & Weiner, B. J. 2006, ApJ, 643, 804
- Kennicutt (1998) Kennicutt, Jr., R. C. 1998, ARA&A, 36, 189
- Koekemoer et al. (2007) Koekemoer, A. M., Aussel, H., Calzetti, D., et al. 2007, ApJS, 172, 196
- Korsaga et al. (2018) Korsaga, M., Carignan, C., Amram, P., Epinat, B., & Jarrett, T. H. 2018, MNRAS, arXiv:1804.05820
- Laigle et al. (2016) Laigle, C., McCracken, H. J., Ilbert, O., et al. 2016, ApJS, 224, 24
- Lang et al. (2017) Lang, P., Förster Schreiber, N. M., Genzel, R., et al. 2017, ApJ, 840, 92
- Law et al. (2009) Law, D. R., Steidel, C. C., Erb, D. K., et al. 2009, ApJ, 697, 2057
- Lovell et al. (2018) Lovell, M. R., Pillepich, A., Genel, S., et al. 2018, ArXiv e-prints, arXiv:1801.10170
- Martinsson et al. (2013a) Martinsson, T. P. K., Verheijen, M. A. W., Westfall, K. B., et al. 2013a, A&A, 557, A131
- Martinsson et al. (2013b) —. 2013b, A&A, 557, A130
- McCracken et al. (2012) McCracken, H. J., Milvang-Jensen, B., Dunlop, J., et al. 2012, A&A, 544, A156
- McGaugh (2016) McGaugh, S. S. 2016, ApJ, 816, 42
- McLean et al. (2010) McLean, I. S., Steidel, C. C., Epps, H., et al. 2010, in Proc. SPIE, Vol. 7735, Ground-based and Airborne Instrumentation for Astronomy III, 77351E–77351E–12
- McLean et al. (2012) McLean, I. S., Steidel, C. C., Epps, H. W., et al. 2012, in Proc. SPIE, Vol. 8446, Ground-based and Airborne Instrumentation for Astronomy IV, 84460J
- Pelliccia et al. (2017) Pelliccia, D., Tresse, L., Epinat, B., et al. 2017, A&A, 599, A25
- Peng et al. (2002) Peng, C. Y., Ho, L. C., Impey, C. D., & Rix, H.-W. 2002, AJ, 124, 266
- Planck Collaboration et al. (2016) Planck Collaboration, Ade, P. A. R., Aghanim, N., et al. 2016, A&A, 594, A13
- Price et al. (2016) Price, S. H., Kriek, M., Shapley, A. E., et al. 2016, ApJ, 819, 80
- Rubin et al. (1965) Rubin, V. C., Burbidge, E. M., Burbidge, G. R., Crampin, D. J., & Prendergast, K. H. 1965, ApJ, 141, 759
- Rubin et al. (1978) Rubin, V. C., Thonnard, N., & Ford, Jr., W. K. 1978, ApJ, 225, L107
- Salvatier et al. (2016) Salvatier, J., Wiecki, T. V., & Fonnesbeck, C. 2016, PyMC3: Python probabilistic programming framework, Astrophysics Source Code Library, ascl:1610.016
- Scoville et al. (2016) Scoville, N., Sheth, K., Aussel, H., et al. 2016, ApJ, 820, 83
- Sérsic (1963) Sérsic, J. L. 1963, Boletin de la Asociacion Argentina de Astronomia La Plata Argentina, 6, 41
- Simons et al. (2017) Simons, R. C., Kassin, S. A., Weiner, B. J., et al. 2017, ApJ, 843, 46
- Sofue & Rubin (2001) Sofue, Y., & Rubin, V. C. 2001, ARA&A, 39, 137
- Stott et al. (2016) Stott, J. P., Swinbank, A. M., Johnson, H. L., et al. 2016, MNRAS, 457, 1888
- Swinbank et al. (2004) Swinbank, A. M., Smail, I., Chapman, S. C., et al. 2004, ApJ, 617, 64
- Teklu et al. (2018) Teklu, A. F., Remus, R.-S., Dolag, K., et al. 2018, ApJ, 854, L28
- van Albada et al. (1985) van Albada, T. S., Bahcall, J. N., Begeman, K., & Sancisi, R. 1985, ApJ, 295, 305
- van Starkenburg et al. (2008) van Starkenburg, L., van der Werf, P. P., Franx, M., et al. 2008, A&A, 488, 99
- Weiner et al. (2006) Weiner, B. J., Willmer, C. N. A., Faber, S. M., et al. 2006, ApJ, 653, 1027
- White & Rees (1978) White, S. D. M., & Rees, M. J. 1978, MNRAS, 183, 341
- Wisnioski et al. (2015) Wisnioski, E., Förster Schreiber, N. M., Wuyts, S., et al. 2015, ApJ, 799, 209
- Wright et al. (2007) Wright, S. A., Larkin, J. E., Barczys, M., et al. 2007, ApJ, 658, 78
- Wuyts et al. (2016) Wuyts, S., Förster Schreiber, N. M., Wisnioski, E., et al. 2016, ApJ, 831, 149
- Xue et al. (2018) Xue, R., Fu, H., Isbell, J., et al. 2018, ArXiv e-prints, arXiv:1807.04291
- Yuan et al. (2017) Yuan, T., Richard, J., Gupta, A., et al. 2017, ApJ, 850, 61