SDSS-IV MaNGA: The Roles of AGNs and Dynamical Processes in Star Formation Quenching in nearby Disk Galaxies
Abstract
We study how star formation (SF) is quenched in low-redshift disk galaxies with integral-field spectroscopy. We select 131 face-on spiral galaxies with stellar mass greater than , and with spatially resolved spectrum from MaNGA DR13. We subdivide the sample into four groups based on the offset of their global specific star formation rate (SFR) from the star-forming main sequence and stack the radial profiles of stellar mass and SFR. By comparing the stacked profiles of quiescent and star-forming disk galaxies, we find that the decrease of the global SFR is caused by the suppression of SF at all radii, but with a more significant drop from the center to the outer regions following an inside-out pattern. As the global specific SFR decreases, the central stellar mass, the fraction of disk galaxies hosting stellar bars, and active galactic nuclei (AGNs; including both LINERs and Seyferts) all increase, indicating dynamical processes and AGN feedback are possible contributors to the inside-out quenching of SF in the local universe. However, if we include only Seyferts, or AGNs with , the increasing trend of AGN fraction with decreasing global sSFR disappears. Therefore, if AGN feedback is contributing to quenching, we suspect that it operates in the low-luminosity AGN mode, as indicated by the increasing large bulge mass of the more passive disk galaxies.
Subject headings:
galaxies: evolution — galaxies: star formation — galaxies: active — galaxies: structure1. Introduction
Galaxies in the local universe are clearly separated into two populations in the color-magnitude diagram (CMD), “Red Sequence” and “Blue Cloud,” with only few galaxies scattering between forming a “Green Valley (GV).” This bimodality in distribution of galaxy optical properties in terms of their star formation (SF) activity, is found to be not only related with evolutionary stage, but also closely correlated with morphology of a galaxy (e.g., Kauffmann et al., 2003b; Wuyts et al., 2011). Star forming galaxies (SFGs) are dominated by spiral disks, while spheroidal galaxies show little or no emission generated from the H II region ionized by young stars. Any mechanism that changes galaxies into ‘red and dead’ (i.e., quenching) is required to explain the morphological transformation in a self-consistent way.
What causes the quenching of a galaxy has long been debated. Many factors are proven to be important in suppressing SF but responsible mechanisms are not exactly the same in different galaxies. Following the reddening direction of CMD, the mode of historical SF in galaxies changes from a long-timescale pattern into a major merger triggered starburst (Smethurst et al., 2015), suggesting an evolution in quenching mode from early to late cosmic epoch (Huertas-Company et al., 2016). Theoretical and numerical works require active galactic nuclei (AGNs) feedback in stopping SF to form local massive early-type galaxies (Eisenreich et al., 2017, and references therein), which are quenched ago (Kauffmann et al., 2003a), with major mergers invoked to explain their rapid star formation history (SFH) and spheroidal morphology (Smethurst et al., 2015). Mergers are also assumed in simulation to form classical bulge in spiral galaxies (Brooks & Christensen, 2016, and references therein). However, given the low merger rate in the local universe (Lotz et al., 2011), the build-up of spheroidal structure in the galaxy center could be attributed to other physical reasons rather than mergers. Dynamical processes during secular evolution are considered to be relatively more important in driving (pseudo) bulge formation and passive evolution in present-day galaxies (Gadotti, 2011; Kruk et al., 2018, and references therein).
Mass-dependent long-timescale (4 Gyr as suggested by Peng et al., 2015) evolution for SFGs is suggested by the finding of the star formation main sequence (SFMS, e.g. Speagle et al., 2014), with the star formation rate (SFR) of most SFGs strongly correlating with their stellar mass following a tight log-linear relation. The flattening in slope of the local SFMS found in the massive end (Lee et al., 2015, e.g.) suggests a mass-related global SF suppression for massive galaxies compared to lower-mass disks, with significant non-starforming bulge/central structure build-up in massive spirals argued to be the most important reason (Abramson et al., 2014; Bluck et al., 2014; Whitaker et al., 2017). Using the position of galaxies on the SFR- diagram with respect to SFMS as a tracer of the current evolutionary stage of galaxies, it have also been found that normal SFGs are almost exponential disks, while starbursts and galaxies fading out of SFMS are observed to be highly concentrated (Wuyts et al., 2011; Guo et al., 2015; Morselli et al., 2017).
“Morphological quenching” is suggested as a morphologically related mechanism that stops SF in massive galaxies, with the existence of prominent bulge increases the Toomre-Q parameter (Toomre, 1964), and “stabilizes” gas on disks, i.e., prevents cold gas from collapsing and forming stars (Martig et al., 2009). While this “morphological quenching” naturally leads to an “inside-out” quenching pattern suggested by observation of local massive galaxies (Pan et al., 2015; Belfiore et al., 2018), an alternative inside-out quenching mechanism is also pointed out by observational studies based on mass profiles of galaxies at different evolutionary stages (Tacchella et al., 2015, 2018), with a compaction followed by starburst and gas depletion in galaxy center suggested to be necessary in suppressing SF (Barro et al., 2017; Whitaker et al., 2017). The latter mechanism always requires a dynamical process to trigger gas in the galactic center, to fuel the upcoming intensive central SF and the possible accompanying stellar or AGN feedback.
On the other hand, the finding that galaxies in transition between star forming and quiescent are central low ionization emission-line regions (Belfiore et al., 2017, see also Bär et al. 2017 for AGN hosts above SFMS) directly suggests the feedback of low-luminosity galactic nuclei (LLAGN) as another possible reason of galaxy quenching. However, whether the AGN activity directly correlates with SF intensity or whether the AGN activity is related with the build-up of the central structure in disk galaxies is still not fully understood.
In this paper, we examine the resolved SF properties of massive spiral galaxies crossing the SFMS downward, to statistically explore how stellar mass is assembled during the passive evolution of a galaxy and how does AGN activity relates with the evolutionary stage of SF, aiming to find out if a plausible AGN activity is related with the galaxy structure build-up by comparing the spatial distribution of emission-line ratios with that of SFR and stellar mass (). Obviously there is no direct evolutionary link between current SFGs and quiescent galaxies, with the latter believed to have had active SF in an epoch as early as (Peng et al., 2015). However, we can still explore the crucial mechanisms that cause the quenching of a galaxy by comparing present-day galaxies in different evolutionary stages, given that passive galaxies at fixed stellar mass had been sharing the same properties in both morphology and SF activity with SFGs until they faded out of SFMS.
This study is based on the MaNGA (Mapping Nearby Galaxies at Apache Point Observatory, Bundy et al. (2015)) public database
from the 13th Data Release of the Sloan Digital Sky Survey (SDSS-DR13; Albareti et al., 2017).
Only massive () spiral galaxies are examined for the reasons that:
(1) the evolution of massive galaxies is less affected by environmental effects;
(2) quenching and any morphological transformation during quenching events for these galaxies are unlikely to be caused by major mergers.
We describe the data analysis in the next section, and show the resolved properties of emission lines and the stellar component in Section §3. We summarize and discuss our results in Section §4. A Chabrier (2003) initial mass function (IMF) is used throughout this work unless otherwise stated. We assume the following cosmological parameters: , and .
2. Sample and Data analysis
MaNGA is the largest ongoing integral-field unit (IFU) survey of low-redshift galaxies, designed to explore the internal kinematic structure and composition of gas and stars in 10,000 nearby galaxies with a spectral coverage from to at a typical resolution (Bundy et al., 2015). Galaxies are covered to at least in observation. MaNGA target galaxies are selected from the NASA-Sloan Atlas catalog (NSA; Blanton et al., 2011). The selection has a wide coverage in stellar mass () and optical color, to allow an unbiased analysis of SF of the galaxy population at different evolutionary stages. The median point-spread function (PSF) of the MaNGA data cubes has a median full width at half maximum (FWHM) of (Law et al., 2016), with the standard deviation of in -band.
We utilize the visually classified morphology from GalaxyZoo (Lintott et al., 2008, 2011). From 1272 matches found in 1390 galaxies in SDSS-DR13/MaNGA database with a matching radius of 1”, 131 spirals with are selected. The stellar masses are taken from the NSA catalog 111We divide the stellar mass in the NSA catalog by a factor of 0.49 to keep the consistency of cosmology.. We have avoided highly inclined galaxies by removing those with axis ratio . These galaxies are distributed in the redshift range , with a median value . 118 (90%) galaxies in our sample are distributed within .
The data cubes of our targets are rebinned to pixels, to remove the covariances between neighboring pixels. The rebinning also speeds up the spectral fitting afterward. A map of the signal-to-noise ratio (S/N) calculated in the region (rest-frame ) is made for each galaxy. Voronoi binning (Cappellari & Copin, 2003) is then applied to those pixels with S/Ns less than 30. The covariance in pixel binning is accounted for simply by applying
| (1) |
following the online instructions of MaNGA data reduction222http://www.sdss.org/dr13/manga/manga-caveats/. The foreground galactic extinction is estimated based on the dust map of Schlegel et al. (1998), and is corrected using the Galactic extinction law of Cardelli et al. (1989) with .
The spectral fitting pipeline LZIFU (Ho et al., 2016) is utilized to analyze stellar component and emission lines. Stellar continuum is fit and extracted using the “penalized pixel-fitting” (pPXF) routine (Cappellari & Emsellem, 2004; Cappellari, 2017), before fitting Gaussian line profiles to emission lines. Weighted simple-stellar-population (SSP) templates from MIUSCAT (Vazdekis et al., 2012) are applied in continuum fitting for the entire wavelength coverage. A Salpeter IMF is used 333SSP spectral energy distributions (SEDs) of metallicity and age from 63 Myr to 18 Gyr (0.2 dex steps) with unimodal IMF of slope 1.3 (i.e., Salpeter case) are used in continuum fitting. All resolved properties are based on Salpeter IMF to keep the consistency. Later in the text, the integrated -based SFR is corrected to Chabrier IMF to compare with that from the GSWLC-X1 catalog.. The stellar mass for each pixel is estimated by summing up the weights of the best-fit stellar templates. Pixels that belong to other sources in the field of view rather than target galaxies have been selected and masked based on segmentation maps reduced from SDSS/-band images. We then classify the pixels in terms of their position on the Baldwin et al. (1981, BPT) diagram, by comparing their [O III]/ and [N II]/ with those of SFGs and AGNs, following Kewley et al. (2006) and adopting the empirical separation between Seyfert and LINER defined by Schawinski et al. (2007). Thus pixels of each galaxy are classified into Star-forming, Composite, LINER-like and Seyfert-like regions. We refer to Brinchmann et al. (2004) for the classification of pixels with in any lines. Particularly, we assign pixels which have [N II]/ and in both lines but in or [O III] to be LINER-like regions.
3. Methods and Results
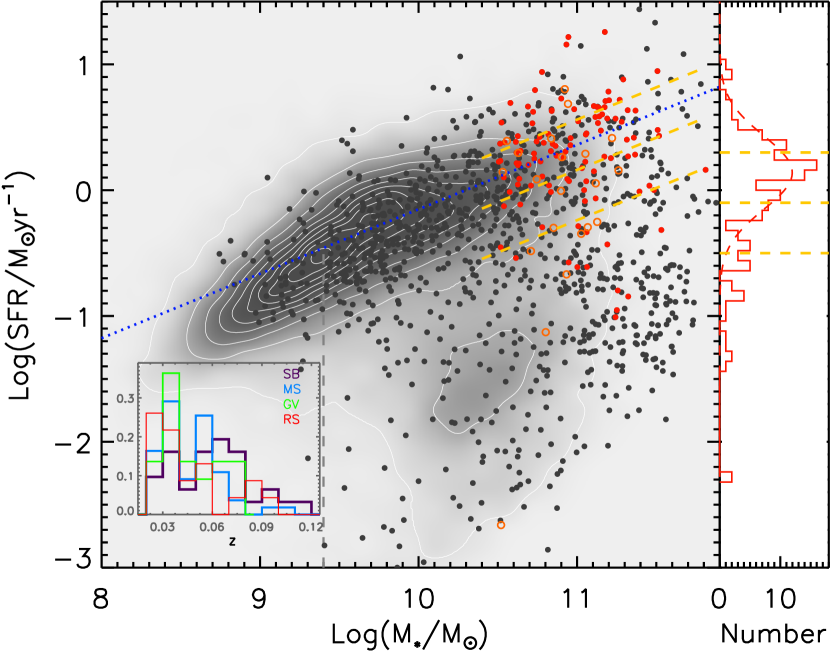
The position of each galaxy on the integrated - plot (Figure 1) indicates their global evolutionary stage. Galaxies are classified into Starbursts, normal SFGs, GV galaxies and Red Sequence galaxies according to their integrated and their distance to the SFMS at the same stellar mass. To explore the mechanisms that suppress the the global SFR, the resolved properties of the galaxies including stellar mass, SFR, light-weighted stellar age (indicated by Dn4000) and dominated ionization mechanism are analyzed.
3.1. SF phase classification
Given the relatively high sample completeness and accuracy in SFR estimation, we use -SDSS-WISE Legacy Catalog (GSWLC-X1, Salim et al., 2016) as the reference catalog to construct SFMS in the redshift range of our MaNGA galaxies. The SFR estimation in this catalog is based on broadband photometry. It has an advantage of being less affected by AGN-heated dust emission, and does not suffer from uncertainties of aperture correction. The SFMS constructed based on the data above 444To construct the SFMS, we select galaxies in the GSWLC-X1 catalog with the same redshift distribution of galaxies in NSA catalog. is given by:
| (2) |
indicated by the blue dotted line in Figure 1. This is determined by a log-linear fit for galaxies with which construct a gaussian-like SFR distribution above the separation between SFGs and passive sequence.
We define galaxies with SFRs above the SFMS as “Starburst” (SB) galaxies; galaxies with SFRs between SFMS and SFMS as Main Sequence (MS) galaxies; galaxies with SFRs between SFMS and SFMS as GV galaxies; and those with SFRs below SFMS as passive spiral galaxies (RSs). It should be noted that a more conventional definition of SB galaxies (RS galaxies) would require a higher (lower) cut of SFR relative to the SFMS. This will, however, give too few galaxies classified as SB galaxies and RS galaxies, due to the relatively small size of our sample. Therefore, we adopt the above operational definition of each class.
We cross-match the NSA catalog with GSWLC-X1 using as matching radius, 55512 more matches would be found if a matching radius was used. However, these galaxies are either interacting/diffuse or highly inclined, hence we did not include these galaxies in our final sample. and adopt SFRs from GSWLC catalog for the matched sample. Within the selected 131 massive spiral galaxies in our MaNGA sample, 115 of them have matches. For the other 16 galaxies that do not have matches in the GSWLC-X1 catalog, we calculate their SFR by summing up all the dust-corrected emission from star-forming regions defined in §2 using the formula from Kennicutt (1998):
| (3) |
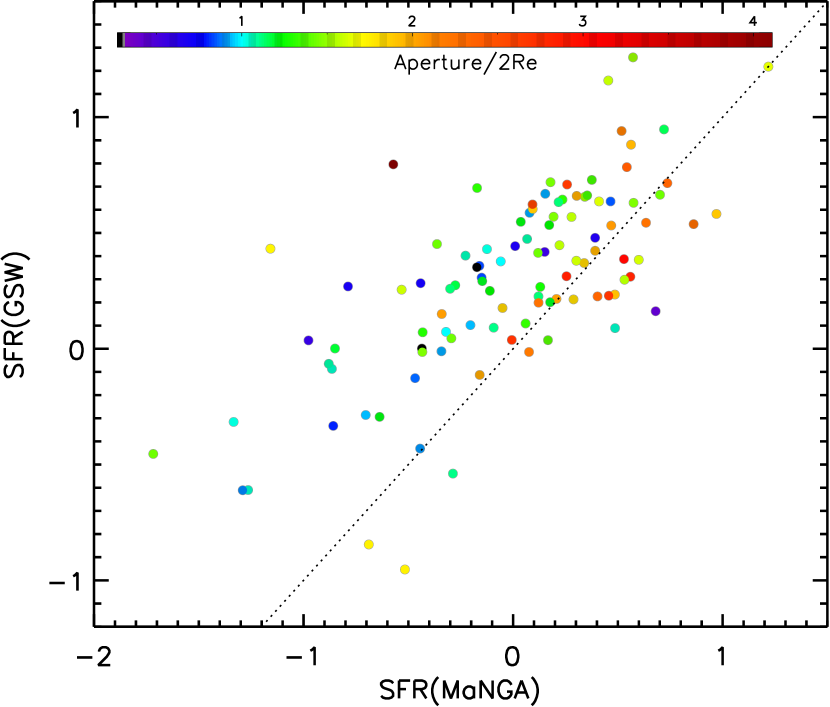
which should be considered as a lower limit for the reason of both ignoring SF from other gas-ionized regions and the limited radial coverage of MaNGA observation. Dust extinction is derived from the observed Blamer decrement with intrinsic , using Cardelli et al. (1989) extinction law applied with and other coefficients updated by O’Donnell (1994). We have compared the SFR from the GSWLC catalog and that from integrated emission for the matched galaxies, which is shown in Figure 2. Because the nontrivial aperture correction is out of the scope of this article and, MaNGA-based SFR is on average smaller than that from GSWLC, we decide to use the latter in classifying the global evolutionary stage of a galaxy. The global -based SFR is divided by a factor of 1.7 to be compared to the Chabrier IMF-derived SFR in GSWLC.
By comparing the position of the 131 face-on massive spirals of our MaNGA galaxy sample with SFMS defined in equation (2) (see Figure 1), 31 galaxies are classified as SBs, 55 are MSs, 22 are in GVs and 23 are RSs. Though the SFR measurement based on emission lines could be inconsistent with that derived from broadband photometry, the removal of the 16 galaxies with only MaNGA detection does not affect the average distribution of SF or stellar mass for galaxies in different evolutionary stages. We stress again that SBs defined here are those galaxies with integrated SFR 0.2 dex higher than those on SFMS. They do not show any merging features following our visual identification, and could be classified into “Main Sequence” if a more conventional definition of SBs with SFR 4 times higher than the MS galaxies. RS is also not necessarily to the same “Red Sequence” as that commonly defined by the literature, which is dominated by fully quenched early-type galaxies about 1 dex below the MS. We remind our readers that all these galaxies are “disks” (including those showing clear disks but no distinct spiral arms) in morphology.
3.2. Stacking and AGN contamination
To give a clear and global view of the resolved properties of galaxy population in the four different SF phases as defined above, we construct the maps of median , SFR, sSFR, Dn4000 and BPT classification by stacking the galaxies in each SF phase and taking the median values of each stacked pixel, i.e., median stacking. We also construct the one-dimensional (radial) median stacking of SFR, sSFR and which gives a more quantitative way of exploring the evolution in kpc/ scale.
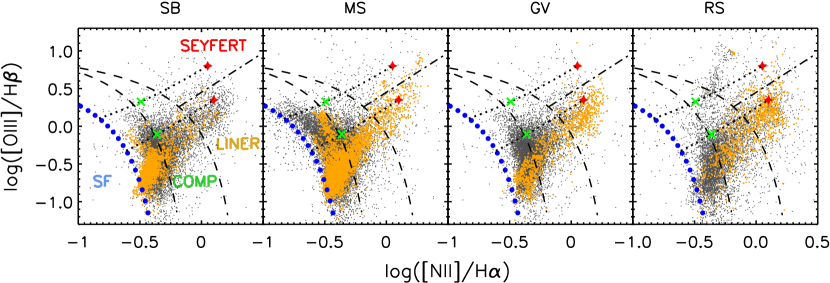
We ignored the emission from pixels that are not classified as SF regions in calculating global SFR of individual galaxies. However, simply masking out higher-ionized regions leads to an inaccuracy in stacked SFR. This could be either underestimated because of not accounting SF in LINER- or Seyfert like regions, or overestimated by ignoring the un-SF pixels in stacking, due to the low contribution from LINER-like pixels compared to those dominated by H II regions, unless SFR of 0 is assigned to AGN-like pixels and accounted for. Thus we turn to the AGN-SF decomposition method in Kauffmann & Heckman (2009) to refine the SFR from individual pixels according to their position on the BPT diagram. This method offers a statistically reliable estimation of averaged SFR, and the contribution from either side does not suffer from the uncertainty caused by the difference in intrinsic Balmer decrement between AGN-like and H II regions when extinction correction is applied. We apply this method to pixels that are classified as composite, LINER-like, and Seyfert-like in Section §2. The two “pure-AGN” templates based on SDSS spectra used in Kauffmann & Heckman (2009) are adopted. In addition, we adopt a shift of the separation line between SFG and AGN from Kauffmann et al. (2003c) to represent the “Star forming” ridge, so that the SF/composite border is around 50% SF contribution. The classification of “Star forming” and “AGN-like” regions together with the templates used in decomposition are shown in Figure 3.
An S/N cut is applied to pixels before stacking. Since we aim to explore the galaxy properties as a function of distance to galactic center, given that the mass and light distribution of a galaxy generally follows a radially symmetric pattern, we apply a contour binning (Sanders, 2006) to pixels with S/N in for each galaxy before extinction correction. A simple deprojection method is also applied to 2D maps of each bin before they are rescaled to physical scales and stacked. In practice, we rotate a galaxy to align its major axis horizontally and elongate the image in the perpendicular direction to match the minor and the major axes, and then we transform the image back to its original size. Since our galaxies are selected to have inclination angles less than (), the uncertainty caused by the deprojection process does not affect the stacking results. Similarly, with the assumption that disks are circular, radial distance from pixels to galaxy center for individual galaxies are corrected geometrically using their global axis ratio and position angle provided in the NSA catalog.
3.3. Resolved properties
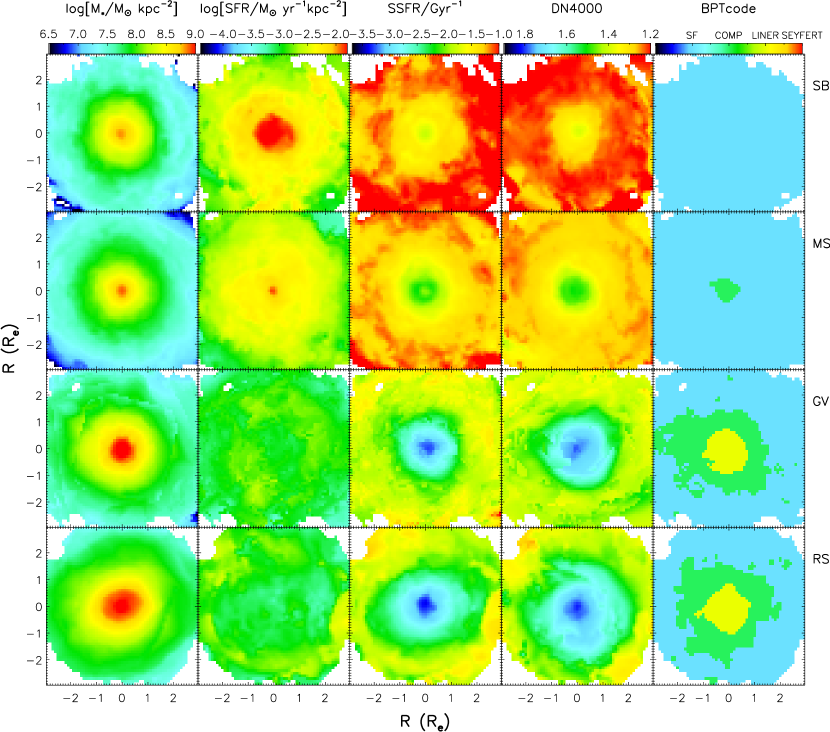
Figure 4 shows the median stacked maps of , , , Dn4000, and the emission-line classification based on the resolved BPT diagram in the panels from the left to the right, for the four populations from SB to RS indicated by panels from top to bottom. Stacking is only applied to places where the number of available pixels are greater than 3 to make the median estimates reliable. The typical FWHM of PSF is , which corresponds to less than 3 kpc, i.e., less than of most galaxies in our sample 666Most (90%) of our galaxies are within the redshift range of , thus the smearing effect is limited in a scale less than , which is less than for of our sample.. Also the redshift distribution of the 4 galaxy groups is identical, as shown in Figure 1 (lower-left panel), the relative difference of resolved properties between different groups without PSF deconvolution should not be affected by the smearing effect. To test this, we have restricted the sample to galaxies with in . The stacked results changed very little.
Figure 4 clearly demonstrates several key features of the resolved properties of the galaxy population, and their changes as the integrated SFR decreases from SB (top row) to RS (bottom row).
-
1.
As the integrated SFR drops from SB to RS, a clear increase in the central surface stellar mass density is seen. This shows the clear bulge growth during the quenching process.
-
2.
The suppression of SFR in GV and RS compared to the other two groups is more significant in galaxy center than in the outer disk, with the central-peak in distribution disappearing gradually with the passive evolution, resulting in a “ring-like” SF indicated by our stacked GV and RS disks.
-
3.
The aging of stellar population indicated by Dn4000 and the expanding of which from galaxy center to outer disk are very obvious. This trend goes together with the globally fading of specific star formation rate (sSFR), which shows a significant central-dip pattern since galaxies leave SFMS.
-
4.
The rightmost column shows that disk center appears “LINER-like” in GV, and stays like a low-luminosity AGN in RS before the galaxy is fully quenched;
We remind our readers that these are all median features. For example, the composite classification for the stacked central region of MS galaxies does not necessarily mean that most of the MS galaxies have a transition-type AGN. Actually only 7 of them have composite centers, while 27/21 in 55 are classified as star-forming/AGN-like.
To give a quantitative comparison on the subgalactic scale, we apply a 1D median stack of the and the profiles along the radial direction with the IDL procedure regroup.pro. The scatter around the median value is shown as the shaded area in Figure 5. Both profiles are normalized to make better comparisons. profiles are all normalized to an integrated of , while profiles are normalized to the value of SFR on SFMS for corresponding . profiles are derived from the normalized and profiles. A simple approach has been applied to test the beam smearing effect on the stacked profiles, as follows.
The PSF is assumed to be a Gaussian with an FWHM of . Individual profiles are fitted by a sum of four central peaked half-Gaussian functions with width and amplitude as free parameters 777We found that in practice, 4 Guass is the simplest and best fit when multi Gaussian distributions are used in profile fitting.. The fitting is required to produce the same total integrated as the total derived from broadband photometry in the NSA catalog. We then subtract the -FWHM gaussian profile from the stacked profile and find little difference. We have not done this test to the , due to the large uncertainty in SFR estimation in the galaxy central regions, especially for GV and RS galaxies with possible AGN contamination, as shown in the right pannels of Figure 5. However, we do not expect significant change in stacked profiles after PSF deconvolution, since the smearing effect is limited in a scale for most of our galaxies.
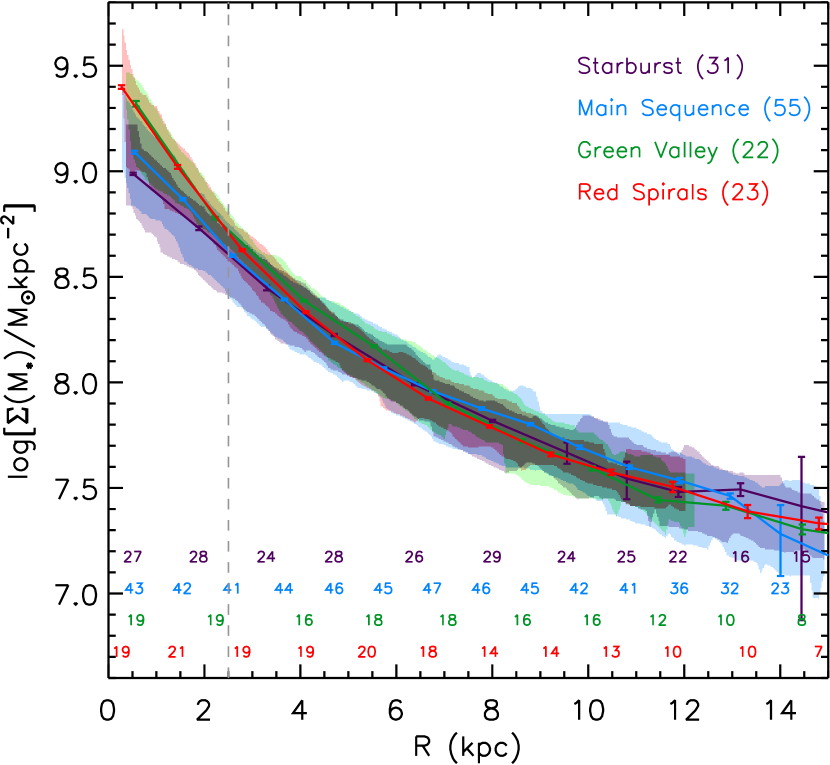
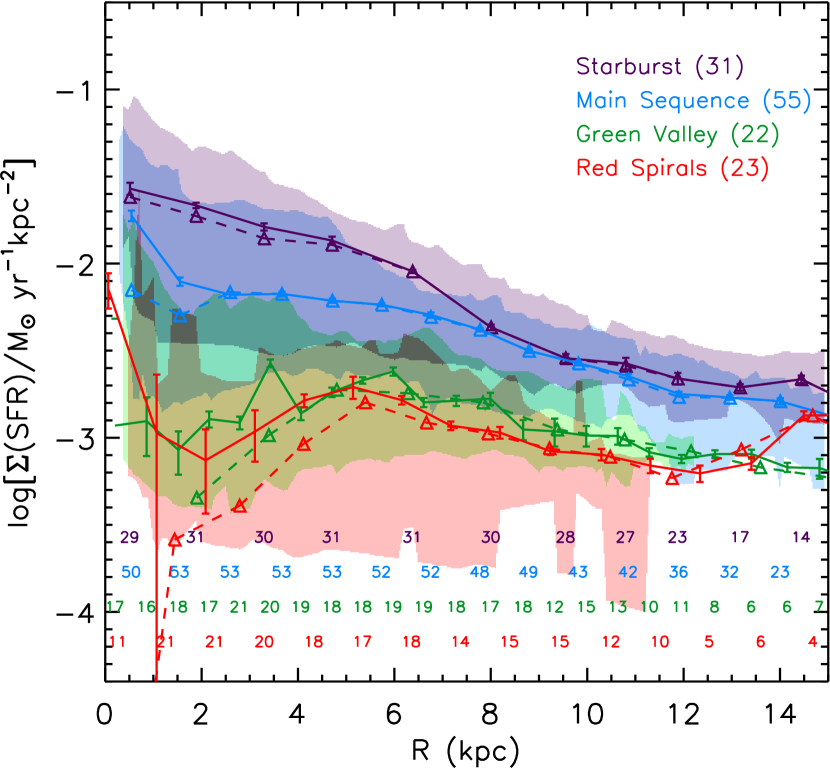
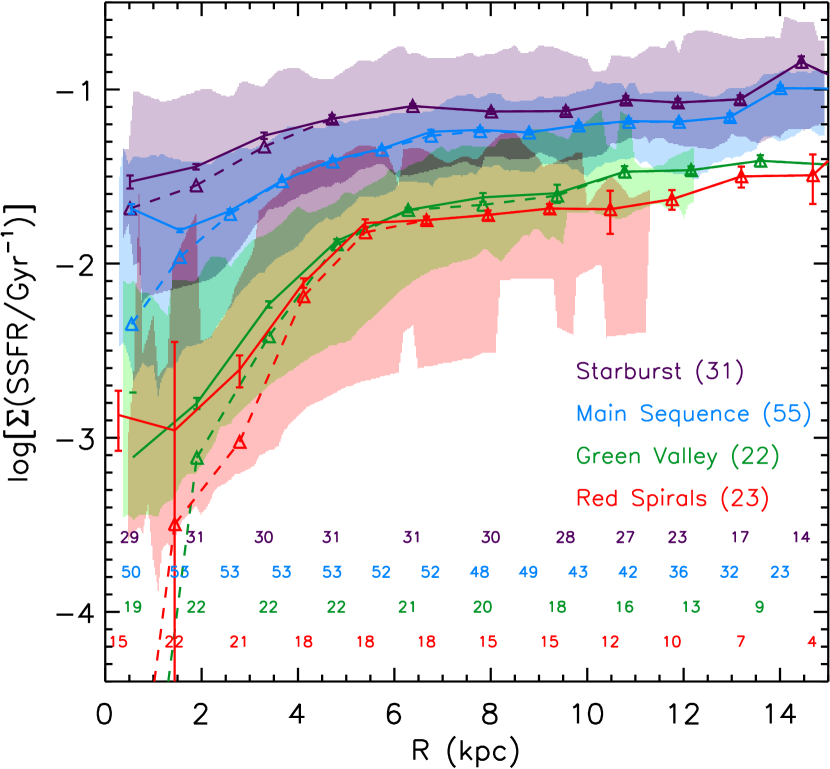
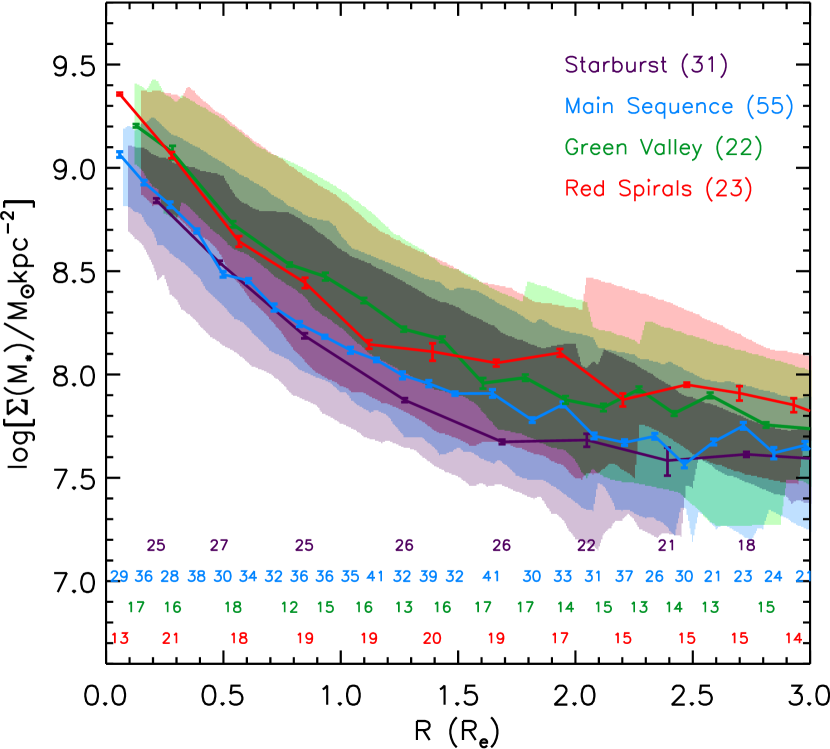
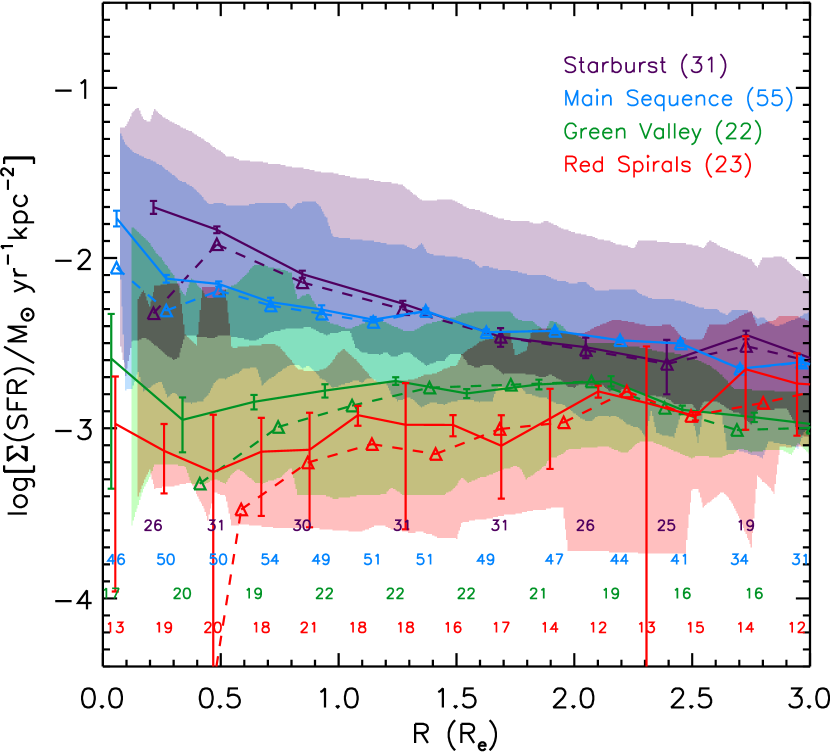
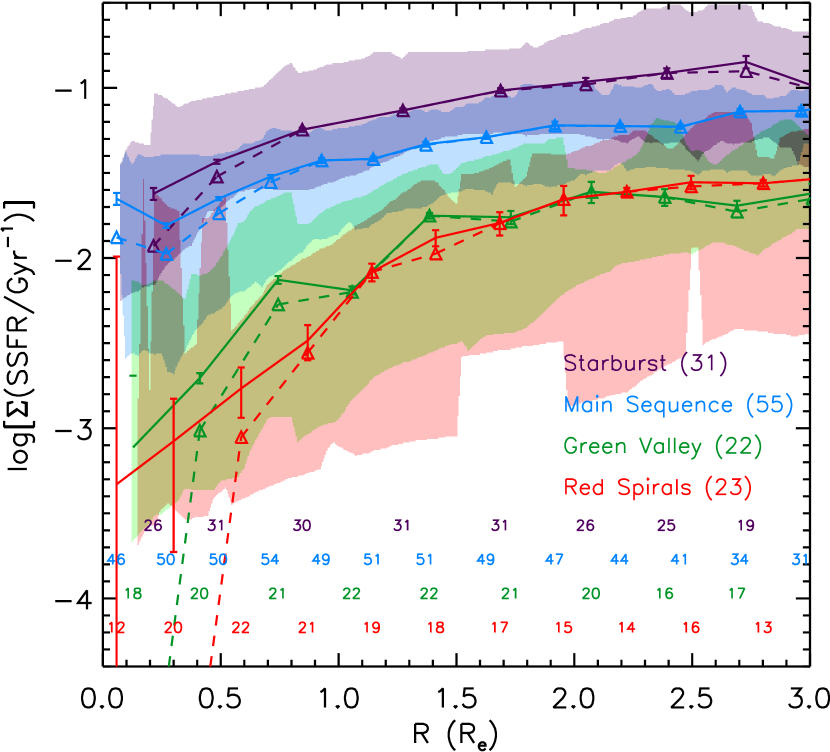
As shown in Figure 5, both and change significantly from SB to RS at all radii, with the largest change in the central regions(2 kpc). The central increases 0.4 dex from SB to RS and most of the increase happens during the transition from MS to GV phase. The percentage of stellar mass within the central 5 kpc diameter region (vertical dashed line of the top-left panel of Figure 5) of a galaxy increase from 31% and 37% in SB and MS, to 51% and 50% in GV and RS, with standard deviations of 19%, 18%, 19% and 28% in the four groups, respectively. This growth of the central stellar mass as the decrease of the global SFR is related to the central peaked SF of SB and MS galaxies. While the suppression of the SF happens across the entire disk of the galaxy, from the center to the outer regions, the most significant decrease appears at galaxy center, especially if we set the SFR contribution from “LINER-like” pixels to 0 (indicated by dashed lines). Toward the end of this “inside-out” quenching process, the SF in the central regions has dropped about 1.5 dex, in terms of both and , leaving some residual star formation in the outer disk regions and forming a ring-like structure, which is clearly shown in 2D SFR and sSFR distribution for GV and RS in Figure 4.
Our results can be understood as the following key evolutionary stages for galaxy population:
-
(1)
SBs have the youngest stellar population and the most flat stellar disks. Although the SFR profile is peaked in the central regions, the sSFR profile is nearly flat, which indicates the SF is similarly active across the entire disk. Galaxy center shows the strongest emission from the H II region compared to outer parts.
-
(2)
For galaxies on the MS, the SF activity becomes lower compared to SB galaxies, with a sign of more suppressed SF in the central regions. Accordingly, the dominant stellar population in the galaxy center is getting older as revealed by the Dn4000 map in Figure 4. The emission at galaxy center is still dominated by the H II region.
-
(3)
The dramatic decrease of SF at galaxy center changes the profile of a GV galaxy into a central-dip function, with a “ring-like” structure appearing at 5 kpc from galaxy center. Stellar mass, on the other hand, has a prominent build-up in the central area relative to outer disks, which is related to the central-peak SF pattern in MS galaxies. The primary emission source at galaxy center is more “LINER-like” rather than SF.
-
(4)
RS galaxies show similar mass profiles as those of GVs. Both SFR and sSFR profiles continue to decrease from GV to RS, with a slightly larger decrease in the central regions. The difference almost disappears at , which causes the SFR and sSFR ring-like structure to become more visible in the 2D map as in Figure 4. These galaxies still show “LINER-like” emission, but only limited in 2 kpc from galaxy center in most cases.
Our results are quantitatively consistent with the recent study of Medling et al. (2018) based on SAMI (Sydney-AAO Multi-object Integral-field unit) observations for spiral galaxies in the same and range. Our stacked profiles for galaxies from SB to GV are also consistent with those in Ellison et al. (2018), while the difference between the profiles of red galaxies could have resulted from our different treatments to AGN-like pixels at galaxy center. Again, we need to caution that there is no direct evolutionary link between the four classes from SB to RS, i.e., the SB or the MS galaxies are not the progenitors of the RS galaxies at the same redshift. A full quenching process is not expected to finish during the redshift range covered by our sample, given a typical quenching timescale of several gigayears. Indeed, the change of the the profile from MS to GV cannot be fully explained by integrating the SFR profile over some reasonable quenching timescale. In other words, the change of the profile from MS to GV would require a long quenching timescale (), or additional mass contribution from mergers or other dynamical processes that can help to increase the . A more comprehensive analysis with consideration of quenching timescale, progenitors at higher redshift, and mergers is necessary and will be discussed in our future work.
4. Discussion and Conclusion
Based on 131 face-on spiral galaxies selected from the SDSS-DR13/MaNGA database, we examine the change of resolved properties of galaxies as the decrease of the global SFR. We find that galaxies slow the speed of SF across their entire disks after they fall out of the SFMS, with a decrease in galaxy center that is much quicker than that in outer disks. Stellar mass also has a quick build-up at galaxy center, with a speed that is 0.4 dex faster than that on disks farther out than 4 kpc. Galaxy center appears like a LINER host after the SF within the central 2 kpc decreases to . From then on, a hole in sSFR distribution becomes more significant, with the stellar component at galaxy center dominated by the old population, which continuously expands outward as the global damping of SF. The SFR profile transits from a central-peak function into a “ring-like” central-dip pattern, with a relatively active (but still faint) SF piling up at around 5 kpc.
Our findings are consistent with the popular “inside-out” mode of quenching for massive galaxies, in which central SF drops faster than outer disks. Combined with the mass build-up in the central 2 kpc before galaxies enter “GV” , our results agree with Fang et al. (2013) in structure-quenching mechanisms (see also Tacchella et al., 2015, 2018), which may be caused by stabilization of gas by the bulge/bar-driven process, during which AGN feedback could also take a part.
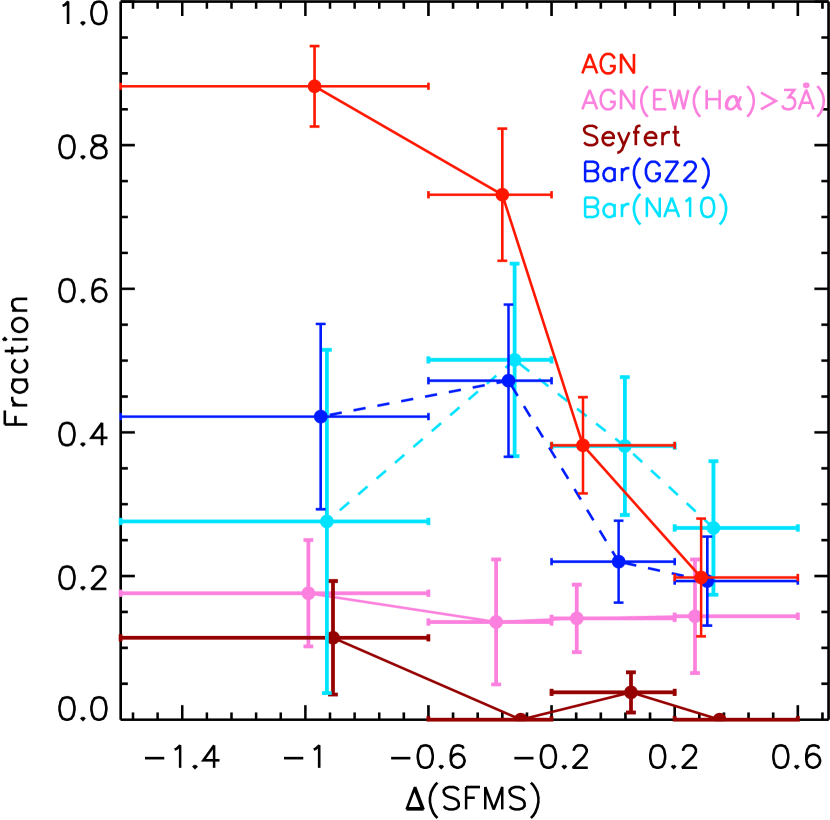
To qualify this, we plot the evolution of the fraction of barred galaxies and AGN hosts during the fading of global SF of disks in Figure 6. We adopt a morphology catalog from Galaxy Zoo 2 (Willett et al., 2013) and Nair & Abraham (2010) to classify barred galaxies in our sample. Differences between the classification are mainly due to the deviation in sample coverage of these catalogs. AGN hosts are galaxies with their central pixels classified as “LINER-” or “Seyfert-like” in resolved BPT diagrams (see Figure 4) 888Although composite objects could also be powered by AGNs, their numbers are small (3, 7, 1, and 0 in four groups, respectively) compared to either star-forming or AGN-like galaxies, and could be counted into statistical errors in AGN fraction.. The increase of AGN fraction during the passive evolution is clearly seen from Figure 6. A significant increase in bar fraction after galaxies leave MS and fade into GV is also indicated 999The increase in the bar fraction from SFGs to quiescent galaxies is more prominent if we constrain the sample to galaxies with , which is from 0.11 for SB and 0.12 for MS, to 0.50 for GV and 0.43 for RS..
4.1. Dynamical processes in inside-out quenching
As our target galaxies are massive spirals that are not supposed to have experienced significant disruption in structure triggered by, e.g., major mergers, secular evolution is an important mechanism for galaxy evolution and quenching. Bars are suggested to play a central role in building the dense central component, by driving gas inflow to trigger SF in galaxy center (Kormendy & Kennicutt, 2004; Lin et al., 2017). After the in-falling gas has all been consumed by stars, a strong bar “sweeps” out star forming resources or increases the gas random motions within the corotation radius (Khoperskov et al., 2018; Spinoso et al., 2017), leaving an “star formation desert” within the central 2 kpc (James, & Percival, 2018).
Compared with and bar galaxies found in SB and MS, half of our spirals in GV and RS are identified as barred galaxies in Galaxy Zoo 2 (Willett et al., 2013) and Nair & Abraham (2010). The increase of the bar percentage with the decrease of both global and inner-several-kiloparsec SF, which is most prominent between MS and GV, agrees with the “bar-quenching” mode suggested in massive galaxies from both observation and simulation (Gavazzi et al., 2015; Haywood et al., 2016; Kruk et al., 2018, see also Kim et al. 2017). Additionally, almost all of the last half central-red galaxies are inner lens/oval galaxies. From a scenario in which bars dissolve into lenses(Heller et al., 2007), the quenching of the central SF in these galaxies could also be driven by bars. However, we did not find a significant enhancement of central SF caused by bar-triggered gas inflow before the suppression, in barred galaxies of SB and MS compared to those unbarred, which is observed in Kim et al. (2017) and Catalán-Torrecilla et al. (2017). This may be caused by our limited barred sample (6 found in SB and 12 found in MS). Bar strength could be another reason because there is barely any difference found between weakly barred and unbarred galaxies (Kim et al., 2017).
The anticorrelation between the SF activity and bar fraction shown in Figure 6 is also consistent with theoretical studies in which bar formation is argued to be suppressed or delayed in gas-rich disks(e.g., Athanassoula et al., 2013), implying a possible relation between bar size/strength with on-going SF or optical color, as pointed out by Erwin (2018). Similarly in observation, Cervantes Sodi (2017) has found an anticorrelation between H I gas richness and bar fraction, agreeing with studies in which bars are more frequently found in massive and red early-type galaxies (e.g, Erwin, 2005; Nair & Abraham, 2010; Lee et al., 2012). On the other hand, bars can also take a part in fueling gas into the galactic center and can trigger an enhancement of SF in situ (e.g. Berentzen et al., 2007). The lack of discovery of the high fraction of strong bar for SB/starbursts, which however was shown by Wang et al. (2012), could result from the deviation in bar identification between studies. Given that the bar strength in Wang et al. (2012) is parameterized in terms of ellipticity, the contradiction could also be due to a potential dependence of bar ellipticity on central stellar mass, which is a natural result of the inverse correlation between bar ellipticity and central dynamical mass concentration found by Das et al. (2003) based on CO observation.
The finding of a ring in SFR distribution between around 4-6 kpc () is noticeable in the last two stages of global SF. This wide range shown in stacked 1D and 2D profiles resulted mostly from the scatter in galactic size. While a bar triggering suppression of the central SF naturally lead to a ring-like SF in the outer part of a galaxy, a combination of AGN feedback and bar-driven gas inflow also triggers an enhancement of SF and forming a dense ring at a finite radius (Robichaud et al., 2017). As Robichaud et al. (2017) address, this scenario is rather a “displacement” than a “suppression” of SF, because the gas is pushed to outer radii instead of thermalized or consumed.
A related high-redshift work (Genzel et al., 2014) that also found a ring argued for a different inside-out quenching mechanism for massive SFGs, where a centrally peaked Toomre-Q distribution caused by the higher concentration of stellar mass prevents further SF in galaxy center. This “gravitational quenching” or “Morphological quenching” (Martig et al., 2009) has been highlighted in explaining the formation of red galaxies with quenched gas disks. And SF is confirmed less efficient in bulge-dominated galaxies than in pure disks from both H I and observation (e.g., Kennicutt, 1989; Saintonge et al., 2012). However, compared to the consistency in the effect of the bulge-related mechanism argued among the literature, the role that bar leads in quenching is still concealed. A further analysis with a more complete sample of the dynamics and the gas contents of barred galaxies is required to test the scenarios.
The passive evolution of disks as shown in our work is related to but not exactly the “compaction” suggested for quenching of high-redshift galaxies (Dekel et al., 2009; Zolotov et al., 2015, and reference therein). Similar mechanisms require galaxies that are still on the main sequence experiencing a starburst to induce gas depletion and quenching afterward, which is also suggested in recent work by Ellison et al. (2018) based on their analysis of the gas-phase metallicity profile. Though SB is more metal-poor gas rich at galaxy center, our finding of the higher in the center of MS than SB galaxies shows that starbursts may not be powerful enough to cause a compaction, either to deplete gas in galaxy center or to quench SF. However, we should restate that compared to those extremes, which form most of stars in very short timescales, our SBs are more likely normal SFGs scattering above SFMS further than normal SFGs. Additionally, accounting for the relatively short timescale of “compaction”, the profile for SB and MS galaxies plausibly do not show significant difference. Nevertheless, the faster mass growth in galaxy center compared to that in the outer disk for fixed certainly indicate a shrink in galaxy size (effective radius), which could also be caused by dynamical reasons like bar-driven processes other than SF only. A more detailed self-consistent analysis with a proper assumption in SFH is required for further studies.
4.2. The puzzling role of AGNs in quenching SF
Only 10 in 117 of our galaxies are classified as AGNs in the MPA-JHU catalog (Tremonti et al., 2004) based on the SDSS spectrum, including 1 SB, 5 MSs, 3 GVs and 1 RS galaxies. However, from resolved analysis, 16 of 22 GVs and 20 in 23 RS galaxies show AGN-like emission in their central regions, and 34 of them in total could be classified as LINERs. Compared with the H II dominated “Starburst” and “Main Sequence,” this finding of the LINER-dominated other two groups qualitatively agree with the recently suggested “LI(N)ER” sequence of Hsieh et al. (2017). These galaxies are either classified as Type-2 AGN hosts (Catalán-Torrecilla et al., 2017) or “cLIER”s (Belfiore et al., 2017) in related studies. However, because of their old underlying stellar population, and relatively extended spatial distribution, instead of low-luminosity activity nuclei, the emission sources of the harder ionization field compared to the H II region are suspected to be low-mass hot evolved stars (e.g., Binette et al., 1994; Sarzi et al., 2010; Cid Fernandes et al., 2011; Yan & Blanton, 2012; Papaderos et al., 2013; Singh et al., 2013).
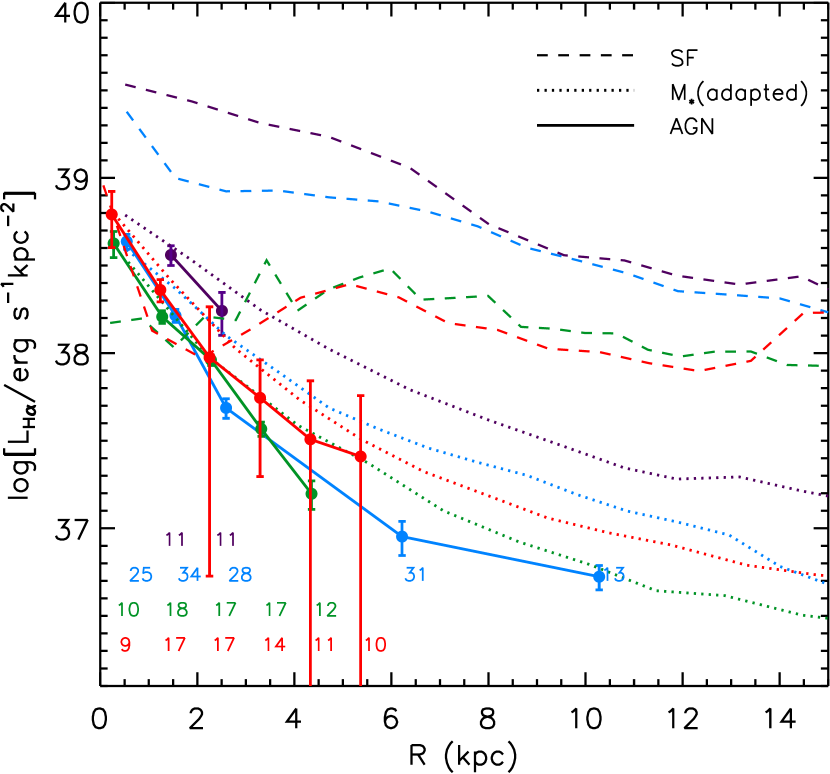
A mixture of low-luminosity AGN and old stellar component indeed could not be ruled out in red galaxies. The universality of the “LINER-like” emission we find in the SF suppressed disk center agrees with the concentrated distribution of the old stellar population in red galaxies, the emission from which is overshined by SF before a galaxy drops off the SFMS, preventing itself from being distinguishable until young and massive stars fade away. On the other hand, given the gently decreasing profile from center to outside in each population, the point-source-like central-peak pattern of the profile contributed from pure “AGNs” (from the empirical AGN/SF decomposition) as shown in Figure 7 implies a plausible existence of “real” LINER emission within the central 2 kpc, and could hardly be explained by an excess of the population of hot evolved stars at galaxy center (also see the discussion in §6.3 of Ho, 2008).
A quick check of individual 2D EW() maps reveals that around one-fifth of our “cLIERs” should be true AGNs from their emission in central pixels 101010The result does not change within 1 if we calculate the integrated within a or 2.3kpc (corresponding to 1” in ) instead. based on the criteria suggested by Cid Fernandes et al. (2011). However, the increasing pattern of the AGN fraction disappears if we throw out the “retired galaxies” defined above or if only Seyferts are considered (Figure 6). Thus despite the plausible contribution of AGNs to the steep profiles, the concentrated emission in GV and RS could also partly be seen as a combined result of the depression in central H II emission (dashed line in Figure 5) and the centrally concentrated distribution of stellar mass, i.e., an outcome of the competition between young and old populations. In this case, the concentrated old population at galaxy center, i.e., bulge, could play a more important role than AGNs in triggering the quenching of an SFG, given that most stellar mass at galaxy center has already been formed before a galaxy become GV. This process is related to the “morphological quenching”(Martig et al., 2009) or “gravitational quenching”(Genzel et al., 2014) discussed in the last subsection. Nevertheless, given the well-known correlation between the mass of the black hole and that of bulge, a GV or RS galaxy that has already built up its compact central component should undoubtedly contain a massive black hole. Moreover, because (57 in 66) of nearby LINER host galaxies were found to have X-ray cores in a recent study (She et al., 2017), we cannot rule out the effect of AGN feedback on SF given our high fraction of LINER hosts in nearly quenched spirals.
Indeed, besides the processes caused by central stellar bulge or bar, our findings also agree with AGN-driven quenching in state-of-the-art simulations. Given the high fraction of “LINER-like” host galaxies in contrast to the rare “Seyfert” hosts (Figure 6), LLAGN could take a more important role in affecting global SF in galaxies. The low-accretion-rate mode is found to dominate the duty cycle of an AGN (e.g., Ho, 2008), suggesting an important cumulative effect of the corresponding “hot-mode feedback” (Yuan et al., 2018) on SF. Both energy and momentum are injected into the surrounding inter-stellar medium, thermalizing, and/or diluting the materials for further SF.
Wind emitted from AGNs is found to play a more important role in quenching galaxy disks than radiation (Figure 8 in Yuan et al., 2018, see also Weinberger et al. 2017, 2018). Our finding of the suppression of SF in the central 2 kpc region in LINER hosts is likely because of the kinetic wind launched by the hot accretion flow (Yuan et al., 2015) in the “hot feedback mode.” 111111The peak we found for green and red galaxies within the central 1 kpc of a disk is also predictable in quenching models of Weinberger et al. (2017) for a galaxy with central-peak gas distribution. Although there could be other mechanisms depleting cold gas and preventing gas inflow when gas supply is still plentiful at galaxy center, our results suggest a possible quenching mechanism of low-luminosity AGN feedback, if the emission source of “LINER” could be confirmed as a real AGN.
References
- Abramson et al. (2014) Abramson, L. E., Kelson, D. D., Dressler, A., et al. 2014, ApJ, 785, L36
- Aihara et al. (2011) Aihara, H., Allende Prieto, C., An, D., et al. 2011, ApJS, 193, 29
- Albareti et al. (2017) Albareti, F. D., Allende Prieto, C., Almeida, A., et al. 2017, ApJS, 233, 25
- Athanassoula et al. (2013) Athanassoula, E., Machado, R. E. G., & Rodionov, S. A. 2013, MNRAS, 429, 1949
- Baldwin et al. (1981) Baldwin, J. A., Phillips, M. M., & Terlevich, R. 1981, PASP, 93, 5
- Bär et al. (2017) Bär, R. E., Weigel, A. K., Sartori, L. F., et al. 2017, MNRAS, 466, 2879
- Barro et al. (2017) Barro, G., Faber, S. M., Koo, D. C., et al. 2017, ApJ, 840, 47.
- Belfiore et al. (2017) Belfiore, F., Maiolino, R., Maraston, C., et al. 2017, MNRAS, 466, 2570
- Belfiore et al. (2018) Belfiore, F., Maiolino, R., Bundy, K., et al. 2018, MNRAS, 477, 3014.
- Berentzen et al. (2007) Berentzen, I., Shlosman, I., Martinez-Valpuesta, I., & Heller, C. H. 2007, ApJ, 666, 189
- Binette et al. (1994) Binette, L., Magris, C. G., Stasińska, G., & Bruzual, A. G. 1994, A&A, 292, 13
- Blanton et al. (2011) Blanton, M. R., Kazin, E., Muna, D., Weaver, B. A., & Price-Whelan, A. 2011, AJ, 142, 31
- Bluck et al. (2014) Bluck, A. F. L., Mendel, J. T., Ellison, S. L., et al. 2014, MNRAS, 441, 599
- Brinchmann et al. (2004) Brinchmann, J., Charlot, S., White, S. D. M., et al. 2004, MNRAS, 351, 1151
- Brooks & Christensen (2016) Brooks, A., & Christensen, C. 2016, Galactic Bulges, 418, 317
- Bundy et al. (2015) Bundy, K., Bershady, M. A., Law, D. R., et al. 2015, ApJ, 798, 7
- Cardelli et al. (1989) Cardelli, J. A., Clayton, G. C., & Mathis, J. S. 1989, ApJ, 345, 245
- Cappellari (2017) Cappellari, M. 2017, MNRAS, 466, 798
- Cappellari & Copin (2003) Cappellari, M., & Copin, Y. 2003, MNRAS, 342, 345
- Cappellari & Emsellem (2004) Cappellari, M., & Emsellem, E. 2004, PASP, 116, 138
- Catalán-Torrecilla et al. (2017) Catalán-Torrecilla, C., Gil de Paz, A., Castillo-Morales, A., et al. 2017, ApJ, 848, 87
- Cervantes Sodi (2017) Cervantes Sodi, B. 2017, ApJ, 835, 80
- Chabrier (2003) Chabrier, G. 2003, PASP, 115, 763
- Cid Fernandes et al. (2011) Cid Fernandes, R., Stasińska, G., Mateus, A., & Vale Asari, N. 2011, MNRAS, 413, 1687
- Cid Fernandes et al. (2010) Cid Fernandes, R., Stasińska, G., Vale Asari, N., et al. 2010, Co-Evolution of Central Black Holes and Galaxies, 267, 65
- Das et al. (2003) Das, M., Teuben, P. J., Vogel, S. N., et al. 2003, ApJ, 582, 190
- Dekel et al. (2009) Dekel, A., Birnboim, Y., Engel, G., et al. 2009, Nature, 457, 451
- Dong et al. (2008) Dong, X., Wang, T., Wang, J., et al. 2008, MNRAS, 383, 581
- Eisenreich et al. (2017) Eisenreich, M., Naab, T., Choi, E., Ostriker, J. P., & Emsellem, E. 2017, MNRAS, 468, 751
- Ellison et al. (2018) Ellison, S. L., Sánchez, S. F., Ibarra-Medel, H., et al. 2018, MNRAS, 474, 2039
- Erwin (2005) Erwin, P. 2005, MNRAS, 364, 283
- Erwin (2018) Erwin, P. 2018, MNRAS, 474, 5372
- Fang et al. (2013) Fang, J. J., Faber, S. M., Koo, D. C., & Dekel, A. 2013, ApJ, 776, 63
- Fu et al. (2018) Fu, H., Steffen, J. L., Gross, A. C., et al. 2018, ApJ, 856, 93
- Gadotti (2011) Gadotti, D. A. 2011, MNRAS, 415, 3308
- Gavazzi et al. (2015) Gavazzi, G., Consolandi, G., Dotti, M., et al. 2015, A&A, 580, A116
- Genzel et al. (2014) Genzel, R., Förster Schreiber, N. M., Lang, P., et al. 2014, ApJ, 785, 75
- Guo et al. (2015) Guo, K., Zheng, X. Z., Wang, T., & Fu, H. 2015, ApJ, 808, L49
- Haywood et al. (2016) Haywood, M., Lehnert, M. D., Di Matteo, P., et al. 2016, A&A, 589, A66
- Heller et al. (2007) Heller, C. H., Shlosman, I., & Athanassoula, E. 2007, ApJ, 671, 226
- Ho (2008) Ho, L. C. 2008, ARA&A, 46, 475
- Ho et al. (2016) Ho, I.-T., Medling, A. M., Groves, B., et al. 2016, Ap&SS, 361, 280
- Hsieh et al. (2017) Hsieh, B. C., Lin, L., Lin, J. H., et al. 2017, ApJ, 851, L24
- Huertas-Company et al. (2016) Huertas-Company, M., Bernardi, M., Pérez-González, P. G., et al. 2016, MNRAS, 462, 4495
- James, & Percival (2018) James, P. A., & Percival, S. M. 2018, MNRAS, 474, 3101.
- Kauffmann & Heckman (2009) Kauffmann, G., & Heckman, T. M. 2009, MNRAS, 397, 135
- Kauffmann et al. (2003c) Kauffmann, G., Heckman, T. M., Tremonti, C., et al. 2003, MNRAS, 346, 1055
- Kauffmann et al. (2003a) Kauffmann, G., Heckman, T. M., White, S. D. M., et al. 2003, MNRAS, 341, 33
- Kauffmann et al. (2003b) Kauffmann, G., Heckman, T. M., White, S. D. M., et al. 2003, MNRAS, 341, 54
- Kennicutt (1989) Kennicutt, R. C., Jr. 1989, ApJ, 344, 685
- Kennicutt (1998) Kennicutt, R. C., Jr. 1998, ARA&A, 36, 189
- Kewley et al. (2001) Kewley, L. J., Dopita, M. A., Sutherland, R. S., Heisler, C. A., & Trevena, J. 2001, ApJ, 556, 121
- Kewley et al. (2006) Kewley, L. J., Groves, B., Kauffmann, G., & Heckman, T. 2006, MNRAS, 372, 961
- Khoperskov et al. (2018) Khoperskov, S., Haywood, M., Di Matteo, P., et al. 2018, A&A, 609, A60.
- Kim et al. (2017) Kim, E., Hwang, H. S., Chung, H., et al. 2017, ApJ, 845, 93
- Kormendy & Kennicutt (2004) Kormendy, J., & Kennicutt, R. C., Jr. 2004, ARA&A, 42, 603
- Kruk et al. (2018) Kruk, S. J., Lintott, C. J., Bamford, S. P., et al. 2018, MNRAS, 473, 4731
- Law et al. (2016) Law, D. R., Cherinka, B., Yan, R., et al. 2016, AJ, 152, 83
- Lee et al. (2012) Lee, G.-H., Park, C., Lee, M. G., & Choi, Y.-Y. 2012, ApJ, 745, 125
- Lee et al. (2015) Lee, N., Sanders, D. B., Casey, C. M., et al. 2015, ApJ, 801, 80
- Lilly & Carollo (2016) Lilly, S. J., & Carollo, C. M. 2016, ApJ, 833, 1
- Lin et al. (2017) Lin, L., Li, C., He, Y., Xiao, T., & Wang, E. 2017, ApJ, 838, 105
- Lintott et al. (2011) Lintott, C., Schawinski, K., Bamford, S., et al. 2011, MNRAS, 410, 166
- Lintott et al. (2008) Lintott, C. J., Schawinski, K., Slosar, A., et al. 2008, MNRAS, 389, 1179
- Lotz et al. (2011) Lotz, J. M., Jonsson, P., Cox, T. J., et al. 2011, ApJ, 742, 103
- Medling et al. (2018) Medling, A. M., Cortese, L., Croom, S. M., et al. 2018, MNRAS, 475, 5194
- Morselli et al. (2017) Morselli, L., Popesso, P., Erfanianfar, G., & Concas, A. 2017, A&A, 597, A97
- Martig et al. (2009) Martig, M., Bournaud, F., Teyssier, R., & Dekel, A. 2009, ApJ, 707, 250
- Nair & Abraham (2010) Nair, P. B., & Abraham, R. G. 2010, ApJS, 186, 427
- O’Donnell (1994) O’Donnell, J. E. 1994, ApJ, 422, 158
- Pan et al. (2015) Pan, Z., Li, J., Lin, W., et al. 2015, ApJ, 804, L42
- Papaderos et al. (2013) Papaderos, P., Gomes, J. M., Vílchez, J. M., et al. 2013, A&A, 555, L1
- Peng et al. (2010) Peng, Y.-j., Lilly, S. J., Kovač, K., et al. 2010, ApJ, 721, 193
- Peng et al. (2015) Peng, Y., Maiolino, R., & Cochrane, R. 2015, Nature, 521, 192
- Robichaud et al. (2017) Robichaud, F., Williamson, D., Martel, H., Kawata, D., & Ellison, S. L. 2017, MNRAS, 469, 3722
- Salim et al. (2016) Salim, S., Lee, J. C., Janowiecki, S., et al. 2016, ApJS, 227, 2
- Saintonge et al. (2012) Saintonge, A., Tacconi, L. J., Fabello, S., et al. 2012, ApJ, 758, 73
- Sanders (2006) Sanders, J. S. 2006, MNRAS, 371, 829
- Sarzi et al. (2010) Sarzi, M., Shields, J. C., Schawinski, K., et al. 2010, MNRAS, 402, 2187
- Schawinski et al. (2007) Schawinski, K., Thomas, D., Sarzi, M., et al. 2007, MNRAS, 382, 1415
- Schlegel et al. (1998) Schlegel, D. J., Finkbeiner, D. P., & Davis, M. 1998, ApJ, 500, 525
- She et al. (2017) She, R., Ho, L. C., & Feng, H. 2017, ApJ, 842, 131
- Singh et al. (2013) Singh, R., van de Ven, G., Jahnke, K., et al. 2013, A&A, 558, A43
- Smethurst et al. (2015) Smethurst, R. J., Lintott, C. J., Simmons, B. D., et al. 2015, MNRAS, 450, 435
- Speagle et al. (2014) Speagle, J. S., Steinhardt, C. L., Capak, P. L., & Silverman, J. D. 2014, ApJS, 214, 15
- Spinoso et al. (2017) Spinoso, D., Bonoli, S., Dotti, M., et al. 2017, MNRAS, 465, 3729
- Tacchella et al. (2015) Tacchella, S., Carollo, C. M., Renzini, A., et al. 2015, Science, 348, 314
- Tacchella et al. (2018) Tacchella, S., Carollo, C. M., Förster Schreiber, N. M., et al. 2018, ApJ, 859, 56.
- Toomre (1964) Toomre, A. 1964, ApJ, 139, 1217
- Tremonti et al. (2004) Tremonti, C. A., Heckman, T. M., Kauffmann, G., et al. 2004, ApJ, 613, 898
- Vazdekis et al. (2012) Vazdekis, A., Ricciardelli, E., Cenarro, A. J., et al. 2012, MNRAS, 424, 157
- Wang et al. (2012) Wang, J., Kauffmann, G., Overzier, R., et al. 2012, MNRAS, 423, 3486
- Weinberger et al. (2017) Weinberger, R., Springel, V., Hernquist, L., et al. 2017, MNRAS, 465, 3291
- Weinberger et al. (2018) Weinberger, R., Springel, V., Pakmor, R., et al. 2018, MNRAS, 479, 4056.
- Whitaker et al. (2017) Whitaker, K. E., Bezanson, R., van Dokkum, P. G., et al. 2017, ApJ, 838, 19
- Willett et al. (2013) Willett, K. W., Lintott, C. J., Bamford, S. P., et al. 2013, MNRAS, 435, 2835
- Wuyts et al. (2011) Wuyts, S., Förster Schreiber, N. M., van der Wel, A., et al. 2011, ApJ, 742, 96
- Yan & Blanton (2012) Yan, R., & Blanton, M. R. 2012, ApJ, 747, 61
- Yuan et al. (2015) Yuan, F., Gan, Z., Narayan, R., et al. 2015, ApJ, 804, 101
- Yuan et al. (2018) Yuan, F., Yoon, D., Li, Y.-P., et al. 2018, ApJ, 857, 121
- Zolotov et al. (2015) Zolotov, A., Dekel, A., Mandelker, N., et al. 2015, MNRAS, 450, 2327