Mean proper motions, space orbits and velocity dispersion profiles of Galactic globular clusters derived from Gaia DR2 data
Abstract
We have derived the mean proper motions and space velocities of 154 Galactic globular clusters and the velocity dispersion profiles of 141 globular clusters based on a combination of Gaia DR2 proper motions with ground-based line-of-sight velocities. Combining the velocity dispersion profiles derived here with new measurements of the internal mass functions allows us to model the internal kinematics of 144 clusters, more than 90% of the currently known Galactic globular cluster population. We also derive the initial cluster masses by calculating the cluster orbits backwards in time applying suitable recipes to account for mass loss and dynamical friction. We find a correlation between the stellar mass function of a globular cluster and the amount of mass lost from the cluster, pointing to dynamical evolution as one of the mechanisms shaping the mass function of stars in clusters. The mass functions also show strong evidence that globular clusters started with a bottom-light initial mass function. Our simulations show that the currently surviving globular cluster population has lost about 80% of its mass since the time of formation. If globular clusters started from a log-normal mass function, we estimate that the Milky Way contained about 500 globular clusters initially, with a combined mass of about M⊙. For a power-law initial mass function, the initial mass in globular clusters could have been a factor of three higher.
keywords:
globular clusters: general – stars: luminosity function, mass function1 Introduction
The second data release of the Gaia mission (Gaia Collaboration et al., 2018b) has provided five astrometric parameters for more than 1.3 billion stars in the Milky Way. Compared to its predecessor HIPPARCOS (Perryman et al., 1997), the median accuracy in the proper motions and parallaxes has increased by a factor 50 while the number of studied stars has increased by more than a factor 10,000. In addition, Gaia DR2 contains line-of-sight velocities for more than 7 million stars. With this wealth of information of unprecedented accuracy, Gaia DR2 has a profound impact in many fields of astrophysics, like stellar astrophysics (Gaia Collaboration et al., 2018a), the study of the dynamics of the Milky Way and other nearby galaxies (e.g. Fritz et al., 2018) and even the study of massive black holes in the distant universe (e.g. Wolf et al., 2018).
In the present paper we apply the Gaia DR2 data to study the motion and internal kinematics of globular clusters in the Milky Way. Gaia Collaboration et al. (2018c) have already determined the mean proper motions of about half of all Milky Way globular clusters based on the Gaia DR2 data, while Vasiliev (2018) has determined the mean proper motion of 75 of the remaining clusters. In this paper we add several additional clusters which so far have no determined proper motion, resulting in a near complete sample of globular clusters with measured proper motions. In addition, we also improve the accuracy of the mean line-of-sight velocities of globular clusters by using the Gaia proper motions to remove field stars from the sample of stars with measured line-of-sight velocities. The main part of the paper is then devoted to study the internal kinematics of the globular clusters, deriving proper motion dispersions from the Gaiaa DR2 data and combining these with stellar line-of-sight velocities to determine the internal velocity dispersion profiles. We then use -body models to derive the present-day masses of the clusters.
We thus derive a complete picture of the Galactic globular cluster population in terms of present-day orbital and structural parameters. This information will be useful to understand the formation history of the Milky Way halo (accreted vs. in-situ) (e.g Myeong et al., 2018), the total mass of the Milky Way and the shape of its dark matter halo using globular cluster orbits (e.g Posti & Helmi, 2018), the formation of massive star clusters in the early universe, and to understand the evolution and mass loss of globular clusters and the contribution of stars lost by them to the bulge and stellar halo of the Milky Way (e.g Brandt & Kocsis, 2015; Fragione, Antonini & Gnedin, 2018), and we will briefly discuss some of these questions in our paper.
Our paper is organized as follows: In section 2 we describe the selection of cluster members in the Gaia catalogue, the derivation of the mean proper motions and the proper motion velocity dispersion profiles and the -body fits to the observational data. Sec. 3 presents our results and in sec. 4 we draw our conclusions.
2 Analysis
2.1 Cluster sample and selection of target stars
Our target list of globular clusters was taken from the 2010 edition of Harris (1996), which lists 157 globular clusters. To this list we added the following three clusters that have been found to be Globular clusters: Crater (Laevens et al., 2014), FSR 1716 (Minniti et al., 2017) and Mercer 5 (Mercer et al., 2005; Longmore et al., 2011). We omitted the clusters Koposov 1 and Koposov 2 since Paust, Wilson & van Belle (2014) found that they are more likely to be several Gyr old open clusters removed from the Sagittarius dwarf galaxy. In addition, they found that both clusters have masses of less than 2,000 M⊙, but steep stellar mass functions, implying that Koposov 1 and Koposov 2 also formed as low-mass objects and are not stripped down versions of globular clusters. We also removed GLIMPSE-C01 for which Davies et al. (2011) concluded that it is a 400-800 Myr, intermediate-age disc cluster, and BH 176 which was also found to be an old, metal-rich open cluster that could belong to the galactic thick disc (Davoust, Sharina & Donzelli, 2011; Sharina et al., 2014).
We are thus left with a sample of 156 globular clusters. For each of these clusters we selected all Gaia stars within a circle of 1200 arcsec around the cluster centers given by either Goldsbury, Heyl & Richer (2013) or Harris (1996). For IC 1257 and Ter 10 we found that the cluster centers given in Harris (1996) were incorrect and determined new centers from the positions of the member stars found in the Gaia DR2 catalogue. For each globular cluster, we then cross-correlated the Gaia positions against the catalogue of 40,000 globular stars with line-of-sight velocity measurements compiled by Baumgardt & Hilker (2018) from published literature and archival ESO and Keck spectra. Using a search radius of 1”, we were able to find Gaia DR2 counterparts for about 95% of all stars with measured line-of-sight velocities from Baumgardt & Hilker (2018). For each cluster star, the individual line-of-sight velocity measurements from the ESO/Keck Science Archives, published literature measurements and Gaia DR2 were averaged and if found too discrepant from each other, the stars were flagged as possible binaries and not used in the later analysis. If necessary, the Gaia line-of-sight velocity measurements were shifted in each cluster to bring them onto a common mean velocity with the Baumgardt & Hilker (2018) velocities. The necessary shifts were usually less than 0.5 km/sec, in agreement with the systematic offset in the Gaia line-of-sight velocities found by Katz et al. (2018) for faint stars.
2.2 Derivation of the mean proper motions
From the sample of stars found within 1200 arcsec of the center of each cluster, we removed all stars that had line-of-sight velocities which deviated by more than from the mean cluster velocity. We also removed stars with parallaxes that deviate by more than from the expected parallax calculated using the distance given in Harris (1996). We also removed stars with Gaia magnitudes brighter than 1 magnitude or colors redder than 0.5 magnitudes than the tip of the RGB to exclude obvious non-members from the determination of the mean cluster motion and internal velocity dispersion. To guide us in choosing these limits, we calculated MESA isochrones (Dotter, 2016; Paxton et al., 2015) for each individual cluster and varied the assumed extinction until we obtained the best match of the MESA isochrone against the position of the cluster members in a vs. color-magnitude diagram. We also removed all stars which showed significant astrometric excess noise together with an astrometric excess noise significance as given in fields 33 and 34 of the final Gaia catalogue, or for which the astrometric goodness-of-fit parameter given in the Gaia DR2 catalogue was larger than 3.5.
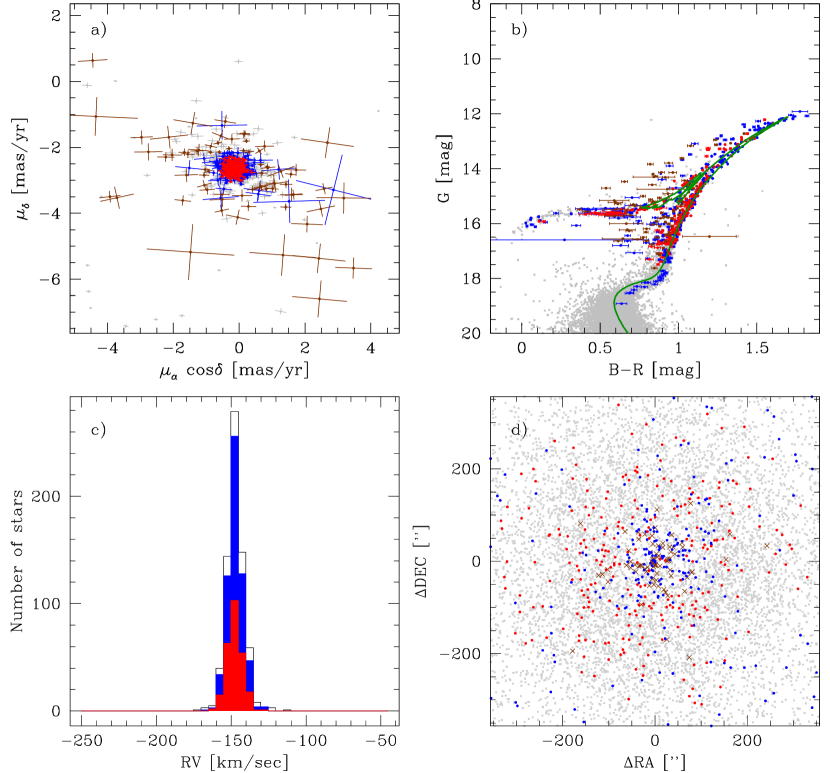
We furthermore removed stars which had too large proper motion errors. The maximum velocity error up to which we accepted stars was varied from cluster to cluster, but was generally of the order of about 1.5 times the central velocity dispersion of the giant stars, i.e. about 5 to 15 km/sec. We found that accepting stars with too large proper motion errors or astrometric excess noise generally lead to an overestimation of the proper motion dispersion profiles, however for small enough cut-offs the dispersion profiles did not depend on the chosen cut-off. For a few distant halo clusters or for heavily obscured bulge clusters, which had only few members in the Gaia catalogue, we accepted stars with velocity errors up to 50 km/sec for the calculation of the mean cluster motion. We also applied cuts in distance from the cluster centre to minimize field star contamination and excluded the centres of a few bright clusters where the stars showed large deviations from the mean motion of the cluster. The outer distance limits were varied on a cluster to cluster basis, but were usually of the order of 100 to 700 arcsec, depending on the field star density and how well the cluster proper motion separates a cluster from the field stars. We adopted about twice as large distance limits for stars with line-of-sight velocity measurements than for stars without line-of-sight velocity information, since a matching line-of-sight velocity significantly reduces the probability that a cluster star is a field star. Fig. 1 illustrates our selection process of cluster members for the globular cluster NGC 5272 (M 3).
Our first estimate for the mean proper motion of each cluster was then calculated by averaging the mean proper motion of all stars that are known cluster members based on their line-of-sight velocities. For clusters located in fields with a very strong background density of stars, we obtained a first estimate by visually inspecting the proper motion distribution of all stars within 50 arcsec of the cluster centre. We then determined all stars that have a proper motion within 2 of the mean cluster motion, taking into account the intrinsic velocity dispersion of the cluster as well as the proper motion error of each star, and calculated a new estimate for the mean proper motion of a cluster based on these possible members. This process was repeated until the mean cluster motion and the list of cluster members became stable between successive iterations.
The mean proper motion, its error and the correlation between the two proper motion components were determined from the member stars as follows: Starting from eq. 10 of Lindegren, Madsen & Dravins (2000), the combined log Likelihood for an ensemble of stars each with its own proper motion , associated errors , and covariance is given by:
| (1) | ||||
Here and are the mean cluster motions in right ascension and declination and is the internal velocity dispersion of the cluster, which we either took from the best-fitting -body models of Baumgardt & Hilker (2018) or from our new fits that we derived in this paper. Calculating the first derivative of the above equation with respect to and and setting it to zero gives the best-fitting values for the mean motion. The associated errors and the correlation between the proper motion components were then calculated from the second derivatives according to:
| (2) |
The mean proper motions that we have derived are in good agreement with the ones found by the Gaia Collaboration et al. (2018c) and Vasiliev (2018), however since their data is also based on the Gaia DR2 data, their proper motions do not provide a fully independent check of our results. Fig. 2 shows the differences in the mean proper motions derived in this work vs. the mean cluster proper motions that were derived by Sohn et al. (2018) from multi-epoch HST data. It can be seen that the resulting residuals are larger than expected based on the statistical errors alone since the proper motions of some clusters deviate by more than 3 from each other. Most discrepant is NGC 5466, for which the Gaia and HST proper motions differ by more than 5 in each direction, pointing either to strong systematics in the Gaia catalogue in the field of NGC 5466 or a problem in the HST data. Excluding NGC 5466, the residuals in the HST vs. the Gaia proper motions are in agreement within the uncertainties if we assume a systematic error of 0.10 mas/yr in either the Gaia or HST proper motions, in good agreement with the value of 0.07 mas/yr derived by Lindegren et al. (2018) for the size of systematics on small angular scales in the Gaia DR2 proper motions.
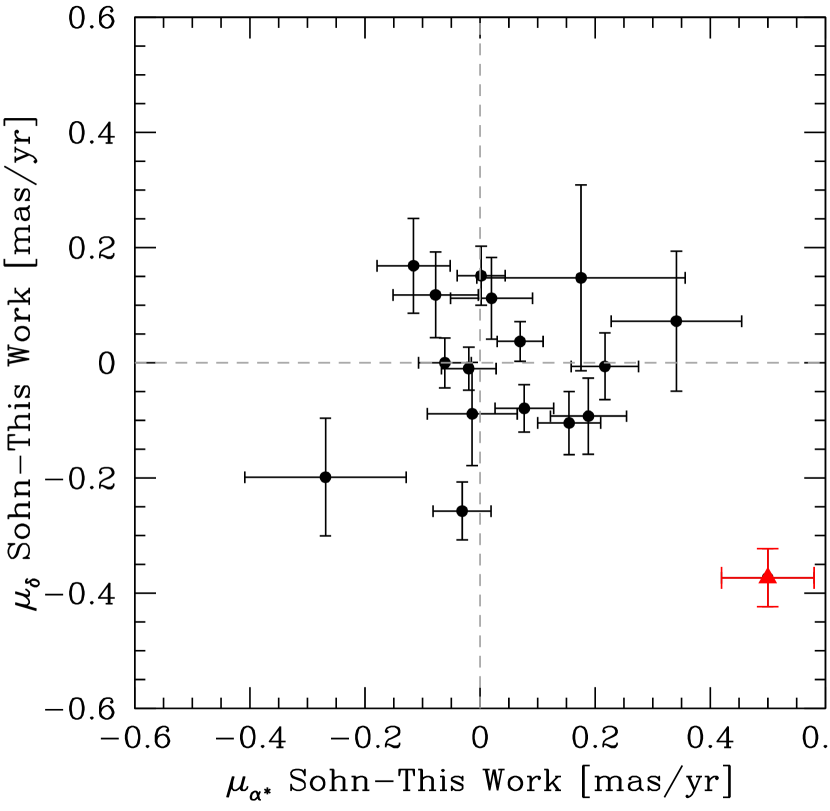
Table 1 presents the mean cluster proper motions that we derived from the Gaia DR2 data. For GLIMPSE C02 and 2MASS-GC01 we could not reliably identify any cluster members in Gaia DR2 and so these clusters are not listed. For the other clusters we derived mean proper motions based on between 2 and 2300 stars. The total number of cluster stars in Gaia DR2 is usually higher than the number of stars used by us, however, adding more stars would not have increased the accuracy of our solution, since, as shown in Fig. 1 of Vasiliev (2018), when more than 100 stars are used to derive the mean proper motion, the formal accuracy of the mean proper motion drops below the large-scale systematic errors of Gaia DR2.
We also calculated mean line-of-sight velocities and their errors from the cluster members. For clusters that were not studied by Baumgardt (2017) or Baumgardt & Hilker (2018), we first searched the published literature as well as the ESO and Keck Science archives for additional line-of-sight velocity measurements and unpublished spectra. Additional literature that was used in this paper is listed in Table 7 and the reduction of the archival ESO and Keck data was done as described in Baumgardt & Hilker (2018). We list the mean line-of-sight velocities together with their errors in Table 1. Our solution for the mean line-of-sight velocity of Ter 9 is somewhat uncertain due to the large number of background stars in the field and the fact that the mean cluster motion is based on only two stars that have both a measured line-of-sight velocity and a proper motion in Gaia DR2. Our solution for the mean line-of-sight velocity ( km/sec) also differs significantly from the one found by Vásquez et al. (2018) () km/sec and Harris (1996) ( km/sec). The orbits of 2MASS-GC02 and Mercer 5 are also somewhat uncertain due to the very large extinction of both clusters, which makes identifying members in Gaia difficult. In addition, the line-of-sight velocities of both clusters are uncertain. If our space motion is correct, both clusters move on orbits that are almost perfectly aligned with the Galactic plane and stay within 200 pc of the plane of the Milky Way’s disc.
2.3 Internal cluster kinematics
We calculated internal velocity dispersion profiles of globular clusters from both the line-of-sight velocities and the Gaia proper motions. For the line-of-sight velocity dispersion profiles, we followed the maximum-likelihood approach described by Baumgardt (2017) and Baumgardt & Hilker (2018). For stars with measured proper motions in Gaia DR2, we used the proper motions to remove non-members before calculating the line-of-sight velocity dispersion profiles. For stars without measured proper motions, we used only the line-of-sight velocities to remove non-members. Proper motion cleaning was most useful for the outer parts of bulge globular clusters, where it generally lead to a reduction of the velocity dispersion profile and a better agreement with the best-fitting -body models. In total we were able to determine line-of-sight velocity dispersion profiles for 127 globular clusters.
The proper motion dispersion profiles were calculated from the member stars with accurate proper motions selected in the previous section. We sorted these stars as a function of their distance from the cluster centre, transformed the proper motion of each star into a coordinate system in which both proper motion components are uncorrelated with each other, and then treated both proper motion components as independent measurements. The proper motion velocity dispersion profiles were then calculated in the same way as the line-of-sight velocity dispersion profiles. We did not correct for perspective effects (e.g. van de Ven et al., 2006) since these are usually less than 0.1 km/sec, i.e. significantly smaller than the cluster velocity dispersions themselves. In total we could determine internal velocity dispersion profiles for 103 globular clusters based on the Gaia proper motions. For 93 of these we were able to also determine the line-of-sight velocity dispersion profiles, while the remaining 10 only have proper motion dispersion profiles. Table 10 lists the proper motion dispersion profiles that we determined from the Gaia proper motions111The velocity dispersion profiles together with all other data and figures depicting our fits to individual clusters can also be found at https://people.smp.uq.edu.au/HolgerBaumgardt/globular/.
We also checked for the impact of a possible underestimation of the statistical parallax and proper motion errors in Gaia DR2 as found by Lindegren et al. (2018) and Mignard et al. (2018) on the internal velocity dispersion profiles. To this end we increased the statistical errors by 10% and rerun all our fits. We found that the velocity dispersion profiles of bright clusters are not affected by such an underestimation since the velocity dispersions of such clusters are determined mainly by bright stars which have errors smaller than the internal velocity dispersion. For faint clusters, the derived velocity dispersions can change by up to 10%, however even then the changes remain usually within the formal error bars of the velocity dispersions.
2.4 Surface density profiles and stellar mass functions
The surface density profiles of 118 globular clusters were already compiled by us based on published literature and our own measurements in Baumgardt & Hilker (2018). For the remaining clusters we took the surface density profiles either from Trager, King & Djorgovski (1995) or other literature papers, as listed in Table 7. When several measurements of the surface density profile were available, we combined them to increase the spatial coverage and accuracy of the observed surface density profile. HP 1, NGC 6522, NGC 6453, NGC 6540, Ter 1, Ter 3 and Ter 4 did not have well determined published surface density profiles, so we determined surface density profiles for these clusters from the near-infrared photometric data presented by Valenti, Ferraro & Origlia (2007) and Valenti, Ferraro & Origlia (2010).
The stellar mass functions of 42 clusters were already used by us in Baumgardt & Hilker (2018), based mainly on the results obtained by Sollima & Baumgardt (2017) from an analysis of the HST/ACS Treasury project data (Sarajedini et al., 2007). To this data we added stellar mass functions of an additional 55 clusters in order to improve the accuracy of our -body fitting and to be able to fit clusters that do not have kinematic data. We took 17 of these mass function measurements, based mainly on either HST/WFPC2 or HST/ACS data from published literature and list this data in Table 7. In addition, we fitted the HST/ACS photometry of an additional 38 clusters from the MAST archive, using PARSEC isochrones (Bressan et al., 2012) to transform stellar magnitudes into masses. For the clusters that we fitted ourselves, we corrected the CMDs for variable extinction following the procedures in Bellini et al. (2017b) before deriving stellar masses from the isochrones, and applied artificial stars tests according to Bellini et al. (2017a) to correct the derived mass functions for incompleteness at the faint end.
Together with the mass functions published by Sollima & Baumgardt (2017), we now have a sample of 97 globular clusters that have measured mass functions, i.e. nearly 2/3 of all known Galactic globular clusters. For each cluster we determined the exact location of each individual HST field on the sky using the information found in the MAST Archive. For the comparison with the mass functions from the -body models, we projected the -body models onto the sky and determined mass functions only for stars that are located within these HST fields. In total we were able to obtain either kinematic or mass function data for 144 out of the 156 Galactic globular clusters, i.e. about 90% of all clusters.
2.5 -body fits of the cluster data
We fitted the line-of-sight velocity and proper motion velocity dispersion profiles calculated in the previous section by a grid of dedicated -body simulations to obtain the cluster parameters like total masses, half-light and half-mass radii. The details of the fitting procedure can be found in Baumgardt (2017) and Baumgardt & Hilker (2018). In short, we searched a grid of about 1,600 -body simulations of isolated star clusters with varying sizes, initial density profiles and initial mass functions until we found the model which best reproduces the observed velocity dispersion and surface density profile and the observed stellar mass function of each globular cluster. For the fitting, the -body models were scaled to match the size of each individual cluster and we fitted the surface density, velocity dispersion profiles and, if available, the stellar mass function of the clusters. We interpolated in our grid of -body models to increase the number of models available for comparison and improve the accuracy of our fits.
In this paper we expanded our fitting method to be able to fit clusters that have only a measured mass function but no kinematical information. We did this by guessing a value for the velocity dispersion at the half-mass radius of the clusters and then varying this value until our best-fitting -body model predicts the same absolute number and the same distribution of stars over mass as seen in the observed clusters. We also applied this method to low-mass clusters with kinematic information like Pal 13, since we found that the observed number of cluster stars was significantly below the predicted number based on the velocity dispersion profile in these clusters. We attribute this difference to the influence of undetected binary stars which inflate the velocity dispersion profile (e.g Blecha et al., 2004) and regard the mass derived from the mass function fit as the more reliable value.
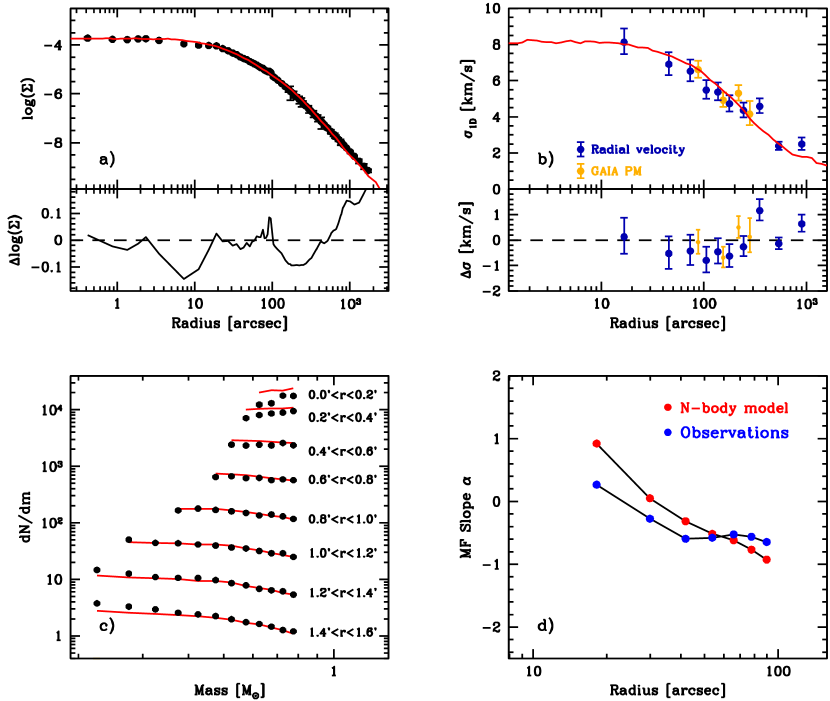
Fig. 3 compares as an example the observational data for NGC 5272 (M 3) with our best-fitting -body model. It can be seen that we obtain a very good fit to the observational data for this cluster. The best-fitting cluster mass that we obtain from matching the observed velocity dispersion profile of NGC 5272 ( M⊙) also predicts the correct number of main sequence stars in the range M⊙ as determined by Sollima & Baumgardt (2017) in the central 1.6 arcmin. In addition, the Gaia proper motion velocity dispersion profile is in good agreement with the line-of-sight velocity dispersion profile. Additional examples of fits to individual globular clusters can be found in Baumgardt & Hilker (2018) and on our globular cluster website.
3 Results
3.1 Cluster distances
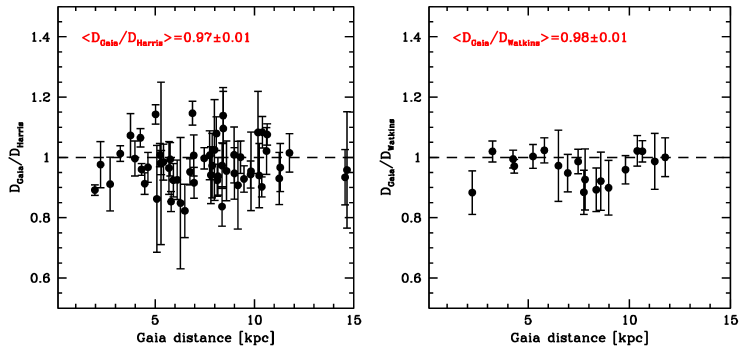
For clusters that have both well determined proper motion and line-of-sight velocity dispersion profiles we can also derive kinematic cluster distances from the fitting of the -body models. To this end we varied the assumed cluster distance until the combined value derived from fitting the -body models to the observed velocity dispersions is minimal. Fig. 4 shows a comparison of the distances derived in this way against the clusters distances given in the Harris catalogue (left panels) and the kinematic distances derived by fitting our -body models only against the HST proper motion dispersion profiles of Watkins et al. (2015a), which are based on the high-precision HST proper motions of Bellini et al. (2014). It can be seen that we usually find very good agreement between the distances derived using the Gaia proper motions and either the distances in the Harris catalogue (which are mainly based on isochrone fitting of the clusters’ color-magnitude diagrams) and the kinematic distances using only the HST data. The average ratio of the Gaia distances to the distances in the Harris catalogue is while it is for the kinematic distances based only on HST proper motions. Both values are very close to unity. Also the typical distance differences (8% vs. the Harris data and 5% against the Watkins data) are of the same order as what one should expect based on the distance errors. The agreement is especially good for distances up to about 7 kpc. For larger distances the Gaia distances are on average 10% smaller than the other distance estimates, which could point to the fact that systematic effects become important at larger distances due to the small proper motions of the stars.
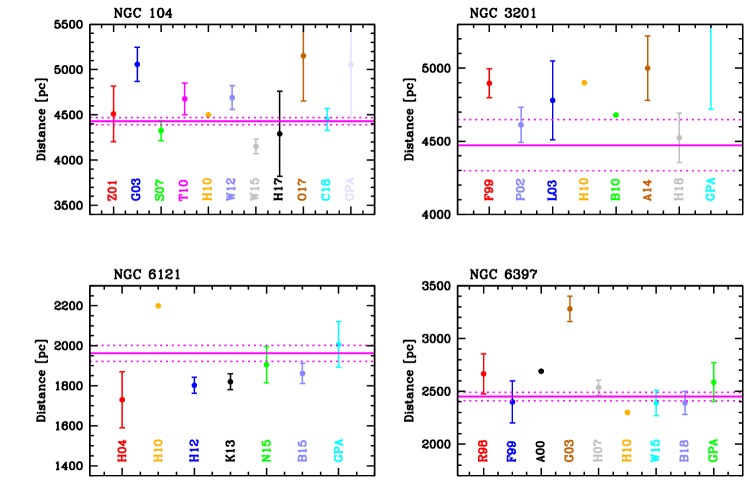
Another way to test for the accuracy of the kinematic distances is to compare them for a number of nearby clusters with distance estimates from the literature. We depict such a comparison in Fig. 5. In this Figure, the kinematic cluster distance derived from the -body modeling of the cluster is shown by a solid line, with dashed lines indicating the upper and lower error bars. Circles indicate a number of recent determinations from the literature. The abbreviations of the used papers can be found in the list of references. For NGC 104 and NGC 6397 the kinematic distance is derived from a simultaneous fit of the Watkins et al. (2015a) and the Gaia proper motions, for the other two clusters it is based solely on the Gaia proper motions. It can be seen that for NGC 104, NGC 3201 and NGC 6397, the kinematic distances are in good agreement with recent literature determinations. The only significant deviation could be NGC 6121 where our kinematic distance is about 100 to 150 pc higher than recent literature values. However the Gaia distance agrees well with the distance derived from the Gaia parallaxes (once a systematic error of 0.04 mas is added to the error of the mean parallax obtained from the member stars) and the Harris (2010) distance is even larger than the Gaia distance. We conclude that the kinematic distances that we have determined should be fairly reliable. We therefore calculate new distances to globular clusters by taking a weighted mean of our kinematic distances and the distance from the Harris catalogue, assuming a relative distance error of 10% for the Harris distances. The distances and their errors calculated this way are shown by italics in Table 1 and we list the distances that we obtain from our kinematic fits in Table 9.
3.2 Space orbits and initial mass distribution
In order to convert the mean proper motions derived in the previous section into velocities, we either used the distances that we determined kinematically in the previous section, or, for clusters without kinematic distances, we used the distances from Baumgardt & Hilker (2018) or Harris (1996). From the distances and cluster velocities we also derived the space motions of the clusters, assuming a distance of kpc of the Sun from the Galactic centre (Gravity Collaboration et al., 2018) and a velocity of (U, V, W)⊙ = (11.1, 12.24, 7.25) km/sec of the Sun relative to the local standard of rest (Schönrich, Binney & Dehnen, 2010). We also assumed a circular velocity of 240 km/sec at the position of the Sun, which is in agreement with the proper motion of Sgr A* as determined by Reid & Brunthaler (2004) and our adopted distance to the Galactic centre. We then integrated the cluster orbits backwards in time for 2 Gyrs, using a fourth-order Runge-Kutta integrator and determined the average perigalactic and apogalactic distances for each cluster. Table 1 lists the values that we obtain for the Milky Way mass model presented in Table 1 of Irrgang et al. (2013). Their model is an updated version of the model suggested by Allen & Santillan (1991) and yields a very good match to recent determinations of the rotation curve of the Milky Way, the in-plane proper motion of Sgr A*, and the local mass/surface density. As a check of the robustness of our results, we also calculated cluster orbits using the Milky Way models of Johnston, Spergel & Hernquist (1995) and the best-fitting model of McMillan (2017), but found only little difference in the final results compared to the Irrgang et al. model.
In order to get an idea of the initial cluster masses, we also calculated the cluster orbits backward in time over 12 Gyr. In this case we applied dynamical friction to the cluster orbits according to eq. 7-17 of Binney & Tremaine (1987):
| (3) |
where is the velocity of a globular cluster, its mass, the Coulomb logarithm, the density of background stars at the position of the cluster and the ratio of the globular cluster velocity over the velocity dispersion of the background stars (taken to be times the local circular velocity) at the position of the cluster. During the integration we also applied mass loss to the cluster orbits assuming that clusters lose mass linearly over their lifetime, i.e.:
| (4) |
The lifetime of a cluster was calculated based on eqs. 10 and 12 of (Baumgardt & Makino, 2003):
| (5) | |||||
and
| (6) |
In the above equations, is the initial mass of a globular cluster, , the initial number of cluster stars, M⊙ is the initial mean mass of a star in a cluster, is the circular velocity of the Milky Way and is the orbital eccentricity. In the second equation the factor 0.50 reflects the mass loss due to stellar evolution, which reduces the mass of a cluster by about 50% within the first Gyr of its evolution. We note that the above equations were derived in a spherically symmetric, isothermal galaxy potential and will therefore only give an approximation to the evolution of Milky Way globular clusters. For each cluster we iterate over the initial mass until we obtain the current mass at the age of each individual cluster.
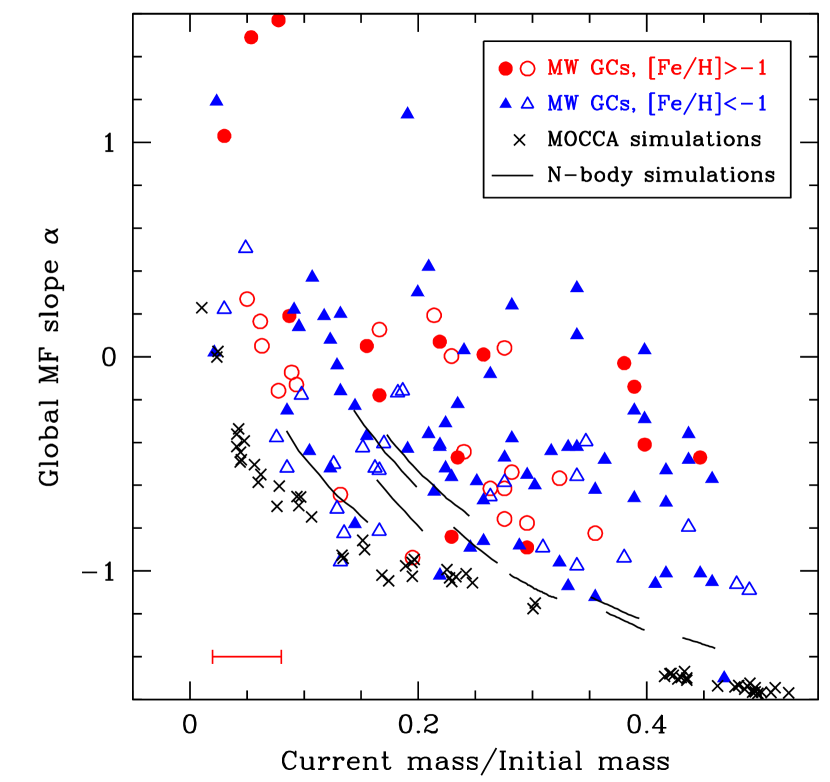
Fig. 6 plots the mass function slope of the best fitting power-law mass function vs. the relative mass still remaining in the clusters. The mass function slopes are derived from the -body fits to the observed mass functions and are valid for main-sequence stars in the mass range M⊙. We splitted the cluster population into metal-rich clusters with [Fe/H] and metal-poor ones with [Fe/H]. Clusters that have measured mass functions are depicted by filled circles/triangles in this plot while open circles/triangles depict clusters without direct mass determinations. For these clusters the mass functions were estimated from the relation between half-mass relaxation time and found by Baumgardt & Hilker (2018): . Here the relaxation time of each cluster is also derived from the -body fits.
It can be seen that Galactic globular clusters show a correlation between their present-day mass function slopes and the amount of mass that has been lost from the clusters, the average mass function slope changes from for clusters that still retain an average of 40% of their initial mass to for clusters that with 20% of their initial mass to for clusters that have inly 10% of their initial mass remaining. Metal-rich and metal-poor GCs follow more or less the same trend, indicating that the correlation is not driven by variations of the mass function with metallicity, but must be due to dynamical mass loss, which pushes low-mass stars towards the outer cluster parts where they are easily removed by the tidal field. The resulting mass loss decreases the cluster masses and also changes the mass function at the low-mass end towards less negative values (fewer low-mass stars). This is confirmed by the solid lines and asterisks, which show the evolution of star clusters from the -body simulations by Baumgardt & Sollima (2017) and the Monte Carlo simulations by Askar et al. (2017) respectively. The data from the simulated clusters is taken at times around Gyr to allow for a direct comparison with the globular clusters. The clusters in the -body simulations start from Kroupa (2001) mass functions initially while the clusters in the Monte Carlo simulations have a slightly more bottom heavy IMF, which explains their initially more negative values. The simulated clusters share the same correlation between mass function slope and mass lost that is seen for the globular clusters, a weaker change in the initial stages followed by stronger changes close to dissolution.
Globular clusters that have lost only a small portion of their mass through dynamical evolution, have an average mass function slope around , flatter by about one dex then the best-fitting power-law mass function slope of a Kroupa (2001) mass function for stars in the mass range M⊙. We take this as strong indication that globular clusters formed with initially bottom-light mass functions. Finally, there is very good agreement in the distribution of both clusters with and without direct mass function determinations, showing that the correlation between the mass lost from a cluster and the overall mass function slope is not driven by selection effects in the cluster sample that has direct mass function determinations.
3.3 Initial globular cluster population of the Milky Way
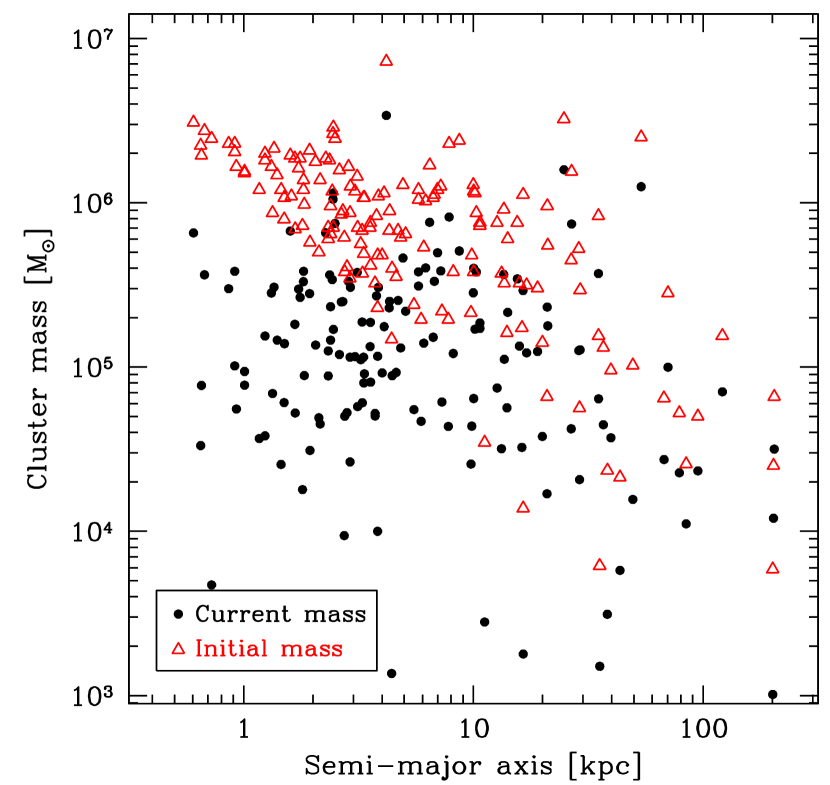
Fig. 7 depicts the distribution of the current and initial cluster masses as a function of the present-day semi-major axis of their orbit in the Milky Way. We calculated the semi-major axes as the mean of the average apogalactic and perigalactic distance of the cluster orbits. The present-day cluster masses are shown by filled circles. They show a weak correlation with the semi-major axis of the orbit, a linear relation between and gives as best-fitting relation . However most of this trend is due to clusters beyond kpc, which are on average less massive than the inner clusters. Excluding these, the relation changes to and is compatible with a mass distribution independent of Galactocentric distance. The reason for the lower masses of outer clusters could either be dynamical evolution having destroyed the M⊙, low-mass clusters in the inner galaxy, or point to a different origin and formation mode of the outer clusters.
In contrast, the initial masses of the globular clusters which have survived to the present time are strongly increasing with decreasing distance to the Galactic centre. Inside 2 kpc in particular, most clusters that can still be found in the Milky Way have started with masses larger than M⊙. This indicates that the current cluster population in the inner parts is most likely just a small portion of the initial population, with the other clusters having either dissolved by the strong tidal field or spiraled into the centre of the Milky Way and merged with the nuclear cluster of the Milky Way (Antonini et al., 2012). We find that the current mass of the Galactic globular cluster system is M⊙, about 1/3 of this mass being in the 10 most massive clusters alone (M19, NGC 5824, M14, 47 Tuc, NGC 2808, NGC 6338, NGC 6441, NGC 2419, M54 and Omega Cen). The initial mass of the currently surviving clusters was M⊙, i.e. the currently surviving globular clusters have on average lost nearly 80% of their mass since the time of their formation through either stellar evolution mass loss or dynamical mass loss. Most of the dynamical mass loss is due to mass lost from low mass clusters in the inner parts of the Milky Way. The average mass-loss reduces slightly to about 75% for clusters with present-day masses larger then M⊙. This is in agreement with the factor 2 to 4
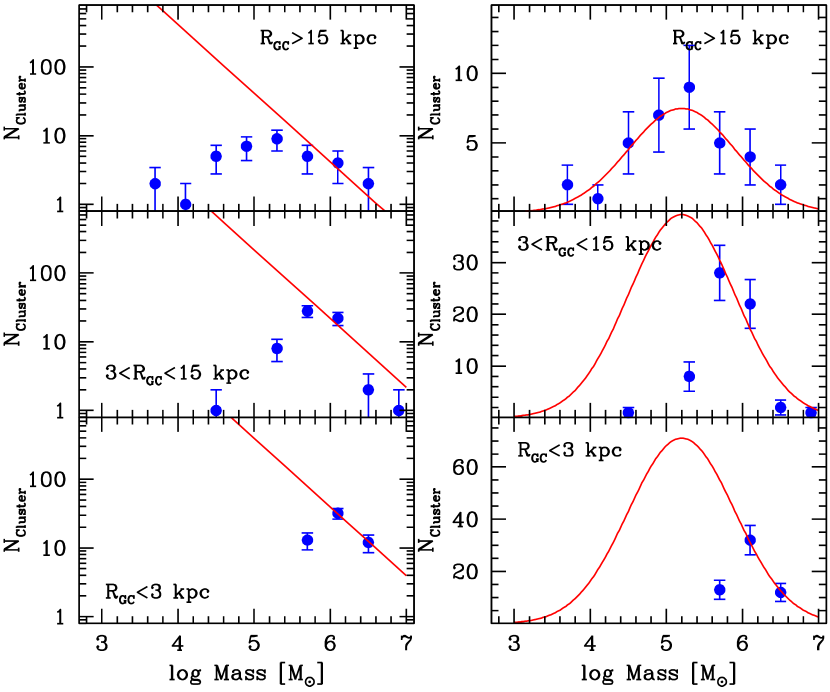
In order to obtain a better estimate of how large the dissolved cluster population could have been, we plot the distribution of initial masses at different Galactocentric distances and fit log-normal distributions to the massive end of the resulting mass distributions. The initial mass distribution of the outermost clusters in the Milky Way with kpc, which should have been least affected by cluster dissolution, is well fitted by a log-normal distribution with mean and scatter (see Fig. 8). Fig. 8 shows the distribution of initial cluster masses if we split the cluster population into three different radial bins. In each bin, the height of the log-normal distributions is chosen to match the number of clusters with masses M⊙. This way, we find that the initial number of clusters was 500 with a combined mass of M⊙, larger by 50% than what is being accounted for by the remaining clusters. We can also fit the cluster distribution by a power-law mass distribution , with , similar to that seen for young star clusters in the Milky Way and other nearby galaxies (Hunter et al., 2003; Gieles et al., 2006; Baumgardt et al., 2013). Assuming lower and upper cut-off values of M⊙ and M⊙ respectively, we then find that about 7000 globular clusters formed in the Milky Way with a combined mass of about M⊙, i.e. about a factor two larger than if clusters started with a log-normal mass distribution. The total mass of the Galactic bulge and halo is however still an order of magnitude higher (Sofue, 2013; Irrgang et al., 2013; Bland-Hawthorn & Gerhard, 2016). It has been suggested that a large fraction of the Milky Way bulge stars have formed through disc instability processes and are not part of a classical bulge formed through mergers early in the formation of the Galaxy (e.g. Wegg & Gerhard, 2013). However even if only 25% of the bulge are part of this classical bulge (Shen et al., 2010), disrupted globular clusters would still account for only a small fraction of the stars in the (classical) bulge and halo, unless most mass was in very low-mass clusters.
4 Conclusions
We have derived the mean proper motions and space velocities of 154 Milky Way globular clusters through a combination of the Gaia DR2 proper motions and ground-based line-of-sight velocities of individual member stars. Our mean proper motions show good agreement with the proper motions determined by Gaia Collaboration et al. (2018c) and Vasiliev (2018) based on Gaia DR2 proper motions. They are also in good agreement with the proper motions derived by Sohn et al. (2018) from HST data if we take a systematic error of 0.10 mas/yr in the Gaia proper motions into account. For about half of all globular clusters, the space velocities are accurate to a few km/sec, however the errors grow to nearly 100 km/sec for the most distant halo clusters. The limiting factor on the accuracy are currently the systematic errors in the Gaia proper motions and uncertainties in the cluster distances. We expect that both these error sources will decrease with future Gaia data releases.
We also derived the velocity dispersion profiles of 103 globular clusters based on the Gaia proper motions. Together with the line-of-sight velocity dispersion profiles published by Baumgardt & Hilker (2018) and new determinations of the stellar mass function of stars in the clusters, this has allowed us to model the internal kinematics of 144 globular clusters, i.e. more than 90% of the total cluster population of the Milky Way through a comparison with the results of a large set of dedicated -body simulations. We have made the derived masses and structural parameters as well as the velocity dispersion profiles available on our globular cluster website https://people.smp.uq.edu.au/HolgerBaumgardt/globular/.
In order to derive the initial mass and the amount of mass lost from each cluster we integrated the cluster orbits backward in time and applied suitable recipes to account for the effects of dynamical friction and mass loss of stars to the clusters. We find a correlation between the present-day mass function slope and the amount of mass that has been lost from a globular cluster, showing that mass segregation and preferential loss of low-mass stars are important mechanisms shaping the mass function of stars in clusters. The mass function slopes are the same for both metal-rich and metal-poor clusters, arguing against a variation of the stellar mass function with metallicity in globular clusters. However given the significant cluster-to-cluster scatter in the mass function slopes, small metallicity dependent mass function variations cannot be ruled out either.
The dynamically least evolved globular clusters have power-law mass function slopes of for main sequence stars in the range 0.2 to 0.8 M⊙, higher by about one dex than a Kroupa mass function over the same mass range. We take this as strong indication that globular clusters have started with bottom-light mass functions. Such a bottom-light mass function has recently been predicted for high red-shift galaxies with due to heating from the cosmic microwave background radiation by Jermyn, Steinhardt & Tout (2018). A bottom-light mass function could ease the tension between the large fraction of second generation stars seen in globular clusters and the much smaller fractions expected based on the yields of massive stars (Bastian & Lardo, 2015; Renzini et al., 2015), since with fewer low-mass stars present initially, a larger fraction can be polluted. A detailed numerical modeling of the different formation scenarios suggested for 2nd generation stars and their yields will be necessary in order to see if the mass budget problem can be solved this way.
Finally, the combined initial mass of all globular clusters that have survived to the present time was around M⊙, a factor 5 larger than their current combined mass. Most surviving clusters in the inner parts of the Milky Way started with masses larger than M⊙, even though for some clusters their present-day masses are up to a factor 100 lower. For a universal initial cluster mass function independent of galactocentric radius, this implies a large population of destroyed globular clusters in the inner parts of the Milky Way. The exact number of surviving clusters depends on the initial cluster mass function. If this mass function was a log-normal mass function, the initial number was around 500 clusters, rising to about 7,000 clusters for a power-law mass function.
Acknowledgments
We thank Roger E. Cohen and Daniel Weisz for sharing their data with us and an anonymous referee for comments that helped improve the presentation of our paper. This work has made use of data from the European Space Agency (ESA) mission Gaia (https://www.cosmos.esa.int/gaia), processed by the Gaia Data Processing and Analysis Consortium (DPAC, https://www.cosmos.esa.int/web/gaia/dpac/consortium). Funding for the DPAC has been provided by national institutions, in particular the institutions participating in the Gaia Multilateral Agreement. This paper is also based on data obtained from the ESO Science Archive Facility. This research has made use of the Keck Observatory Archive (KOA), which is operated by the W. M. Keck Observatory and the NASA Exoplanet Science Institute (NExScI), under contract with the National Aeronautics and Space Administration. Some of the data presented in this paper was obtained from the Mikulski Archive for Space Telescopes (MAST). STScI is operated by the Association of Universities for Research in Astronomy, Inc., under NASA contract NAS5-26555. Support for MAST for non-HST data is provided by the NASA Office of Space Science via grant NNX09AF08G and by other grants and contracts.
References
- Abolfathi et al. (2018) Abolfathi B. et al., 2018, ApJS, 235, 42
- Allen & Santillan (1991) Allen C., Santillan A., 1991, Rev. Mexicana Astron. Astrofis., 22, 255
- Anthony-Twarog & Twarog (2000) Anthony-Twarog B. J., Twarog B. A., 2000, AJ, 120, 3111, (A00)
- Antonini et al. (2012) Antonini F., Capuzzo-Dolcetta R., Mastrobuono-Battisti A., Merritt D., 2012, ApJ, 750, 111
- Arellano Ferro et al. (2014) Arellano Ferro A., Ahumada J. A., Calderón J. H., Kains N., 2014, Rev. Mexicana Astron. Astrofis., 50, 307, (A14)
- Askar et al. (2017) Askar A., Szkudlarek M., Gondek-Rosińska D., Giersz M., Bulik T., 2017, MNRAS, 464, L36
- Barbuy et al. (2018) Barbuy B. et al., 2018, ArXiv e-prints
- Bastian & Lardo (2015) Bastian N., Lardo C., 2015, MNRAS, 453, 357
- Baumgardt (2017) Baumgardt H., 2017, MNRAS, 464, 2174
- Baumgardt & Hilker (2018) Baumgardt H., Hilker M., 2018, MNRAS, 478, 1520
- Baumgardt & Makino (2003) Baumgardt H., Makino J., 2003, MNRAS, 340, 227
- Baumgardt et al. (2013) Baumgardt H., Parmentier G., Anders P., Grebel E. K., 2013, MNRAS, 430, 676
- Baumgardt & Sollima (2017) Baumgardt H., Sollima A., 2017, MNRAS, 472, 744
- Bellazzini et al. (2012) Bellazzini M., Dalessandro E., Sollima A., Ibata R., 2012, MNRAS, 423, 844
- Bellini et al. (2017a) Bellini A., Anderson J., Bedin L. R., King I. R., van der Marel R. P., Piotto G., Cool A., 2017a, ApJ, 842, 6
- Bellini et al. (2017b) Bellini A., Anderson J., van der Marel R. P., King I. R., Piotto G., Bedin L. R., 2017b, ApJ, 842, 7
- Bellini et al. (2014) Bellini A. et al., 2014, ApJ, 797, 115
- Bland-Hawthorn & Gerhard (2016) Bland-Hawthorn J., Gerhard O., 2016, ARA&A, 54, 529
- Blecha et al. (2004) Blecha A., Meylan G., North P., Royer F., 2004, A&A, 419, 533
- Bonatto & Bica (2008) Bonatto C., Bica E., 2008, A&A, 479, 741
- Bono et al. (2010) Bono G. et al., 2010, ApJ, 708, L74, (B10)
- Borissova et al. (2007) Borissova J., Ivanov V. D., Stephens A. W., Catelan M., Minniti D., Prieto G., 2007, A&A, 474, 121
- Borissova & Spassova (1995) Borissova J., Spassova N., 1995, Astronomy and Astrophysics Supplement Series, 110, 1
- Braga et al. (2015) Braga V. F. et al., 2015, ApJ, 799, 165, (B15)
- Brandt & Kocsis (2015) Brandt T. D., Kocsis B., 2015, ApJ, 812, 15
- Bressan et al. (2012) Bressan A., Marigo P., Girardi L., Salasnich B., Dal Cero C., Rubele S., Nanni A., 2012, MNRAS, 427, 127
- Brown et al. (2018) Brown T. M., Casertano S., Strader J., Riess A., VandenBerg D. A., Soderblom D. R., Kalirai J., Salinas R., 2018, ApJ, 856, L6, (B18)
- Carballo-Bello et al. (2016) Carballo-Bello J. A. et al., 2016, MNRAS, 462, 501
- Carraro (2009) Carraro G., 2009, AJ, 137, 3809
- Carraro, Zinn & Moni Bidin (2007) Carraro G., Zinn R., Moni Bidin C., 2007, A&A, 466, 181
- Carretta & Bragaglia (2018) Carretta E., Bragaglia A., 2018, A&A, 614, A109
- Chen et al. (2018) Chen S., Richer H., Caiazzo I., Heyl J., 2018, ArXiv e-prints
- Cohen et al. (2014) Cohen R. E., Mauro F., Geisler D., Moni Bidin C., Dotter A., Bonatto C., 2014, AJ, 148, 18
- Contreras Ramos et al. (2018) Contreras Ramos R. et al., 2018, ApJ, 863, 78
- Côté (1999) Côté P., 1999, AJ, 118, 406
- Davies et al. (2011) Davies B., Bastian N., Gieles M., Seth A. C., Mengel S., Konstantopoulos I. S., 2011, MNRAS, 411, 1386
- Davoust, Sharina & Donzelli (2011) Davoust E., Sharina M. E., Donzelli C. J., 2011, A&A, 528, A70
- de Marchi (1999) de Marchi G., 1999, AJ, 117, 303
- Dotter (2016) Dotter A., 2016, ApJS, 222, 8
- Dotter, Sarajedini & Yang (2008) Dotter A., Sarajedini A., Yang S.-C., 2008, AJ, 136, 1407
- Elson et al. (1995) Elson R. A. W., Gilmore G. F., Santiago B. X., Casertano S., 1995, AJ, 110, 682
- Ferraro et al. (1999) Ferraro F. R., Messineo M., Fusi Pecci F., de Palo M. A., Straniero O., Chieffi A., Limongi M., 1999, AJ, 118, 1738, (F99)
- Fragione, Antonini & Gnedin (2018) Fragione G., Antonini F., Gnedin O. Y., 2018, MNRAS, 475, 5313
- Fritz et al. (2018) Fritz T. K., Battaglia G., Pawlowski M. S., Kallivayalil N., van der Marel R., Sohn T. S., Brook C., Besla G., 2018, ArXiv e-prints
- Gaia Collaboration et al. (2018a) Gaia Collaboration et al., 2018a, A&A, 616, A10
- Gaia Collaboration et al. (2018b) Gaia Collaboration et al., 2018b, A&A, 616, A1
- Gaia Collaboration et al. (2018c) Gaia Collaboration et al., 2018c, A&A, 616, A12, (H18)
- Gieles et al. (2006) Gieles M., Larsen S. S., Bastian N., Stein I. T., 2006, A&A, 450, 129
- Goldsbury, Heyl & Richer (2013) Goldsbury R., Heyl J., Richer H., 2013, ApJ, 778, 57
- Gratton et al. (2003) Gratton R. G., Bragaglia A., Carretta E., Clementini G., Desidera S., Grundahl F., Lucatello S., 2003, A&A, 408, 529, (G03)
- Gravity Collaboration et al. (2018) Gravity Collaboration et al., 2018, A&A, 615, L15
- Grillmair & Smith (2001) Grillmair C. J., Smith G. H., 2001, AJ, 122, 3231
- Halford & Zaritsky (2015) Halford M., Zaritsky D., 2015, ApJ, 815, 86
- Hamren et al. (2013) Hamren K. M., Smith G. H., Guhathakurta P., Dolphin A. E., Weisz D. R., Rajan A., Grillmair C. J., 2013, AJ, 146, 116
- Hanke et al. (2017) Hanke M., Koch A., Hansen C. J., McWilliam A., 2017, A&A, 599, A97
- Hansen et al. (2007) Hansen B. M. S. et al., 2007, ApJ, 671, 380, (H07)
- Hansen et al. (2004) Hansen B. M. S. et al., 2004, ApJS, 155, 551, (H04)
- Harris (1996) Harris W. E., 1996, AJ, 112, 1487
- Harris et al. (1997) Harris W. E., Durrell P. R., Petitpas G. R., Webb T. M., Woodworth S. C., 1997, AJ, 114, 1043
- Hendricks et al. (2012) Hendricks B., Stetson P. B., VandenBerg D. A., Dall’Ora M., 2012, AJ, 144, 25, (H12)
- Heyl et al. (2017) Heyl J., Caiazzo I., Richer H., Anderson J., Kalirai J., Parada J., 2017, ApJ, 850, 186, (H17)
- Hilker (2006) Hilker M., 2006, A&A, 448, 171
- Hunter et al. (2003) Hunter D. A., Elmegreen B. G., Dupuy T. J., Mortonson M., 2003, AJ, 126, 1836
- Irrgang et al. (2013) Irrgang A., Wilcox B., Tucker E., Schiefelbein L., 2013, A&A, 549, A137
- Jermyn, Steinhardt & Tout (2018) Jermyn A. S., Steinhardt C. L., Tout C. A., 2018, MNRAS, 480, 4265
- Johnston, Spergel & Hernquist (1995) Johnston K. V., Spergel D. N., Hernquist L., 1995, ApJ, 451, 598
- Kaisler, Harris & McLaughlin (1997) Kaisler D., Harris W. E., McLaughlin D. E., 1997, PASP, 109, 920
- Kaluzny et al. (2013) Kaluzny J. et al., 2013, AJ, 145, 43, (K13)
- Katz et al. (2018) Katz D. et al., 2018, ArXiv e-prints
- Kirby, Simon & Cohen (2015) Kirby E. N., Simon J. D., Cohen J. G., 2015, ApJ, 810, 56
- Koch, Hanke & Kacharov (2018) Koch A., Hanke M., Kacharov N., 2018, A&A, 616, A74
- Koch, Kunder & Wojno (2017) Koch A., Kunder A., Wojno J., 2017, A&A, 605, A128
- Laevens et al. (2014) Laevens B. P. M. et al., 2014, ApJ, 786, L3
- Layden & Sarajedini (2003) Layden A. C., Sarajedini A., 2003, AJ, 125, 208, (L03)
- Lee, Carney & Balachandran (2004) Lee J.-W., Carney B. W., Balachandran S. C., 2004, AJ, 128, 2388
- Lindegren et al. (2018) Lindegren L. et al., 2018, A&A, 616, A2
- Lindegren, Madsen & Dravins (2000) Lindegren L., Madsen S., Dravins D., 2000, A&A, 356, 1119
- Longmore et al. (2011) Longmore A. J. et al., 2011, MNRAS, 416, 465
- McMillan (2017) McMillan P. J., 2017, Monthly Notices of the Royal Astronomical Society, 465, 76
- Mercer et al. (2005) Mercer E. P. et al., 2005, ApJ, 635, 560
- Mignard et al. (2018) Mignard F., Klioner S., Lindegren L., Hernandez J., Bastian U., Bombrun A., 2018, ArXiv e-prints
- Milone et al. (2012) Milone A. P., Piotto G., Bedin L. R., Cassisi S., Anderson J., Marino A. F., Pietrinferni A., Aparicio A., 2012, A&A, 537, A77
- Minniti et al. (2017) Minniti D. et al., 2017, ApJ, 838, L14
- Monaco et al. (2018) Monaco L., Villanova S., Carraro G., Mucciarelli A., Moni Bidin C., 2018, ArXiv e-prints
- Muñoz et al. (2018a) Muñoz C. et al., 2018a, ArXiv e-prints
- Muñoz et al. (2018b) Muñoz R. R., Côté P., Santana F. A., Geha M., Simon J. D., Oyarzún G. A., Stetson P. B., Djorgovski S. G., 2018b, ApJ, 860, 66
- Myeong et al. (2018) Myeong G. C., Evans N. W., Belokurov V., Sanders J. L., Koposov S. E., 2018, ApJ, 863, L28
- Nardiello et al. (2018) Nardiello D. et al., 2018, MNRAS, 481, 3382
- Neeley et al. (2015) Neeley J. R. et al., 2015, ApJ, 808, 11, (N15)
- O’Malley & Chaboyer (2018) O’Malley E. M., Chaboyer B., 2018, ApJ, 856, 130
- O’Malley, Gilligan & Chaboyer (2017) O’Malley E. M., Gilligan C., Chaboyer B., 2017, ApJ, 838, 162, (O17)
- Origlia & Rich (2004) Origlia L., Rich R. M., 2004, AJ, 127, 3422
- Origlia et al. (2005) Origlia L., Valenti E., Rich R. M., Ferraro F. R., 2005, MNRAS, 363, 897
- Ortolani & Gratton (1986) Ortolani S., Gratton R. G., 1986, A&A, 160, 25
- Paust, Wilson & van Belle (2014) Paust N., Wilson D., van Belle G., 2014, AJ, 148, 19
- Paxton et al. (2015) Paxton B. et al., 2015, ApJS, 220, 15
- Peñaloza et al. (2011) Peñaloza F., Vásquez S., Kurtev R., Borissova J., Pessev P., Zoccali M., 2011, Boletin de la Asociacion Argentina de Astronomia La Plata Argentina, 54, 183
- Perryman et al. (1997) Perryman M. A. C. et al., 1997, A&A, 323, L49
- Peterson & Latham (1989) Peterson R. C., Latham D. W., 1989, ApJ, 336, 178
- Piersimoni, Bono & Ripepi (2002) Piersimoni A. M., Bono G., Ripepi V., 2002, AJ, 124, 1528, (P02)
- Posti & Helmi (2018) Posti L., Helmi A., 2018, ArXiv e-prints
- Reid & Gizis (1998) Reid I. N., Gizis J. E., 1998, AJ, 116, 2929, (R98)
- Reid & Brunthaler (2004) Reid M. J., Brunthaler A., 2004, ApJ, 616, 872
- Renzini et al. (2015) Renzini A. et al., 2015, MNRAS, 454, 4197
- Rosenberg et al. (1998) Rosenberg A., Saviane I., Piotto G., Aparicio A., Zaggia S. R., 1998, AJ, 115, 648
- Salaris et al. (2007) Salaris M., Held E. V., Ortolani S., Gullieuszik M., Momany Y., 2007, A&A, 476, 243, (S07)
- Saracino et al. (2016) Saracino S. et al., 2016, ApJ, 832, 48
- Sarajedini et al. (2007) Sarajedini A. et al., 2007, AJ, 133, 1658
- Schönrich, Binney & Dehnen (2010) Schönrich R., Binney J., Dehnen W., 2010, MNRAS, 403, 1829
- Sharina et al. (2014) Sharina M. E., Donzelli C. J., Davoust E., Shimansky V. V., Charbonnel C., 2014, A&A, 570, A48
- Shen et al. (2010) Shen J., Rich R. M., Kormendy J., Howard C. D., De Propris R., Kunder A., 2010, ApJ, 720, L72
- Simpson (2018) Simpson J. D., 2018, MNRAS, 477, 4565
- Sofue (2013) Sofue Y., 2013, PASJ, 65, 118
- Sohn et al. (2018) Sohn S. T., Watkins L. L., Fardal M. A., van der Marel R. P., Deason A. J., Besla G., Bellini A., 2018, ApJ, 862, 52
- Sollima & Baumgardt (2017) Sollima A., Baumgardt H., 2017, MNRAS, 471, 3668
- Sollima et al. (2017) Sollima A., Dalessandro E., Beccari G., Pallanca C., 2017, MNRAS, 464, 3871
- Stetson et al. (1999) Stetson P. B. et al., 1999, AJ, 117, 247
- Suntzeff, Olszewski & Stetson (1985) Suntzeff N., Olszewski E., Stetson P. B., 1985, AJ, 90, 1481
- Thompson et al. (2010) Thompson I. B., Kaluzny J., Rucinski S. M., Krzeminski W., Pych W., Dotter A., Burley G. S., 2010, AJ, 139, 329, (T10)
- Trager, King & Djorgovski (1995) Trager S. C., King I. R., Djorgovski S., 1995, AJ, 109, 218
- Valenti, Ferraro & Origlia (2007) Valenti E., Ferraro F. R., Origlia L., 2007, AJ, 133, 1287
- Valenti, Ferraro & Origlia (2010) Valenti E., Ferraro F. R., Origlia L., 2010, MNRAS, 402, 1729
- van de Ven et al. (2006) van de Ven G., van den Bosch R. C. E., Verolme E. K., de Zeeuw P. T., 2006, A&A, 445, 513
- Vasiliev (2018) Vasiliev E., 2018, ArXiv e-prints
- Vásquez et al. (2018) Vásquez S. et al., 2018, ArXiv e-prints
- Voggel et al. (2016) Voggel K., Hilker M., Baumgardt H., Collins M. L. M., Grebel E. K., Husemann B., Richtler T., Frank M. J., 2016, MNRAS, 460, 3384
- Watkins et al. (2015a) Watkins L. L., van der Marel R. P., Bellini A., Anderson J., 2015a, ApJ, 803, 29
- Watkins et al. (2015b) Watkins L. L., van der Marel R. P., Bellini A., Anderson J., 2015b, ApJ, 812, 149, (W15)
- Wegg & Gerhard (2013) Wegg C., Gerhard O., 2013, MNRAS, 435, 1874
- Weisz et al. (2016) Weisz D. R. et al., 2016, ApJ, 822, 32
- Wolf et al. (2018) Wolf C., Bian F., Onken C. A., Schmidt B. P., Tisserand P., Alonzi N., Hon W. J., Tonry J. L., 2018, PASA, 35, e024
- Woodley et al. (2012) Woodley K. A. et al., 2012, AJ, 143, 50, (W12)
- Zánmar Sánchez (2009) Zánmar Sánchez R., 2009, PhD thesis, The State University of New Jersey, Rutgers
- Zoccali et al. (2001) Zoccali M. et al., 2001, ApJ, 553, 733, (Z01)
| Name | RA | X | Y | Z | U | V | W | |||||||
|---|---|---|---|---|---|---|---|---|---|---|---|---|---|---|
| DEC | ||||||||||||||
| [deg] | [kpc] | [km/s] | [mas/yr] | [mas/yr] | [kpc] | [kpc] | [kpc] | [km/s] | [km/s] | [km/s] | [kpc] | kpc] | ||
| NGC 104 | 6.023625 | 4.43 | -17.21 | 5.25 | -2.53 | 0.04 | 6.26 | -2.54 | -3.13 | 75.93 | 172.96 | 44.89 | 5.46 | 7.44 |
| -72.081276 | 0.04 | 0.18 | 0.01 | 0.01 | 0.02 | 0.02 | 0.03 | 0.26 | 0.24 | 0.23 | 0.01 | 0.01 | ||
| NGC 288 | 13.188500 | 9.98 | -44.83 | 4.22 | -5.65 | 0.31 | 8.19 | 0.05 | -9.98 | 9.89 | -80.69 | 50.55 | 3.33 | 13.01 |
| -26.582611 | 0.33 | 0.13 | 0.01 | 0.01 | 0.00 | 0.00 | 0.33 | 0.44 | 0.42 | 0.13 | 0.49 | 0.25 | ||
| NGC 362 | 15.809416 | 9.17 | 223.26 | 6.71 | -2.51 | -0.09 | 4.78 | -5.41 | -6.62 | 101.67 | -106.60 | -65.48 | 1.05 | 12.48 |
| -70.848778 | 0.26 | 0.28 | 0.01 | 0.01 | 0.09 | 0.15 | 0.19 | 0.54 | 0.49 | 0.44 | 0.21 | 0.41 | ||
| Whiting 1 | 30.737499 | 31.30 | -130.41 | -0.04 | -1.78 | -0.09 | 22.67 | 4.84 | -27.28 | -210.54 | 36.01 | 12.03 | 17.64 | 53.27 |
| -3.252777 | 1.79 | 0.12 | 0.08 | 1.46 | 0.48 | 2.73 | 14.18 | 14.64 | 7.15 | 4.08 | 7.98 | |||
| NGC 1261 | 48.067543 | 15.49 | 71.36 | 1.61 | -2.05 | 0.19 | 8.01 | -9.51 | -12.23 | -73.65 | 66.05 | 62.12 | 1.41 | 19.93 |
| -55.216224 | 0.24 | 0.02 | 0.02 | 0.01 | 0.95 | 1.22 | 1.49 | 1.20 | 0.94 | 0.36 | 1.66 | |||
| Pal 1 | 53.333499 | 11.00 | -75.41 | -0.17 | 0.03 | 0.02 | 14.79 | 7.96 | 3.59 | -62.27 | 203.84 | -21.13 | 14.23 | 18.74 |
| 79.581054 | 0.21 | 0.05 | 0.06 | 0.67 | 0.80 | 0.36 | 2.32 | 1.76 | 2.79 | 0.91 | 1.52 | |||
| AM 1 | 58.759586 | 123.30 | 118.00 | 0.02 | -0.25 | -0.13 | 24.59 | -80.07 | -92.30 | -121.61 | 112.49 | -48.89 | 98.84 | 308.34 |
| -49.615276 | 14.14 | 0.20 | 0.28 | 1.65 | 8.01 | 9.23 | 157.46 | 100.82 | 81.78 | 39.38 | 175.38 | |||
| Eridanus | 66.185417 | 90.10 | -23.79 | 0.40 | -0.12 | -0.35 | 61.34 | -41.75 | -59.50 | -12.44 | 124.48 | 131.71 | 33.56 | 134.93 |
| -21.186943 | 1.07 | 0.11 | 0.12 | 5.32 | 4.18 | 5.95 | 40.41 | 42.65 | 34.45 | 23.03 | 18.19 | |||
| Pal 2 | 71.524620 | 27.20 | -135.97 | 1.38 | -1.62 | 0.08 | 34.59 | 4.42 | -4.29 | -97.83 | -40.35 | 32.31 | 2.49 | 39.41 |
| 31.381500 | 1.55 | 0.10 | 0.06 | 2.65 | 0.44 | 0.43 | 3.15 | 9.37 | 10.46 | 1.80 | 3.18 | |||
| NGC 1851 | 78.528160 | 11.33 | 320.30 | 2.12 | -0.63 | -0.18 | 12.09 | -8.37 | -6.50 | 84.14 | -61.66 | -88.09 | 0.83 | 19.13 |
| -40.046555 | 0.19 | 0.25 | 0.01 | 0.01 | 0.07 | 0.14 | 0.11 | 0.64 | 0.49 | 0.56 | 0.05 | 0.22 | ||
| NGC 1904 | 81.044168 | 13.27 | 205.84 | 2.47 | -1.59 | 0.01 | 15.95 | -8.49 | -6.50 | 43.18 | -19.01 | 6.93 | 0.82 | 19.49 |
| -24.524481 | 0.19 | 0.01 | 0.02 | 0.79 | 0.85 | 0.65 | 0.77 | 0.73 | 0.80 | 0.33 | 1.13 | |||
| NGC 2298 | 102.247543 | 10.80 | 147.15 | 3.28 | -2.20 | 0.08 | 12.38 | -9.46 | -2.98 | -92.51 | 25.88 | 75.25 | 1.86 | 17.74 |
| -36.005306 | 0.57 | 0.02 | 0.02 | 0.43 | 0.95 | 0.30 | 0.94 | 0.69 | 0.98 | 0.78 | 1.22 | |||
| NGC 2419 | 114.535286 | 83.18 | -20.67 | -0.02 | -0.57 | 0.11 | 83.34 | -0.48 | 35.47 | -1.45 | 37.31 | -64.63 | 16.52 | 90.96 |
| 38.882442 | 0.34 | 0.02 | 0.01 | 7.52 | 0.05 | 3.55 | 3.78 | 6.11 | 7.97 | 2.68 | 7.66 | |||
| Pyxis | 136.990833 | 39.40 | 40.46 | 1.13 | 0.13 | 0.13 | 14.00 | -38.66 | 4.80 | -129.85 | 214.88 | 184.46 | 26.26 | 131.22 |
| -37.221388 | 0.21 | 0.04 | 0.05 | 0.59 | 3.87 | 0.48 | 7.55 | 1.65 | 7.45 | 8.98 | 30.07 | |||
| NGC 2808 | 138.012909 | 10.21 | 103.90 | 1.02 | 0.28 | -0.11 | 5.99 | -9.79 | -1.99 | -57.14 | 148.84 | 31.64 | 0.97 | 14.72 |
| -64.863495 | 0.12 | 0.30 | 0.01 | 0.01 | 0.02 | 0.12 | 0.02 | 0.38 | 0.31 | 0.38 | 0.02 | 0.12 | ||
| E 3 | 140.237793 | 8.09 | 4.93 | -2.69 | 7.08 | -0.16 | 5.20 | -7.08 | -2.64 | 225.67 | 113.99 | 102.99 | 9.11 | 13.24 |
| -77.281890 | 0.42 | 0.02 | 0.02 | 0.29 | 0.71 | 0.26 | 0.85 | 0.57 | 0.86 | 0.44 | 2.76 | |||
| Pal 3 | 151.382916 | 92.50 | 94.04 | 0.08 | -0.12 | -0.51 | 42.40 | -59.74 | 61.73 | -30.72 | 156.24 | 66.15 | 65.31 | 124.42 |
| 0.071666 | 0.80 | 0.13 | 0.14 | 3.43 | 5.97 | 6.17 | 53.32 | 48.03 | 43.40 | 23.15 | 45.47 | |||
| NGC 3201 | 154.403427 | 4.51 | 494.34 | 8.35 | -2.00 | 0.26 | 7.54 | -4.42 | 0.68 | -241.78 | -201.37 | 145.33 | 8.15 | 23.54 |
| -46.412476 | 0.16 | 0.14 | 0.01 | 0.01 | 0.02 | 0.16 | 0.02 | 0.14 | 0.14 | 0.14 | 0.09 | 1.21 | ||
| Pal 4 | 172.320000 | 103.00 | 72.40 | -0.21 | -0.39 | -0.64 | 37.86 | -12.21 | 97.85 | 25.34 | 29.56 | 44.59 | 23.66 | 111.35 |
| 28.973583 | 0.24 | 0.07 | 0.14 | 2.98 | 1.22 | 9.78 | 41.95 | 65.76 | 11.27 | 22.78 | 18.95 | |||
| Crater | 174.067500 | 145.00 | 148.30 | -0.00 | -0.13 | -0.19 | -0.06 | -96.97 | 107.50 | -61.43 | 93.89 | 60.63 | 110.92 | 293.54 |
| -10.877444 | 0.93 | 0.28 | 0.18 | 0.82 | 9.70 | 10.75 | 180.92 | 107.78 | 91.95 | 47.45 | 172.75 | |||
| NGC 4147 | 182.526260 | 18.20 | 179.52 | -1.71 | -2.10 | -0.26 | 9.29 | -3.86 | 17.75 | 40.98 | -10.08 | 130.87 | 1.92 | 24.57 |
| 18.542638 | 0.33 | 0.02 | 0.01 | 0.12 | 0.39 | 1.77 | 1.46 | 1.23 | 0.44 | 0.77 | 2.52 | |||
| NGC 4372 | 186.439178 | 5.76 | 75.59 | -6.38 | 3.33 | 0.08 | 5.18 | -4.86 | -0.99 | 100.56 | 83.69 | 66.17 | 2.94 | 7.20 |
| -72.659004 | 0.28 | 0.30 | 0.01 | 0.01 | 0.14 | 0.24 | 0.05 | 0.22 | 0.27 | 0.18 | 0.14 | 0.08 | ||
| Rup 106 | 189.667500 | 21.20 | -38.42 | -1.25 | 0.39 | 0.67 | -2.56 | -17.82 | 4.29 | 121.34 | 224.63 | 31.76 | 4.71 | 35.18 |
| -51.150277 | 0.30 | 0.01 | 0.01 | 1.07 | 1.78 | 0.43 | 0.89 | 0.60 | 0.69 | 0.67 | 4.03 | |||
| NGC 4590 | 189.866577 | 10.13 | -92.99 | -2.75 | 1.78 | -0.45 | 4.05 | -7.12 | 5.96 | 167.72 | 289.63 | 15.33 | 8.86 | 29.20 |
| -26.744057 | 0.81 | 0.22 | 0.01 | 0.01 | 0.32 | 0.57 | 0.48 | 0.39 | 0.33 | 0.34 | 0.42 | 2.85 | ||
| NGC 4833 | 194.891342 | 6.24 | 201.99 | -8.36 | -0.97 | 0.18 | 4.68 | -5.15 | -0.87 | 86.33 | -49.16 | -41.57 | 0.79 | 7.39 |
| -70.876503 | 0.36 | 0.40 | 0.01 | 0.01 | 0.20 | 0.30 | 0.05 | 0.32 | 0.37 | 0.28 | 0.12 | 0.30 | ||
| NGC 5024 | 198.230209 | 17.90 | -62.85 | -0.11 | -1.35 | -0.45 | 5.27 | -1.45 | 17.62 | -58.06 | 158.52 | -71.86 | 9.09 | 21.96 |
| 18.168165 | 0.26 | 0.01 | 0.01 | 0.28 | 0.14 | 1.76 | 0.81 | 0.78 | 0.29 | 0.16 | 1.83 | |||
| NGC 5053 | 199.112875 | 17.20 | 42.77 | -0.37 | -1.26 | -0.35 | 5.09 | -1.36 | 16.88 | -52.38 | 148.20 | 35.11 | 10.28 | 17.69 |
| 17.700250 | 0.25 | 0.01 | 0.01 | 0.30 | 0.14 | 1.69 | 0.97 | 0.89 | 0.30 | 0.09 | 1.35 |
| Name | RA | X | Y | Z | U | V | W | |||||||
|---|---|---|---|---|---|---|---|---|---|---|---|---|---|---|
| DEC | ||||||||||||||
| [deg] | [kpc] | [km/s] | [mas/yr] | [mas/yr] | [kpc] | [kpc] | [kpc] | [km/s] | [km/s] | [km/s] | [kpc] | kpc] | ||
| NGC 5139 | 201.696838 | 5.24 | 234.28 | -3.24 | -6.73 | -0.47 | 4.91 | -3.93 | 1.35 | -98.73 | -19.45 | -81.02 | 1.35 | 7.00 |
| -47.479584 | 0.07 | 0.24 | 0.01 | 0.01 | 0.04 | 0.05 | 0.02 | 0.32 | 0.30 | 0.36 | 0.04 | 0.04 | ||
| NGC 5272 | 205.548416 | 9.59 | -147.28 | -0.14 | -2.64 | -0.05 | 6.71 | 1.26 | 9.40 | -60.46 | 135.49 | -134.57 | 5.44 | 15.14 |
| 28.377277 | 0.41 | 0.34 | 0.01 | 0.01 | 0.06 | 0.05 | 0.40 | 0.44 | 0.43 | 0.34 | 0.09 | 0.40 | ||
| NGC 5286 | 206.611710 | 11.45 | 62.38 | 0.20 | -0.16 | -0.05 | 0.62 | -8.42 | 2.10 | -59.76 | 210.83 | 8.22 | 1.16 | 13.27 |
| -51.374249 | 0.73 | 0.40 | 0.02 | 0.02 | 0.48 | 0.54 | 0.13 | 0.73 | 0.67 | 0.87 | 0.24 | 0.86 | ||
| AM 4 | 209.090423 | 32.20 | 151.19 | -1.07 | -3.93 | -0.29 | -12.55 | -17.16 | 17.78 | -116.92 | -270.55 | -346.38 | 28.07 | 373.30 |
| -27.167499 | 2.85 | 0.86 | 0.92 | 2.07 | 1.72 | 1.78 | 101.95 | 115.37 | 117.30 | 2.24 | 185.36 | |||
| NGC 5466 | 211.363708 | 16.90 | 106.93 | -5.41 | -0.79 | 0.12 | 4.56 | 3.20 | 16.21 | 235.28 | -50.46 | 232.32 | 7.95 | 65.53 |
| 28.534445 | 0.18 | 0.01 | 0.01 | 0.35 | 0.32 | 1.62 | 0.58 | 0.58 | 0.24 | 2.63 | 26.88 | |||
| NGC 5634 | 217.405125 | 27.20 | -16.07 | -1.67 | -1.55 | -0.06 | -8.80 | -5.42 | 20.61 | 56.55 | -31.25 | -33.08 | 4.27 | 23.91 |
| -5.976416 | 0.60 | 0.02 | 0.02 | 1.69 | 0.54 | 2.06 | 2.28 | 2.76 | 1.86 | 2.30 | 2.92 | |||
| NGC 5694 | 219.901199 | 37.33 | -139.55 | -0.43 | -1.09 | -0.43 | -20.09 | -15.59 | 18.87 | 110.39 | 139.63 | -180.40 | 3.98 | 66.04 |
| -26.538944 | 0.49 | 0.03 | 0.03 | 2.82 | 1.56 | 1.89 | 3.11 | 4.20 | 3.94 | 0.95 | 7.79 | |||
| IC 4499 | 225.076875 | 18.20 | 38.41 | 0.47 | -0.49 | 0.12 | -2.25 | -13.55 | -6.37 | -31.56 | 247.58 | -59.38 | 6.38 | 27.67 |
| -82.213694 | 0.31 | 0.01 | 0.01 | 1.03 | 1.36 | 0.64 | 0.81 | 0.67 | 0.91 | 1.24 | 3.44 | |||
| NGC 5824 | 225.994293 | 31.80 | -25.24 | -1.19 | -2.23 | 0.04 | -18.05 | -13.58 | 11.95 | 97.57 | -62.84 | -180.23 | 15.17 | 38.26 |
| -33.068222 | 0.52 | 0.02 | 0.02 | 2.62 | 1.36 | 1.19 | 1.99 | 2.89 | 2.77 | 5.45 | 9.87 | |||
| Pal 5 | 229.021875 | 23.20 | -58.60 | -2.77 | -2.67 | -0.37 | -8.06 | 0.24 | 16.65 | 50.24 | -170.32 | -8.79 | 17.40 | 24.39 |
| -0.111611 | 0.21 | 0.03 | 0.03 | 1.62 | 0.02 | 1.66 | 2.22 | 3.15 | 2.15 | 6.04 | 5.57 | |||
| NGC 5897 | 229.352083 | 12.60 | 101.31 | -5.41 | -3.46 | -0.20 | -2.30 | -3.19 | 6.36 | 34.13 | -133.63 | 88.40 | 2.86 | 9.31 |
| -21.010277 | 1.08 | 0.22 | 0.01 | 0.01 | 0.89 | 0.27 | 0.54 | 0.48 | 0.73 | 0.66 | 1.05 | 1.38 | ||
| NGC 5904 | 229.638412 | 7.57 | 53.70 | 4.06 | -9.89 | -0.13 | 2.93 | 0.35 | 5.52 | -304.75 | 86.82 | -183.79 | 2.90 | 24.20 |
| 2.081028 | 0.13 | 0.25 | 0.01 | 0.01 | 0.09 | 0.01 | 0.09 | 0.34 | 0.40 | 0.33 | 0.05 | 1.06 | ||
| NGC 5927 | 232.002869 | 8.16 | -104.07 | -5.08 | -3.22 | -0.26 | 1.31 | -4.48 | 0.69 | 204.06 | 115.51 | 6.43 | 3.99 | 5.42 |
| -50.673031 | 0.27 | 0.28 | 0.02 | 0.02 | 0.22 | 0.15 | 0.02 | 0.43 | 0.56 | 0.64 | 0.02 | 0.17 | ||
| NGC 5946 | 233.868835 | 10.60 | 137.41 | -5.28 | -1.55 | -0.29 | -0.82 | -5.67 | 0.77 | 18.61 | -37.63 | 109.12 | 0.83 | 5.82 |
| -50.659668 | 1.42 | 0.05 | 0.04 | 0.89 | 0.57 | 0.08 | 1.74 | 2.12 | 2.30 | 0.43 | 0.81 | |||
| NGC 5986 | 236.512496 | 10.56 | 101.18 | -4.17 | -4.61 | -0.31 | -1.36 | -4.01 | 2.42 | 8.31 | -73.46 | -15.31 | 0.67 | 5.05 |
| -37.786415 | 0.64 | 0.43 | 0.02 | 0.02 | 0.57 | 0.24 | 0.15 | 0.53 | 0.74 | 0.77 | 0.31 | 0.46 | ||
| FSR 1716 | 242.625000 | 7.50 | -33.14 | -4.49 | -8.62 | -0.24 | 1.62 | -3.77 | -0.21 | 184.11 | -10.62 | -108.27 | 2.55 | 4.92 |
| -53.748888 | 1.01 | 0.04 | 0.04 | 0.65 | 0.38 | 0.02 | 1.12 | 1.35 | 1.41 | 0.42 | 0.46 | |||
| Pal 14 | 242.752500 | 71.00 | 72.30 | -0.49 | -0.46 | 0.43 | -38.02 | 25.30 | 47.68 | -103.40 | 67.17 | 123.82 | 3.90 | 94.81 |
| 14.957777 | 0.14 | 0.06 | 0.05 | 4.61 | 2.53 | 4.77 | 12.84 | 16.38 | 13.47 | 1.90 | 8.94 | |||
| Lynga 7 | 242.765213 | 8.00 | 17.86 | -3.80 | -7.06 | -0.27 | 1.27 | -4.14 | -0.39 | 127.01 | -0.77 | -90.98 | 1.91 | 4.56 |
| -55.317775 | 0.83 | 0.02 | 0.02 | 0.68 | 0.41 | 0.04 | 0.78 | 0.67 | 0.61 | 0.39 | 0.34 | |||
| NGC 6093 | 244.260040 | 8.86 | 10.93 | -2.93 | -5.59 | -0.12 | -0.19 | -1.07 | 2.95 | -10.99 | -6.16 | -52.89 | 0.35 | 3.52 |
| -22.976084 | 0.55 | 0.39 | 0.03 | 0.03 | 0.51 | 0.07 | 0.18 | 0.55 | 1.14 | 1.09 | 0.10 | 0.26 | ||
| NGC 6121 | 245.896744 | 1.97 | 71.05 | -12.48 | -18.99 | -0.02 | 6.23 | -0.30 | 0.54 | -54.67 | 33.06 | -5.03 | 0.55 | 6.16 |
| -26.525749 | 0.04 | 0.08 | 0.01 | 0.01 | 0.04 | 0.01 | 0.01 | 0.08 | 0.10 | 0.10 | 0.08 | 0.09 | ||
| NGC 6101 | 246.450485 | 16.07 | 366.33 | 1.76 | -0.22 | 0.06 | -3.34 | -10.40 | -4.38 | -301.37 | 92.50 | -199.14 | 11.37 | 46.89 |
| -72.202194 | 0.32 | 0.01 | 0.01 | 1.14 | 1.04 | 0.44 | 0.38 | 0.38 | 0.42 | 1.07 | 10.23 | |||
| NGC 6144 | 246.807769 | 8.90 | 195.74 | -1.75 | -2.62 | -0.03 | -0.38 | -1.20 | 2.41 | -184.05 | 94.62 | 42.67 | 2.27 | 3.36 |
| -26.023500 | 0.74 | 0.02 | 0.02 | 0.85 | 0.12 | 0.24 | 0.75 | 0.83 | 0.84 | 0.31 | 0.51 | |||
| NGC 6139 | 246.918212 | 9.80 | 24.41 | -6.16 | -2.67 | 0.06 | -1.17 | -2.95 | 1.18 | 66.80 | -24.01 | 131.70 | 1.34 | 3.52 |
| -38.848747 | 0.83 | 0.95 | 0.03 | 0.02 | 0.79 | 0.25 | 0.10 | 0.99 | 1.17 | 1.19 | 0.45 | 0.57 | ||
| Ter 3 | 247.167000 | 8.10 | -135.76 | -5.58 | -1.69 | 0.12 | 0.37 | -2.06 | 1.29 | 185.55 | 104.61 | 96.75 | 2.26 | 3.25 |
| -35.353472 | 0.57 | 0.04 | 0.03 | 0.77 | 0.21 | 0.13 | 0.69 | 1.28 | 1.33 | 0.11 | 0.44 | |||
| NGC 6171 | 248.132751 | 6.03 | -34.68 | -1.93 | -5.98 | -0.03 | 2.56 | 0.33 | 2.36 | -12.58 | 82.63 | -61.45 | 1.02 | 3.65 |
| -13.053778 | 0.31 | 0.19 | 0.01 | 0.01 | 0.28 | 0.02 | 0.12 | 0.21 | 0.30 | 0.29 | 0.15 | 0.09 | ||
| ESO 452-SC11 | 249.854166 | 6.50 | 16.27 | -1.54 | -6.41 | -0.12 | 1.81 | -0.89 | 1.36 | -20.24 | 67.50 | -78.66 | 0.48 | 2.75 |
| -28.399166 | 0.48 | 0.04 | 0.03 | 0.63 | 0.09 | 0.14 | 0.54 | 1.00 | 1.01 | 0.18 | 0.33 | |||
| NGC 6205 | 250.421814 | 6.77 | -244.49 | -3.18 | -2.56 | 0.30 | 5.47 | 4.39 | 4.43 | 35.63 | -5.72 | -83.13 | 1.55 | 8.32 |
| 36.459862 | 0.28 | 0.43 | 0.01 | 0.01 | 0.11 | 0.18 | 0.18 | 0.36 | 0.38 | 0.38 | 0.04 | 0.15 | ||
| NGC 6229 | 251.744958 | 30.62 | -138.64 | -1.19 | -0.46 | 0.16 | 1.52 | 22.41 | 19.81 | -6.90 | 25.53 | 50.77 | 1.94 | 30.94 |
| 47.527750 | 0.77 | 0.05 | 0.06 | 0.66 | 2.24 | 1.98 | 8.02 | 5.42 | 6.01 | 1.49 | 3.12 | |||
| NGC 6218 | 251.809067 | 4.67 | -41.35 | -0.15 | -6.77 | 0.48 | 4.07 | 1.13 | 2.07 | -42.81 | 126.96 | -79.14 | 2.35 | 4.79 |
| -1.948528 | 0.21 | 0.20 | 0.01 | 0.01 | 0.18 | 0.05 | 0.09 | 0.21 | 0.23 | 0.23 | 0.10 | 0.08 |
| Name | RA | X | Y | Z | U | V | W | |||||||
|---|---|---|---|---|---|---|---|---|---|---|---|---|---|---|
| DEC | ||||||||||||||
| [deg] | [kpc] | [km/s] | [mas/yr] | [mas/yr] | [kpc] | [kpc] | [kpc] | [km/s] | [km/s] | [km/s] | [kpc] | kpc] | ||
| FSR 1735 | 253.044174 | 9.80 | -69.85 | -4.40 | -0.49 | -0.16 | -1.06 | -3.48 | -0.32 | 102.19 | 137.64 | 152.65 | 0.87 | 5.39 |
| -47.058055 | 4.88 | 0.18 | 0.15 | 0.92 | 0.35 | 0.03 | 5.33 | 7.44 | 7.98 | 0.27 | 0.83 | |||
| NGC 6235 | 253.355458 | 13.52 | 126.68 | -3.96 | -7.61 | 0.28 | -5.04 | -0.25 | 3.16 | -145.64 | -292.77 | -53.16 | 5.43 | 21.81 |
| -22.177444 | 0.33 | 0.04 | 0.04 | 1.31 | 0.02 | 0.32 | 0.74 | 2.81 | 2.75 | 1.53 | 19.42 | |||
| NGC 6254 | 254.287720 | 4.96 | 74.02 | -4.72 | -6.54 | 0.28 | 3.70 | 1.19 | 1.94 | -121.31 | 86.05 | 48.26 | 1.97 | 4.58 |
| -4.100306 | 0.13 | 0.31 | 0.01 | 0.01 | 0.12 | 0.03 | 0.05 | 0.31 | 0.29 | 0.30 | 0.04 | 0.09 | ||
| NGC 6256 | 254.885916 | 6.40 | -101.37 | -3.61 | -1.52 | 0.04 | 1.86 | -1.35 | 0.37 | 113.00 | 172.98 | 59.02 | 2.13 | 2.54 |
| -37.121388 | 1.19 | 0.08 | 0.08 | 0.62 | 0.14 | 0.04 | 1.28 | 2.39 | 2.48 | 0.47 | 0.44 | |||
| Pal 15 | 254.962500 | 45.10 | 72.27 | -0.64 | -0.81 | 0.10 | -30.79 | 13.28 | 18.59 | -131.74 | 63.47 | 65.02 | 1.68 | 51.54 |
| -0.538888 | 1.74 | 0.06 | 0.04 | 3.89 | 1.33 | 1.86 | 5.03 | 9.93 | 10.31 | 0.92 | 5.64 | |||
| NGC 6266 | 255.303329 | 6.41 | -73.49 | -4.99 | -2.95 | 0.22 | 1.79 | -0.71 | 0.82 | 87.97 | 99.40 | 63.72 | 0.83 | 2.36 |
| -30.113722 | 0.12 | 0.70 | 0.02 | 0.02 | 0.12 | 0.01 | 0.02 | 0.69 | 0.55 | 0.55 | 0.08 | 0.09 | ||
| NGC 6273 | 255.657486 | 8.27 | 145.54 | -3.23 | 1.66 | 0.22 | -0.05 | -0.45 | 1.35 | -130.35 | 222.32 | 169.51 | 1.22 | 3.33 |
| -26.267971 | 0.41 | 0.59 | 0.01 | 0.01 | 0.40 | 0.02 | 0.07 | 0.59 | 0.52 | 0.53 | 0.11 | 0.25 | ||
| NGC 6284 | 256.118791 | 15.14 | 28.26 | -3.21 | -2.00 | 0.24 | -6.81 | -0.43 | 2.61 | -14.23 | -0.02 | 111.59 | 1.28 | 7.35 |
| -24.764861 | 1.35 | 0.93 | 0.02 | 0.01 | 1.33 | 0.04 | 0.23 | 0.94 | 1.14 | 1.19 | 0.39 | 1.17 | ||
| NGC 6287 | 256.288051 | 9.40 | -294.74 | -4.99 | -1.89 | -0.00 | -1.13 | 0.02 | 1.80 | 302.80 | 53.13 | 79.51 | 1.25 | 5.86 |
| -22.708361 | 1.65 | 0.02 | 0.01 | 0.92 | 0.00 | 0.18 | 1.62 | 0.69 | 0.79 | 0.26 | 1.58 | |||
| NGC 6293 | 257.542500 | 9.23 | -143.66 | 0.87 | -4.31 | 0.18 | -1.04 | -0.38 | 1.26 | 117.33 | 126.41 | -152.06 | 0.50 | 3.02 |
| -26.582083 | 0.70 | 0.39 | 0.02 | 0.02 | 0.69 | 0.03 | 0.10 | 0.40 | 0.82 | 0.83 | 0.18 | 0.90 | ||
| NGC 6304 | 258.634399 | 5.77 | -108.62 | -4.04 | -1.03 | 0.22 | 2.37 | -0.42 | 0.54 | 109.97 | 173.91 | 70.45 | 1.77 | 3.01 |
| -29.462028 | 0.39 | 0.39 | 0.02 | 0.02 | 0.39 | 0.03 | 0.04 | 0.39 | 0.54 | 0.55 | 0.23 | 0.42 | ||
| NGC 6316 | 259.155416 | 11.60 | 99.81 | -4.97 | -4.61 | 0.13 | -3.43 | -0.57 | 1.17 | -84.44 | -116.11 | 95.53 | 1.45 | 4.79 |
| -28.140111 | 0.82 | 0.04 | 0.04 | 1.15 | 0.06 | 0.12 | 0.85 | 2.06 | 2.11 | 0.87 | 1.55 | |||
| NGC 6341 | 259.280762 | 8.44 | -120.48 | -4.93 | -0.57 | 0.18 | 5.54 | 6.44 | 4.82 | 25.28 | 41.15 | 97.39 | 1.00 | 10.53 |
| 43.135944 | 0.31 | 0.27 | 0.02 | 0.02 | 0.09 | 0.24 | 0.18 | 0.61 | 0.46 | 0.54 | 0.09 | 0.23 | ||
| NGC 6325 | 259.496708 | 7.80 | 29.54 | -8.46 | -9.02 | 0.16 | 0.38 | 0.13 | 1.09 | -38.34 | -199.30 | 80.22 | 1.04 | 1.65 |
| -23.766000 | 0.58 | 0.04 | 0.04 | 0.77 | 0.01 | 0.11 | 0.61 | 1.34 | 1.38 | 0.13 | 0.66 | |||
| NGC 6333 | 259.796936 | 8.40 | 310.75 | -2.21 | -3.21 | 0.28 | -0.12 | 0.80 | 1.56 | -329.47 | 127.37 | 67.73 | 1.16 | 6.65 |
| -18.515943 | 2.12 | 0.01 | 0.01 | 0.82 | 0.08 | 0.16 | 2.08 | 0.52 | 0.62 | 0.15 | 0.76 | |||
| NGC 6342 | 260.292000 | 8.43 | 116.56 | -2.94 | -7.08 | 0.10 | -0.18 | 0.71 | 1.42 | -161.04 | -36.84 | -30.35 | 1.12 | 1.88 |
| -19.587416 | 0.74 | 0.02 | 0.02 | 0.83 | 0.07 | 0.14 | 0.74 | 0.76 | 0.79 | 0.34 | 0.37 | |||
| NGC 6356 | 260.895541 | 15.10 | 38.93 | -3.78 | -3.34 | 0.27 | -6.66 | 1.74 | 2.68 | -72.86 | -91.13 | 109.47 | 3.17 | 8.35 |
| -17.813027 | 1.88 | 0.04 | 0.03 | 1.48 | 0.17 | 0.27 | 1.90 | 2.26 | 2.39 | 1.58 | 1.71 | |||
| NGC 6355 | 260.994125 | 8.70 | -194.13 | -4.61 | -0.50 | 0.30 | -0.56 | -0.06 | 0.82 | 196.88 | 130.28 | 134.49 | 0.87 | 2.14 |
| -26.353417 | 0.83 | 0.03 | 0.02 | 0.87 | 0.01 | 0.08 | 0.83 | 0.99 | 1.05 | 0.24 | 0.88 | |||
| NGC 6352 | 261.371276 | 5.89 | -125.63 | -2.15 | -4.38 | 0.10 | 2.56 | -1.86 | -0.73 | 152.16 | 164.48 | 5.85 | 2.98 | 3.59 |
| -48.422168 | 1.01 | 0.01 | 0.01 | 0.55 | 0.19 | 0.07 | 0.96 | 0.47 | 0.38 | 0.25 | 0.54 | |||
| IC 1257 | 261.785430 | 25.00 | -137.97 | -0.92 | -1.39 | 0.12 | -15.03 | 6.86 | 6.53 | 62.95 | 24.55 | -19.26 | 2.01 | 18.05 |
| -7.093055 | 2.04 | 0.08 | 0.07 | 2.31 | 0.69 | 0.65 | 3.52 | 7.98 | 8.63 | 0.72 | 2.64 | |||
| Ter 2 | 261.887916 | 7.50 | 128.96 | -2.20 | -6.21 | 0.24 | 0.62 | -0.48 | 0.30 | -127.41 | 17.12 | -45.01 | 0.18 | 1.12 |
| -30.802333 | 1.18 | 0.10 | 0.09 | 0.75 | 0.05 | 0.03 | 1.20 | 3.28 | 3.46 | 0.06 | 0.46 | |||
| NGC 6366 | 261.934356 | 3.66 | -120.65 | -0.39 | -5.14 | 0.21 | 4.76 | 1.11 | 1.01 | 63.32 | 142.62 | -63.41 | 2.04 | 5.43 |
| -5.079861 | 0.20 | 0.19 | 0.01 | 0.01 | 0.18 | 0.06 | 0.06 | 0.19 | 0.23 | 0.23 | 0.11 | 0.17 | ||
| Ter 4 | 262.662506 | 6.70 | -39.93 | -5.36 | -3.35 | 0.07 | 1.42 | -0.46 | 0.15 | 43.27 | 73.20 | 90.00 | 0.41 | 1.45 |
| -31.595527 | 3.76 | 0.07 | 0.06 | 0.67 | 0.05 | 0.02 | 3.76 | 2.05 | 2.17 | 0.22 | 0.54 | |||
| HP 1 | 262.771666 | 6.80 | 40.61 | 2.54 | -10.15 | 0.17 | 1.31 | -0.31 | 0.25 | -50.50 | 21.46 | -238.79 | 0.53 | 1.95 |
| -29.981666 | 1.29 | 0.06 | 0.06 | 0.68 | 0.03 | 0.03 | 1.29 | 1.85 | 1.93 | 0.23 | 0.61 | |||
| NGC 6362 | 262.979095 | 7.36 | -14.58 | -5.49 | -4.76 | -0.04 | 2.31 | -3.97 | -2.22 | 112.74 | 49.02 | 96.02 | 2.52 | 5.14 |
| -67.048332 | 0.29 | 0.18 | 0.01 | 0.01 | 0.23 | 0.16 | 0.09 | 0.28 | 0.34 | 0.37 | 0.09 | 0.06 | ||
| Lil 1 | 263.352333 | 8.10 | 60.18 | -5.03 | -7.56 | 0.54 | 0.03 | -0.73 | -0.02 | -39.69 | -100.46 | 10.92 | 0.14 | 1.07 |
| -33.389555 | 2.46 | 0.40 | 0.29 | 0.81 | 0.07 | 0.00 | 2.71 | 12.48 | 14.21 | 0.11 | 0.31 | |||
| NGC 6380 | 263.616700 | 9.80 | -6.54 | -2.04 | -3.17 | -0.11 | -1.54 | -1.67 | -0.58 | 25.20 | 80.72 | 7.87 | 0.33 | 2.38 |
| -39.069200 | 1.48 | 0.06 | 0.05 | 0.96 | 0.17 | 0.06 | 1.50 | 2.32 | 2.50 | 0.10 | 0.74 | |||
| Ter 1 | 263.946300 | 6.70 | 57.55 | -2.94 | -4.62 | 0.22 | 1.41 | -0.29 | 0.12 | -61.19 | 75.94 | 7.56 | 0.23 | 1.49 |
| -30.481000 | 1.61 | 0.06 | 0.05 | 0.67 | 0.03 | 0.01 | 1.61 | 1.67 | 1.76 | 0.17 | 0.59 | |||
| Ton 2 | 264.043750 | 6.40 | -184.72 | -5.66 | -0.50 | 0.24 | 1.79 | -1.02 | -0.38 | 179.64 | 176.84 | 154.82 | 2.02 | 3.79 |
| -38.553333 | 1.12 | 0.13 | 0.11 | 0.63 | 0.10 | 0.04 | 1.24 | 3.37 | 3.65 | 0.31 | 0.83 |
| Name | RA | X | Y | Z | U | V | W | |||||||
|---|---|---|---|---|---|---|---|---|---|---|---|---|---|---|
| DEC | ||||||||||||||
| [deg] | [kpc] | [km/s] | [mas/yr] | [mas/yr] | [kpc] | [kpc] | [kpc] | [km/s] | [km/s] | [km/s] | [kpc] | kpc] | ||
| NGC 6388 | 264.071777 | 10.74 | 82.85 | -1.33 | -2.68 | 0.12 | -2.23 | -2.66 | -1.26 | -51.29 | 85.24 | -16.91 | 1.11 | 3.79 |
| -44.735500 | 0.12 | 0.48 | 0.01 | 0.01 | 0.12 | 0.03 | 0.01 | 0.48 | 0.56 | 0.57 | 0.02 | 0.09 | ||
| NGC 6402 | 264.400391 | 9.31 | -60.71 | -3.66 | -5.03 | 0.24 | -0.28 | 3.27 | 2.38 | -47.64 | -25.80 | 23.42 | 0.65 | 4.35 |
| -3.245917 | 0.44 | 0.45 | 0.01 | 0.01 | 0.40 | 0.15 | 0.11 | 0.46 | 0.52 | 0.53 | 0.17 | 0.20 | ||
| NGC 6401 | 264.652500 | 7.70 | -99.26 | -2.79 | 1.48 | 0.11 | 0.43 | 0.46 | 0.53 | 95.22 | 237.52 | 115.21 | 0.60 | 2.04 |
| -23.909500 | 3.18 | 0.03 | 0.03 | 0.77 | 0.05 | 0.05 | 3.18 | 1.15 | 1.19 | 0.41 | 0.65 | |||
| NGC 6397 | 265.175385 | 2.44 | 18.39 | 3.30 | -17.60 | -0.14 | 5.88 | -0.89 | -0.51 | 56.82 | 109.54 | -128.55 | 2.63 | 6.23 |
| -53.674335 | 0.04 | 0.10 | 0.01 | 0.01 | 0.04 | 0.01 | 0.01 | 0.10 | 0.08 | 0.07 | 0.03 | 0.02 | ||
| Pal 6 | 265.925833 | 5.80 | 176.28 | -9.17 | -5.26 | 0.38 | 2.31 | 0.21 | 0.18 | -192.18 | 3.52 | 151.65 | 0.40 | 3.71 |
| -26.222500 | 1.53 | 0.06 | 0.05 | 0.58 | 0.02 | 0.02 | 1.53 | 1.54 | 1.64 | 0.10 | 0.73 | |||
| NGC 6426 | 266.227708 | 35.30 | -210.51 | -1.84 | -3.00 | 0.40 | -21.80 | 15.96 | 9.87 | -98.43 | -366.40 | -10.06 | 26.84 | 215.31 |
| 3.170138 | 0.51 | 0.03 | 0.03 | 2.99 | 1.60 | 0.99 | 2.37 | 3.96 | 4.30 | 5.46 | 166.31 | |||
| Djor 1 | 266.867916 | 13.70 | -359.81 | -5.26 | -8.38 | -0.03 | -5.56 | -0.79 | -0.59 | 384.51 | -368.00 | 34.37 | 4.36 | 136.13 |
| -33.065555 | 1.98 | 0.14 | 0.12 | 1.37 | 0.08 | 0.06 | 2.04 | 7.96 | 8.75 | 1.76 | 143.44 | |||
| Ter 5 | 267.020200 | 5.50 | -81.40 | -1.71 | -4.64 | 0.36 | 2.61 | 0.37 | 0.16 | 60.89 | 120.54 | -19.35 | 0.82 | 2.83 |
| -24.779055 | 0.51 | 1.36 | 0.11 | 0.10 | 0.51 | 0.03 | 0.02 | 1.38 | 2.74 | 2.82 | 0.32 | 0.54 | ||
| NGC 6440 | 267.219583 | 8.24 | -69.39 | -1.01 | -3.81 | 0.52 | -0.05 | 1.11 | 0.55 | 34.82 | 96.62 | -39.64 | 0.30 | 1.53 |
| -20.360250 | 0.93 | 0.06 | 0.06 | 0.81 | 0.11 | 0.05 | 0.99 | 2.33 | 2.38 | 0.12 | 0.37 | |||
| NGC 6441 | 267.554413 | 11.83 | 17.27 | -2.51 | -5.32 | 0.13 | -3.61 | -1.33 | -1.03 | 11.45 | -75.90 | -24.44 | 1.00 | 3.91 |
| -37.051445 | 0.14 | 0.93 | 0.03 | 0.03 | 0.14 | 0.02 | 0.01 | 0.96 | 1.62 | 1.66 | 0.08 | 0.13 | ||
| Ter 6 | 267.693250 | 6.70 | 137.15 | -5.58 | -6.91 | 0.19 | 1.41 | -0.17 | -0.25 | -142.67 | -30.19 | 42.17 | 0.24 | 1.59 |
| -31.275388 | 1.70 | 0.18 | 0.16 | 0.67 | 0.02 | 0.03 | 1.71 | 5.22 | 5.61 | 0.09 | 0.56 | |||
| NGC 6453 | 267.715423 | 11.60 | -91.16 | 0.13 | -5.82 | 0.17 | -3.44 | -0.86 | -0.78 | 111.30 | -11.27 | -155.38 | 1.56 | 4.27 |
| -34.599166 | 3.08 | 0.02 | 0.02 | 1.15 | 0.09 | 0.08 | 3.09 | 1.13 | 1.19 | 0.90 | 1.42 | |||
| UKS 1 | 268.613311 | 7.80 | 56.67 | -2.59 | -3.42 | 0.17 | 0.33 | 0.70 | 0.10 | -81.36 | 100.42 | 26.52 | 0.25 | 1.06 |
| -24.145277 | 5.21 | 0.52 | 0.44 | 0.78 | 0.07 | 0.01 | 5.40 | 17.04 | 18.61 | 0.22 | 0.32 | |||
| NGC 6496 | 269.765350 | 11.30 | -134.72 | -3.04 | -9.24 | 0.03 | -2.79 | -2.31 | -1.96 | 240.60 | -218.72 | -59.13 | 4.02 | 11.54 |
| -44.265945 | 0.26 | 0.02 | 0.01 | 1.09 | 0.23 | 0.20 | 0.32 | 0.76 | 0.81 | 0.94 | 7.69 | |||
| Ter 9 | 270.411666 | 7.10 | 29.31 | -2.17 | -7.40 | 0.24 | 1.02 | 0.45 | -0.25 | -54.16 | 1.73 | -53.11 | 0.18 | 1.28 |
| -26.839722 | 2.96 | 0.06 | 0.05 | 0.71 | 0.04 | 0.02 | 2.95 | 1.78 | 1.89 | 0.09 | 0.50 | |||
| Djor 2 | 270.454583 | 6.30 | -148.05 | 0.54 | -3.04 | -0.09 | 1.81 | 0.30 | -0.28 | 135.78 | 174.04 | -44.96 | 0.82 | 2.85 |
| -27.825833 | 1.38 | 0.04 | 0.03 | 0.63 | 0.03 | 0.03 | 1.37 | 1.06 | 1.14 | 0.37 | 0.85 | |||
| NGC 6517 | 270.460500 | 10.60 | -37.07 | -1.49 | -4.23 | 0.31 | -1.84 | 3.47 | 1.25 | -53.68 | 31.75 | -34.33 | 0.50 | 4.24 |
| -8.958777 | 1.68 | 0.03 | 0.03 | 0.99 | 0.35 | 0.12 | 1.64 | 1.43 | 1.46 | 0.15 | 0.72 | |||
| Ter 10 | 270.741666 | 5.80 | -64.11 | -6.91 | -2.40 | 0.17 | 2.32 | 0.45 | -0.19 | 36.85 | 97.21 | 142.25 | 0.94 | 2.41 |
| -26.072500 | 3.09 | 0.06 | 0.05 | 0.58 | 0.04 | 0.02 | 3.07 | 1.48 | 1.55 | 0.23 | 0.53 | |||
| NGC 6522 | 270.891750 | 8.00 | -13.90 | 2.62 | -6.40 | 0.08 | 0.12 | 0.14 | -0.55 | 13.90 | 88.68 | -196.55 | 0.28 | 1.07 |
| -30.033972 | 0.60 | 0.71 | 0.03 | 0.02 | 0.60 | 0.01 | 0.04 | 0.71 | 0.92 | 0.94 | 0.20 | 0.27 | ||
| NGC 6535 | 270.960449 | 6.50 | -214.85 | -4.24 | -2.92 | 0.06 | 2.41 | 2.92 | 1.18 | 124.64 | 24.71 | 40.93 | 1.01 | 4.47 |
| -0.297639 | 0.46 | 0.03 | 0.02 | 0.57 | 0.29 | 0.12 | 0.54 | 0.71 | 0.78 | 0.23 | 0.23 | |||
| NGC 6528 | 271.206833 | 7.45 | 210.31 | -2.17 | -5.52 | 0.10 | 0.67 | 0.15 | -0.54 | -222.93 | 48.75 | -35.57 | 0.41 | 1.61 |
| -30.056277 | 0.75 | 0.06 | 0.06 | 0.74 | 0.01 | 0.05 | 0.76 | 1.99 | 2.06 | 0.10 | 0.87 | |||
| NGC 6539 | 271.207000 | 7.85 | 35.69 | -6.82 | -3.48 | 0.17 | 0.81 | 2.77 | 0.93 | -110.07 | 38.04 | 171.07 | 1.98 | 3.34 |
| -7.585861 | 0.66 | 0.55 | 0.02 | 0.02 | 0.61 | 0.23 | 0.08 | 0.59 | 0.82 | 0.90 | 0.16 | 0.21 | ||
| NGC 6540 | 271.535833 | 5.20 | -17.98 | -3.80 | -2.73 | 0.21 | 2.92 | 0.30 | -0.30 | -1.99 | 147.35 | 57.39 | 1.43 | 2.82 |
| -27.765277 | 0.84 | 0.05 | 0.05 | 0.52 | 0.03 | 0.03 | 0.84 | 1.15 | 1.17 | 0.37 | 0.50 | |||
| NGC 6544 | 271.835750 | 2.60 | -38.12 | -2.34 | -18.66 | 0.08 | 5.52 | 0.26 | -0.10 | 8.23 | 34.12 | -77.69 | 0.62 | 5.48 |
| -24.997333 | 0.27 | 0.76 | 0.04 | 0.04 | 0.27 | 0.03 | 0.01 | 0.75 | 0.51 | 0.51 | 0.20 | 0.33 | ||
| NGC 6541 | 272.009826 | 7.95 | -163.97 | 0.32 | -8.85 | -0.19 | 0.44 | -1.45 | -1.54 | 232.04 | 1.46 | -119.82 | 1.76 | 3.64 |
| -43.714889 | 0.37 | 0.46 | 0.01 | 0.01 | 0.36 | 0.07 | 0.07 | 0.46 | 0.38 | 0.39 | 0.21 | 0.18 | ||
| ESO 280-SC06 | 272.275000 | 22.90 | 93.20 | -0.53 | -2.80 | 0.26 | -13.67 | -5.07 | -4.98 | -14.57 | -54.31 | -94.17 | 3.35 | 16.15 |
| -46.423333 | 0.34 | 0.06 | 0.04 | 2.18 | 0.51 | 0.50 | 1.52 | 4.89 | 5.60 | 1.77 | 2.30 | |||
| NGC 6553 | 272.323333 | 6.75 | 0.72 | 0.30 | -0.41 | 0.16 | 1.39 | 0.62 | -0.36 | -11.66 | 245.42 | -7.60 | 1.29 | 2.35 |
| -25.908694 | 0.22 | 0.40 | 0.02 | 0.02 | 0.22 | 0.02 | 0.01 | 0.40 | 0.61 | 0.62 | 0.22 | 0.19 | ||
| 2MS 2 | 272.402099 | 7.10 | -237.75 | -1.97 | -3.72 | 0.55 | 1.10 | 1.21 | -0.08 | 199.15 | 72.30 | 7.18 | 0.48 | 2.43 |
| -20.778888 | 10.10 | 0.16 | 0.15 | 0.70 | 0.12 | 0.01 | 10.00 | 5.28 | 5.38 | 0.22 | 0.50 | |||
| NGC 6558 | 272.573333 | 7.20 | -194.69 | -1.77 | -4.14 | 0.07 | 0.94 | 0.02 | -0.76 | 183.43 | 98.56 | 13.94 | 0.58 | 1.75 |
| -31.763888 | 0.67 | 0.81 | 0.02 | 0.02 | 0.67 | 0.00 | 0.07 | 0.81 | 0.82 | 0.84 | 0.10 | 0.83 |
| Name | RA | X | Y | Z | U | V | W | |||||||
|---|---|---|---|---|---|---|---|---|---|---|---|---|---|---|
| DEC | ||||||||||||||
| [deg] | [kpc] | [km/s] | [mas/yr] | [mas/yr] | [kpc] | [kpc] | [kpc] | [km/s] | [km/s] | [km/s] | [kpc] | kpc] | ||
| IC 1276 | 272.684166 | 5.39 | 155.06 | -2.47 | -4.41 | 0.15 | 3.12 | 1.99 | 0.53 | -202.12 | 189.79 | 24.67 | 3.47 | 5.76 |
| -7.207611 | 0.51 | 0.69 | 0.03 | 0.03 | 0.47 | 0.19 | 0.05 | 0.72 | 0.87 | 0.89 | 0.12 | 0.60 | ||
| Ter 12 | 273.065833 | 3.40 | 94.77 | -6.07 | -2.63 | 0.38 | 4.74 | 0.49 | -0.12 | -119.39 | 183.21 | 69.25 | 2.99 | 5.82 |
| -22.741944 | 0.97 | 0.06 | 0.06 | 0.34 | 0.05 | 0.01 | 0.97 | 0.94 | 0.98 | 0.26 | 0.45 | |||
| NGC 6569 | 273.411666 | 10.59 | -49.83 | -4.13 | -7.26 | 0.13 | -2.42 | 0.09 | -1.23 | 33.37 | -167.37 | 25.87 | 1.84 | 2.94 |
| -31.826888 | 0.80 | 0.50 | 0.02 | 0.02 | 0.79 | 0.01 | 0.09 | 0.50 | 0.83 | 0.85 | 0.92 | 0.86 | ||
| BH 261 | 273.527500 | 6.50 | -29.38 | 3.59 | -3.57 | 0.37 | 1.64 | 0.38 | -0.60 | 29.17 | 204.93 | -138.77 | 1.30 | 2.59 |
| -28.635000 | 0.60 | 0.03 | 0.03 | 0.65 | 0.04 | 0.06 | 0.61 | 0.91 | 0.94 | 0.55 | 0.47 | |||
| NGC 6584 | 274.656646 | 13.18 | 260.64 | -0.05 | -7.22 | -0.15 | -3.93 | -3.88 | -3.72 | -74.41 | -204.61 | -235.01 | 2.10 | 19.25 |
| -52.215778 | 1.58 | 0.01 | 0.01 | 1.20 | 0.39 | 0.37 | 1.49 | 0.98 | 0.99 | 1.08 | 7.32 | |||
| Mercer 5 | 275.832500 | 5.50 | 185.50 | -4.22 | -6.97 | 0.19 | 2.86 | 1.66 | -0.01 | -252.04 | 106.20 | 19.02 | 2.12 | 5.53 |
| -13.668611 | 3.75 | 0.35 | 0.31 | 0.52 | 0.17 | 0.00 | 4.34 | 7.97 | 8.88 | 0.14 | 0.75 | |||
| NGC 6624 | 275.918793 | 7.19 | 54.26 | 0.11 | -6.92 | 0.01 | 0.99 | 0.35 | -0.99 | -59.82 | 45.74 | -109.03 | 0.46 | 1.56 |
| -30.361029 | 0.37 | 0.45 | 0.02 | 0.02 | 0.37 | 0.02 | 0.05 | 0.46 | 0.68 | 0.69 | 0.14 | 0.11 | ||
| NGC 6626 | 276.136708 | 5.43 | 11.11 | -0.33 | -8.92 | -0.32 | 2.75 | 0.73 | -0.53 | -40.81 | 46.54 | -91.42 | 0.57 | 2.90 |
| -24.869778 | 0.28 | 0.60 | 0.02 | 0.02 | 0.28 | 0.04 | 0.03 | 0.60 | 0.46 | 0.47 | 0.10 | 0.23 | ||
| NGC 6638 | 277.733734 | 10.32 | 8.63 | -2.58 | -4.05 | 0.38 | -2.04 | 1.41 | -1.29 | -54.61 | 22.25 | 29.61 | 0.40 | 2.94 |
| -25.497472 | 2.00 | 0.02 | 0.02 | 1.01 | 0.14 | 0.13 | 1.99 | 1.16 | 1.17 | 0.13 | 0.89 | |||
| NGC 6637 | 277.846252 | 8.80 | 46.63 | -5.12 | -5.81 | 0.38 | -0.56 | 0.26 | -1.57 | -81.84 | -56.74 | 84.69 | 0.73 | 2.07 |
| -32.348083 | 1.45 | 0.01 | 0.01 | 0.87 | 0.03 | 0.16 | 1.43 | 0.47 | 0.52 | 0.54 | 0.34 | |||
| NGC 6642 | 277.975416 | 8.05 | -33.23 | -0.19 | -3.90 | 0.15 | 0.22 | 1.36 | -0.90 | 4.97 | 111.48 | -49.38 | 0.37 | 2.11 |
| -23.475194 | 1.13 | 0.03 | 0.03 | 0.79 | 0.14 | 0.09 | 1.13 | 1.01 | 1.03 | 0.15 | 0.28 | |||
| NGC 6652 | 278.940124 | 10.00 | -99.04 | -5.49 | -4.21 | 0.01 | -1.70 | 0.26 | -1.97 | 48.36 | -40.57 | 174.96 | 0.65 | 3.66 |
| -32.990722 | 0.51 | 0.02 | 0.02 | 0.98 | 0.03 | 0.20 | 0.53 | 0.86 | 0.88 | 0.49 | 0.97 | |||
| NGC 6656 | 279.099762 | 3.23 | -147.76 | 9.82 | -5.54 | 0.28 | 4.95 | 0.55 | -0.42 | 153.95 | 214.15 | -144.25 | 2.96 | 9.45 |
| -23.904749 | 0.08 | 0.30 | 0.01 | 0.01 | 0.08 | 0.01 | 0.01 | 0.30 | 0.14 | 0.13 | 0.05 | 0.02 | ||
| Pal 8 | 280.374572 | 12.80 | -41.14 | -2.04 | -5.64 | 0.33 | -4.23 | 3.10 | -1.51 | -54.90 | -109.80 | -28.96 | 2.29 | 5.58 |
| -19.825834 | 1.81 | 0.01 | 0.01 | 1.23 | 0.31 | 0.15 | 1.76 | 0.84 | 0.80 | 1.07 | 0.99 | |||
| NGC 6681 | 280.803162 | 9.31 | 216.62 | 1.39 | -4.72 | 0.29 | -0.98 | 0.45 | -2.02 | -199.86 | 96.95 | -177.94 | 0.84 | 4.97 |
| -32.292110 | 0.17 | 0.84 | 0.02 | 0.02 | 0.17 | 0.01 | 0.04 | 0.84 | 0.82 | 0.84 | 0.08 | 0.28 | ||
| NGC 6712 | 283.267916 | 6.95 | -107.45 | 3.32 | -4.38 | 0.20 | 1.84 | 2.97 | -0.52 | 62.82 | 129.40 | -146.93 | 0.45 | 4.77 |
| -8.706111 | 0.39 | 0.29 | 0.01 | 0.01 | 0.35 | 0.17 | 0.03 | 0.30 | 0.32 | 0.34 | 0.10 | 0.10 | ||
| NGC 6715 | 283.763855 | 24.13 | 143.06 | -2.73 | -1.38 | 0.20 | -15.19 | 2.29 | -5.87 | -229.62 | 3.26 | 189.18 | 12.58 | 36.93 |
| -30.479862 | 0.40 | 0.56 | 0.02 | 0.02 | 0.39 | 0.04 | 0.10 | 0.87 | 2.55 | 2.52 | 0.47 | 2.11 | ||
| NGC 6717 | 283.775177 | 7.10 | 32.45 | -3.10 | -4.95 | 0.52 | 1.30 | 1.55 | -1.34 | -90.12 | 70.04 | 24.81 | 0.89 | 2.72 |
| -22.701473 | 1.44 | 0.03 | 0.03 | 0.68 | 0.16 | 0.13 | 1.40 | 1.03 | 1.02 | 0.17 | 0.24 | |||
| NGC 6723 | 284.888123 | 8.30 | -94.18 | 1.00 | -2.42 | 0.11 | 0.18 | 0.01 | -2.47 | 99.95 | 177.60 | -32.88 | 2.08 | 2.84 |
| -36.632248 | 0.47 | 0.26 | 0.01 | 0.01 | 0.45 | 0.00 | 0.14 | 0.30 | 0.56 | 0.55 | 0.14 | 0.07 | ||
| NGC 6749 | 286.313750 | 7.80 | -58.44 | -2.89 | -6.00 | 0.26 | 1.81 | 4.60 | -0.30 | -109.13 | 18.90 | 3.09 | 1.60 | 5.07 |
| 1.884166 | 0.96 | 0.06 | 0.06 | 0.63 | 0.46 | 0.03 | 1.50 | 1.83 | 2.18 | 0.28 | 0.25 | |||
| NGC 6752 | 287.717102 | 4.25 | -26.28 | -3.17 | -4.01 | 0.14 | 4.59 | -1.53 | -1.84 | 27.75 | 170.00 | 62.12 | 3.23 | 5.37 |
| -59.984554 | 0.09 | 0.16 | 0.01 | 0.01 | 0.07 | 0.03 | 0.04 | 0.19 | 0.23 | 0.23 | 0.08 | 0.04 | ||
| NGC 6760 | 287.800041 | 7.95 | -0.42 | -1.11 | -3.59 | 0.33 | 1.69 | 4.67 | -0.54 | -91.53 | 138.41 | -17.28 | 1.90 | 5.67 |
| 1.030472 | 0.50 | 1.63 | 0.02 | 0.02 | 0.40 | 0.29 | 0.03 | 1.40 | 1.14 | 0.78 | 0.09 | 0.19 | ||
| NGC 6779 | 289.148193 | 9.68 | -136.97 | -2.02 | 1.65 | 0.05 | 3.70 | 8.50 | 1.40 | 82.18 | 128.82 | 103.09 | 0.97 | 12.39 |
| 30.183471 | 0.75 | 0.45 | 0.01 | 0.01 | 0.34 | 0.66 | 0.11 | 0.53 | 0.48 | 0.53 | 0.38 | 0.78 | ||
| Ter 7 | 289.432983 | 22.80 | 159.45 | -2.99 | -1.60 | 0.31 | -13.28 | 1.27 | -7.82 | -260.69 | -5.65 | 182.90 | 13.14 | 44.72 |
| -34.657722 | 0.14 | 0.02 | 0.02 | 2.14 | 0.13 | 0.78 | 0.87 | 2.34 | 2.32 | 2.68 | 18.57 | |||
| Pal 10 | 289.508728 | 5.90 | -31.70 | -4.29 | -7.00 | 0.06 | 4.51 | 4.67 | 0.28 | -172.99 | 86.88 | 20.91 | 4.01 | 7.02 |
| 18.571666 | 0.23 | 0.04 | 0.04 | 0.36 | 0.47 | 0.03 | 0.97 | 0.77 | 1.25 | 0.31 | 0.27 | |||
| Arp 2 | 292.183807 | 28.60 | 123.01 | -2.38 | -1.53 | 0.12 | -18.34 | 3.97 | -10.15 | -251.65 | -20.12 | 180.69 | 18.46 | 60.87 |
| -30.355638 | 0.33 | 0.03 | 0.02 | 2.64 | 0.40 | 1.01 | 1.34 | 2.99 | 3.15 | 3.05 | 19.85 | |||
| NGC 6809 | 294.998779 | 5.30 | 174.40 | -3.41 | -9.27 | 0.14 | 3.29 | 0.74 | -2.09 | -209.88 | 31.89 | -55.72 | 1.59 | 5.54 |
| -30.964750 | 0.20 | 0.24 | 0.01 | 0.01 | 0.18 | 0.03 | 0.08 | 0.23 | 0.17 | 0.18 | 0.02 | 0.15 | ||
| Ter 8 | 295.435028 | 26.73 | 148.53 | -2.44 | -1.55 | -0.25 | -16.09 | 2.44 | -11.11 | -271.58 | -1.88 | 161.22 | 16.23 | 53.86 |
| -33.999474 | 0.17 | 0.02 | 0.01 | 2.42 | 0.24 | 1.11 | 0.95 | 1.47 | 1.97 | 3.06 | 21.09 | |||
| Pal 11 | 296.310000 | 14.30 | -67.64 | -1.79 | -4.94 | 0.29 | -3.61 | 7.26 | -3.84 | -133.67 | -88.37 | -11.17 | 5.43 | 9.16 |
| -8.007222 | 0.76 | 0.03 | 0.03 | 1.17 | 0.73 | 0.38 | 1.34 | 1.63 | 2.09 | 2.07 | 1.25 |
| Name | RA | X | Y | Z | U | V | W | |||||||
|---|---|---|---|---|---|---|---|---|---|---|---|---|---|---|
| DEC | ||||||||||||||
| [deg] | [kpc] | [km/s] | [mas/yr] | [mas/yr] | [kpc] | [kpc] | [kpc] | [km/s] | [km/s] | [km/s] | [kpc] | kpc] | ||
| NGC 6838 | 298.443726 | 3.99 | -22.27 | -3.41 | -2.61 | 0.14 | 5.92 | 3.33 | -0.32 | -63.25 | 194.38 | 39.17 | 4.77 | 7.08 |
| 18.779194 | 0.20 | 0.19 | 0.01 | 0.01 | 0.11 | 0.17 | 0.02 | 0.23 | 0.21 | 0.24 | 0.06 | 0.01 | ||
| NGC 6864 | 301.519541 | 21.61 | -189.08 | -0.58 | -2.78 | 0.25 | -10.16 | 6.75 | -9.39 | 66.92 | -83.26 | 49.40 | 2.06 | 17.98 |
| -21.921166 | 1.12 | 0.02 | 0.01 | 1.83 | 0.68 | 0.94 | 1.29 | 1.45 | 1.57 | 1.15 | 2.78 | |||
| NGC 6934 | 308.547393 | 15.40 | -406.22 | -2.66 | -4.67 | 0.25 | -0.85 | 11.50 | -4.99 | -81.30 | -296.06 | 123.54 | 2.60 | 39.52 |
| 7.404472 | 1.05 | 0.73 | 0.01 | 0.01 | 0.61 | 0.79 | 0.34 | 0.94 | 0.84 | 1.00 | 1.12 | 10.59 | ||
| NGC 6981 | 313.365417 | 17.00 | -331.39 | -1.29 | -3.32 | 0.41 | -3.60 | 8.24 | -9.18 | 58.83 | -147.30 | 173.19 | 1.29 | 24.01 |
| -12.537305 | 1.47 | 0.02 | 0.02 | 1.17 | 0.82 | 0.92 | 1.52 | 1.37 | 1.56 | 0.74 | 4.52 | |||
| NGC 7006 | 315.372416 | 42.80 | -383.47 | -0.08 | -0.61 | -0.10 | -9.74 | 36.21 | -14.22 | 60.08 | -138.66 | 76.71 | 2.07 | 55.44 |
| 16.187333 | 0.73 | 0.03 | 0.04 | 1.78 | 3.62 | 1.42 | 6.09 | 3.91 | 6.24 | 0.94 | 5.60 | |||
| NGC 7078 | 322.493042 | 10.22 | -106.76 | -0.63 | -3.80 | -0.10 | 4.26 | 8.23 | -4.69 | -99.01 | 59.26 | -26.87 | 3.57 | 10.39 |
| 12.167001 | 0.13 | 0.25 | 0.01 | 0.01 | 0.05 | 0.10 | 0.06 | 0.53 | 0.39 | 0.51 | 0.06 | 0.08 | ||
| NGC 7089 | 323.362579 | 10.51 | -3.72 | 3.51 | -2.16 | 0.01 | 3.01 | 6.84 | -6.14 | 67.44 | 157.45 | -157.03 | 0.56 | 16.80 |
| -0.823250 | 0.37 | 0.34 | 0.01 | 0.01 | 0.18 | 0.24 | 0.22 | 0.46 | 0.43 | 0.44 | 0.10 | 0.59 | ||
| NGC 7099 | 325.092133 | 8.00 | -185.19 | -0.73 | -7.24 | 0.53 | 3.23 | 2.50 | -5.84 | 7.77 | -63.29 | 110.23 | 1.49 | 8.15 |
| -23.179861 | 0.57 | 0.17 | 0.01 | 0.01 | 0.35 | 0.18 | 0.42 | 0.42 | 0.49 | 0.38 | 0.05 | 0.50 | ||
| Pal 12 | 326.661804 | 19.00 | 27.91 | -3.28 | -3.31 | 0.33 | -2.92 | 6.49 | -14.05 | -339.19 | 12.40 | 116.00 | 15.75 | 71.17 |
| -21.252611 | 0.28 | 0.03 | 0.03 | 1.10 | 0.65 | 1.40 | 2.24 | 2.49 | 1.87 | 1.92 | 37.83 | |||
| Pal 13 | 346.685166 | 24.80 | 25.87 | 1.64 | 0.25 | 0.04 | 7.18 | 18.20 | -16.82 | 168.87 | 227.72 | -67.29 | 9.04 | 67.47 |
| 12.772000 | 0.27 | 0.09 | 0.07 | 0.09 | 1.82 | 1.68 | 10.19 | 6.12 | 6.73 | 1.74 | 10.86 | |||
| NGC 7492 | 347.110958 | 26.55 | -176.70 | 0.76 | -2.30 | 0.10 | 1.03 | 9.52 | -23.76 | -5.14 | -95.43 | 63.68 | 4.27 | 28.23 |
| -15.611500 | 0.27 | 0.03 | 0.02 | 0.71 | 0.95 | 2.38 | 3.53 | 3.02 | 1.66 | 2.29 | 2.98 |
| Name | Source | Type |
|---|---|---|
| 2MASS-GC02 | Borissova et al. (2007) | LOS |
| AM 1 | Dotter, Sarajedini & Yang (2008) | MF |
| Hilker (2006) | SD | |
| Suntzeff, Olszewski & Stetson (1985) | LOS | |
| AM 4 | Hamren et al. (2013) | MF |
| Muñoz et al. (2018b) | SD | |
| Carraro (2009) | SD | |
| Crater | Kirby, Simon & Cohen (2015) | LOS |
| Voggel et al. (2016) | LOS | |
| Weisz et al. (2016) | SD, MF | |
| Djor 1 | Côté (1999) | LOS |
| E 3 | Monaco et al. (2018) | LOS |
| Eridanus | Ortolani & Gratton (1986) | SD |
| Stetson et al. (1999) | MF | |
| Muñoz et al. (2018b) | SD | |
| ESO 280-SC08 | Bonatto & Bica (2008) | SD |
| Simpson (2018) | LOS | |
| FSR 1716 | Bonatto & Bica (2008) | SD |
| Koch, Kunder & Wojno (2017) | LOS | |
| Contreras Ramos et al. (2018) | LOS | |
| FSR 1735 | Carballo-Bello et al. (2016) | LOS |
| IC 1257 | Côté (1999) | LOS |
| Lynga 7 | Bonatto & Bica (2008) | SD |
| Mercer 5 | Peñaloza et al. (2011) | LOS |
| NGC 2419 | Bellazzini et al. (2012) | MF |
| NGC 2808 | Milone et al. (2012) | MF |
| NGC 5139 | Elson et al. (1995) | MF |
| de Marchi (1999) | MF | |
| NGC 5897 | Nardiello et al. (2018) | MF |
| NGC 6093 | Zánmar Sánchez (2009) | LOS |
| NGC 6380 | Côté (1999) | LOS |
| NGC 6388 | Carretta & Bragaglia (2018) | LOS |
| NGC 6426 | Hanke et al. (2017) | LOS |
| Koch, Hanke & Kacharov (2018) | LOS | |
| NGC 6528 | Muñoz et al. (2018a) | LOS |
| NGC 6535 | Halford & Zaritsky (2015) | MF |
| NGC 6544 | Cohen et al. (2014) | SD, MF |
| NGC 6558 | Barbuy et al. (2018) | LOS |
| NGC 6584 | O’Malley & Chaboyer (2018) | LOS |
| NGC 6624 | Saracino et al. (2016) | MF |
| NGC 6864 | Koch, Hanke & Kacharov (2018) | LOS |
| NGC 6981 | Sollima et al. (2017) | MF |
| Pal 1 | Borissova & Spassova (1995) | SD |
| Rosenberg et al. (1998) | MF, SD | |
| Pal 2 | Harris et al. (1997) | SD |
| Muñoz et al. (2018b) | SD | |
| Pal 3 | Stetson et al. (1999) | MF |
| Pal 5 | Grillmair & Smith (2001) | MF |
| Pal 6 | Lee, Carney & Balachandran (2004) | LOS |
| Abolfathi et al. (2018) | LOS | |
| Pal 10 | Kaisler, Harris & McLaughlin (1997) | LOS |
| Côté (1999) | LOS |
| Name | Source | Type |
|---|---|---|
| Pal 13 | Hamren et al. (2013) | MF |
| Pal 15 | Peterson & Latham (1989) | LOS |
| Muñoz et al. (2018b) | SD | |
| Pyxis | Muñoz et al. (2018b) | SD |
| Ter 4 | Origlia & Rich (2004) | LOS |
| Bonatto & Bica (2008) | SD | |
| Ter 12 | Côté (1999) | LOS |
| UKS 1 | Origlia et al. (2005) | LOS |
| Whiting 1 | Carraro, Zinn & Moni Bidin (2007) | SD, MF |
| Muñoz et al. (2018b) | SD |
| Name | Alt. | ||
|---|---|---|---|
| name | [kpc] | [kpc] | |
| IC 1276 | Pal 7 | 5.29 1.45 | 5.4 |
| NGC 104 | 47 Tuc | 4.45 0.04 | 4.5 |
| NGC 288 | 10.16 0.35 | 8.9 | |
| NGC 362 | 9.22 0.28 | 8.6 | |
| NGC 1851 | 11.32 0.20 | 12.1 | |
| NGC 2808 | 10.22 0.12 | 9.6 | |
| NGC 3201 | 4.47 0.18 | 4.9 | |
| NGC 4372 | 5.76 0.32 | 5.8 | |
| NGC 4833 | 6.10 0.43 | 6.6 | |
| NGC 5139 | Cen | 5.24 0.05 | 5.2 |
| NGC 5272 | M 3 | 9.47 0.45 | 10.2 |
| NGC 5904 | M 5 | 7.58 0.14 | 7.5 |
| NGC 5927 | 8.18 0.29 | 7.7 | |
| NGC 5986 | 10.62 0.81 | 10.4 | |
| NGC 6093 | M 80 | 8.37 0.65 | 10.0 |
| NGC 6121 | M 4 | 1.96 0.04 | 2.2 |
| NGC 6139 | 9.16 1.98 | 10.1 | |
| NGC 6171 | M 107 | 5.92 0.38 | 6.4 |
| NGC 6205 | M 13 | 6.76 0.31 | 7.1 |
| NGC 6218 | M 12 | 4.64 0.24 | 4.8 |
| NGC 6254 | M 10 | 5.02 0.14 | 4.4 |
| NGC 6266 | M 62 | 6.40 0.18 | 6.8 |
| NGC 6273 | M 19 | 8.13 0.47 | 8.7 |
| NGC 6293 | 9.00 0.81 | 9.5 | |
| NGC 6304 | 5.69 0.52 | 5.9 | |
| NGC 6341 | M 92 | 8.48 0.32 | 8.3 |
| NGC 6362 | 7.34 0.31 | 7.6 | |
| NGC 6366 | 3.75 0.25 | 3.5 | |
| NGC 6388 | 10.75 0.12 | 9.9 | |
| NGC 6397 | 2.45 0.04 | 2.3 | |
| NGC 6402 | M 14 | 9.31 0.50 | 9.3 |
| NGC 6441 | 11.83 0.15 | 11.6 | |
| NGC 6522 | 8.44 0.95 | 7.7 | |
| NGC 6541 | 8.09 0.42 | 7.5 | |
| NGC 6544 | 2.73 0.27 | 3.0 | |
| NGC 6553 | 6.88 0.24 | 6.0 | |
| NGC 6569 | 10.24 1.16 | 10.9 | |
| NGC 6624 | 6.94 0.42 | 7.9 | |
| NGC 6626 | M 28 | 5.42 0.33 | 5.5 |
| NGC 6656 | M 22 | 3.24 0.08 | 3.2 |
| NGC 6681 | M 70 | 9.34 0.18 | 9.0 |
| NGC 6712 | 6.95 0.38 | 6.9 | |
| NGC 6715 | M 54 | 24.15 0.38 | 26.5 |
| NGC 6723 | 8.16 0.54 | 8.7 | |
| NGC 6752 | 4.26 0.09 | 4.0 | |
| NGC 6779 | M 56 | 10.18 1.27 | 9.4 |
| NGC 6809 | M 55 | 5.31 0.22 | 5.4 |
| NGC 6838 | M 71 | 3.98 0.23 | 4.0 |
| NGC 6934 | 14.57 1.43 | 15.6 | |
| NGC 7078 | M 15 | 10.21 0.13 | 10.4 |
| NGC 7089 | M 2 | 10.37 0.39 | 11.5 |
| NGC 7099 | M 30 | 7.88 0.87 | 8.1 |
| Ter 5 | 5.08 1.05 | 6.9 |
| Name | ||||||
| [arcsec] | [mas/yr] | [mas/yr] | [mas/yr] | |||
| BH 261 | 18 | 18. | 19 | 0.144 | 0.034 | 0.025 |
| 18 | 48. | 50 | 0.078 | 0.028 | 0.019 | |
| 15 | 110. | 32 | 0.063 | 0.029 | 0.018 | |
| Djor 2 | 70 | 66. | 93 | 0.071 | 0.043 | 0.071 |
| ESO 452 | 42 | 50. | 49 | 0.023 | 0.034 | 0.023 |