NuSTAR and XMM-Newton broad–band spectrum of SAX J1808.4–3658 during its latest outburst in 2015
Abstract
The first discovered accreting millisecond pulsar, SAX J1808.4–3658, went into X-ray outburst in April 2015. We triggered a 100 ks XMM-Newton ToO, taken at the peak of the outburst, and a 55 ks NuSTAR ToO, performed four days apart. We report here the results of a detailed spectral analysis of both the XMM-Newton and NuSTAR spectra. While the XMM-Newton spectrum appears much softer than in previous observations, the NuSTAR spectrum confirms the results obtained with XMM-Newton during the 2008 outburst. We find clear evidence of a broad iron line that we interpret as produced by reflection from the inner accretion disk. For the first time, we use a self-consistent reflection model to fit the reflection features in the NuSTAR spectrum; in this case we find a statistically significant improvement of the fit with respect to a simple Gaussian or diskline model to fit the iron line, implying that the reflection continuum is also significantly detected. Despite the differences evident between the XMM-Newton and NuSTAR spectra, the smearing best-fit parameters found for these spectra are consistent with each other and are compatible with previous results. In particular, we find an upper limit to the inner disk radius of . In all the cases, a high inclination angle () of the system is required. This inclination angle, combined with measurements of the radial velocity of the optical companion, results in a low value for the neutron star mass (), a result that deserves further investigation.
keywords:
line: formation — line: identification — stars: neutron — stars: individual: SAX J1808.4–3658 — stars: magnetic fields — X-ray: general — X-ray: binaries1 Introduction
An accreting millisecond pulsar (hereafter AMSP) is a neutron star (NS) accreting mass from a low mass companion star () and rotating at millisecond periods, as it is witnessed by the coherent pulsations in its X-ray light curve. This phenomenon is relatively rare among Low Mass X-ray Binaries (LMXBs) and is caused by the NS magnetic field, which is strong enough (given the accretion rate) to effectively funnel the accreting matter onto the magnetic poles. Most of the AMSPs are transient X-ray sources with recurrence times between two and more than ten years, and their outbursts usually last from a week to two months at most. SAX J1808.4–3658 (J1808 hereafter) is the first discovered AMSP (Wijnands & van der Klis 1998). The observed X-ray coherent pulsations are a fundamental probe of its dynamical and orbital state. A 60 ks long XMM-Newton observation of this source revealed a broad ( keV) emission line at the energy of iron fluorescence emission (Papitto et al. 2009, P09 hereafter). This broad line has been confirmed by Suzaku, which observed the source the day after with compatible spectral parameters within the errors (Cackett et al. 2009).
Such broadened features are ubiquitous among accreting compact objects. First discovered in Active Galactic Nuclei (AGN, see e.g. Fabian et al. 2000, for a review), these were subsequently observed in Galactic X-ray binaries containing black holes (e.g. Miller et al. 2004) or NS (e.g. Cackett et al. 2010). To explain the broadness of these features it is usually assumed that they originate from reprocessed emission of the accretion disc, illuminated by the primary Comptonized spectrum. Experimental results support the view that, in several cases, the accretion disk is truncated at few gravitational radii from the central mass. Here Doppler shifts and relativistic boosting in a fast rotating plasma, along with the gravitational red-shift caused by the strong gravitational field of the compact object, distort the line profile asymmetrically, broadening its shape up to 1 keV. Their shape thus depends on the geometry of the reflecting region of the disc, on the Keplerian velocity in the disc, and on its ionization state. In this case the line parameters allow to derive several important physical features with unprecedented accuracy. We just mention here the inclination of the disk with respect to the line of sight, which, in some cases (e.g. Di Salvo et al. 2009), is derived with an accuracy of just few degrees, and, most important, the inner disk radius, which, in some sources, is determined within 1-2 Rg (where is the gravitational radius). For these systems the compelling discovery of a fast spinning (extreme Kerr) black hole has been claimed based on the fact that the inner disc radius derived from the fit of the iron line lies below 6 Rg, which is the last stable orbit for a non-rotating (Schwarzschild) black hole (see e.g. Fabian 2005, for a review). Moreover, iron lines play a particularly important role if observed in pulsars, as they carry information about the magnetospheric radius. This radius indicates where in the disk stresses exerted by the magnetic field start to remove angular momentum from the matter. According to accretion theory, it depends on the magnetic field strength, on the accretion rate, and on the details of the interaction between the magnetic field and the accreting matter.
Studies of the iron line profile could be hence a very powerful diagnostic tool to investigate the behaviour of matter in extreme gravitational fields and to effectively constrain the compactness (mass to radius ratio) of NSs or the spin parameter of black holes in X-ray binaries. However, some authors argued against the disk origin of broad iron lines, addressing the asymmetric broadening of these lines as caused by Compton down–scattering in a outflowing wind (e.g. Titarchuk et al. 2009; see, however, Cackett & Miller 2013) or to pile-up distortions in CCD spectra (Ng et al. 2010; see, however, Miller et al. 2010 for extensive simulations of pile-up effects). Strong pile-up effects on the line profile can be excluded; in fact, it has been shown that there is a good agreement between spectral parameters derived from CCD-based spectra with those derived from gas-based spectrometers (see e.g. Cackett et al. 2012; Egron et al. 2013). More recently, observations with NuSTAR, which does not suffer from pile-up, have confirmed that iron line profiles in most LMXBs appear broad and asymmetric (see e.g. Miller et al. 2013; Degenaar et al. 2015; King et al. 2016; Sleator et al. 2016; Ludlam et al. 2017, and references therein).
Nevertheless an asymmetric broad iron line may be the effect of either reflection from a Keplerian disc or Compton broadening and/or down–scattering. However, if the origin of this line is from disc reprocessing, one would also expect the presence of a spectral hump between 20 and 40 keV due to Compton scattering of the primary spectrum by the disc. Indeed this reflection hump has been observed in the spectrum of some NS LMXBs (e.g. Barret et al. 2000; Piraino et al. 1999; Yoshida et al. 1993; Fiocchi et al. 2007; Di Salvo et al. 2015), usually with reflection amplitudes (defined in terms of the solid angle subtended by the reflector as seen from the corona) lower than 0.3, indicating a spherical geometry of the illuminating corona. Therefore, the use of broad-band, moderately high energy resolution spectra, together with the use of self-consistent reflection models able to simultaneously fit the iron line profile and the related Compton hump, are fundamental in order to probe the consistency of the parameters of the whole reflection component and the reliability of the disk parameters derived from the so-called Fe-line method (see also Matranga et al. 2017).
To date 22 AMSPs have been discovered since 1998 (see Patruno & Watts 2012; Campana & Di Salvo 2018, for reviews), the last ones discovered in 2018 (IGR J173793747, Sanna et al. 2018, and IGR J175912342, Sanna et al. 2018), and three transitional pulsars, including IGR J182452452, the only transitional pulsars that went into an X-ray outburst (Papitto et al. 2013). Spectral studies at high resolution are fundamental in order to characterise their emission during outbursts (see e.g. Poutanen 2006, for a review). Besides an energetically dominating Comptonized component, one or two soft components are often detected if enough statistics and spectral resolution is guaranteed. These soft components are interpreted as the emission arising from the accretion disc and from the NS hot spots. One of the most frequently recurring AMSP is SAX J1808.4–3658 which goes into outburst more or less regularly every 2–3 years. The light curve shape is also very regular with outburst peak fluxes between 60 and 80 mCrab (2–10 keV), and a subsequent slow decay on a timescale of days until the source decays below 16 mCrab and enters a low luminosity flaring state. Its spin frequency is constantly decreasing at a rate ( Hz/s) compatible with the one expected from dipole emission of a G rotating pulsar (Hartman et al. 2009; Sanna et al. 2017). While this is the most probable explanation for such a deceleration, it was also proposed that the NS spin-down may be due to the emission of continuous Gravitational Waves (Bildsten 1998). This source is also charactised by a puzzling fast orbital period evolution (Di Salvo et al. 2008; Hartman et al. 2009; Burderi et al. 2009; Patruno et al. 2012; Sanna et al. 2017). The time scale of this evolution is so short (few yr) that a non conservative evolution (e.g. the so-called radio-ejection model, Burderi et al. 2001) or large short-term angular momentum exchange between the mass donor and the orbit, caused by gravitational quadrupole coupling due to variations in the oblateness of the companion, are indicated as possible explanations (see Sanna et al. 2017, for a discussion). Such a conclusion might establish an evolutionary link between (at least some) AMSPs and the so-called Black Widow Pulsars. To be confirmed, this scenario needs more measures, as quasi–cyclic period variations are expected in binaries (Arzoumanian et al. 1994).
SAX J1808.4–3658 was observed with XMM-Newton during its 2008 outburst (see P09 for details). During this 60 ks observation a broad iron line ( keV) was detected at an energy of keV. Modelling this line according to the disc reflection hypothesis (diskline model) allowed P09 to place the inner radius of the reflecting region between 6 and 12 Rg and the outer radius at about 200 Rg. As SAX J1808.4–3658 is a pulsar, the inner radius can be interpreted as the magnetospheric radius, which is predicted by accretion theories to lie exactly between the coronation radius, which in the case of SAX J1808.4–3658 is at about 30 km, and the NS surface in order to allow the observation of X-ray coherent pulsations from the source (Ghosh & Lamb 1979). The statistics of the 2008 observation was nevertheless too low to discriminate between a symmetric and an asymmetric profile, although a disc interpretation is strongly favoured, as Compton broadening is not a viable explanation in a source whose Comptonized component originates at a large temperature ( keV, see e.g. Gierliński et al. 2002).
The main goal of this paper is to characterize the broad–band X-ray spectrum of the transient AMSP SAX J1808.4–3658, and in particular the iron line and other reflection features, with a larger statistics than in previous observations, taking advantage from the large exposure of the 80 ks–XMM-Newton observation and the broad–band coverage provided by the NuSTAR observation performed during the latest outburst from the source. This allowes us to acquire the source broadband spectrum and to constrain the reflection component properties such as the broad Fe emission line together with the expected Compton hump, therefore allowing to infer the properties of the accretion flow close to the NS. We report here on a detailed study of the reflection features and the fit, with a self-consistent reflection model, of both the iron line profile and the associated Compton reflection hump at energies above 10 keV. In this spectrum, which includes hard–band data (up to keV), the overall fractional amount of reflection is well determined by fitting the Compton hump. We can therefore test whether the observed iron line is consistent with this fractional amount of reflection. In this way we can confirm independently (fitting a different outburst state and using different instruments) the inner disk parameters already obtained with XMM-Newton and Suzaku for the 2008 outburst.
2 Observations
SAX J1808.4–3658, went into X-ray outburst in April 2015, after more than three years from its previous outburst in 2008. SAX J1808.4–3658 was observed by XMM-Newton on 2015 April 11 (ObsID: 0724490201) for a total observing time of about 110 ks, as a result of an anticipated target of opportunity (ToO) observation approved to observe the source during an outburst. During the observation an abrupt drop-off of the count rate was visible in the EPIC/pn light curve caused by a problem with the Star Tracker, which led the satellite to be off-target for about seven hours, resulting in 80 ks effective on-source exposure. During the observation, the EPIC/pn camera was operated in timing mode to prevent photon pile-up and to allow the analysis of the coherent and aperiodic timing behaviour of the source (see Sanna et al. 2017, for the timing analysis of these data). The EPIC/MOS cameras were switched off during the observation in order to allocate as much telemetry as possible to the pn in the case of high count rate, and the Reflection Grating Spectrometer (RGS) was operated in the standard spectroscopy mode.
We have extracted source, background spectra and response matrices using the Science Analysis Software (SAS) v.16.1.0, setting the parameters of the tools accordingly. We produced a calibrated photon event file using reprocessing tools epproc and rgsproc for the pn and RGS data, respectively. Before extracting the spectra, we searched for contaminations due to background solar flares detected in the 10-12 keV Epic-pn light-curve, but we did not find periods with high background.
We also looked for the presence of pile-up in the pn spectrum; we have run the task epatplot and we did not find any significant contamination. The count-rate registered in the pn observation was around 450 c/s, which is below the limit for avoiding contamination by pile-up. Therefore, the source spectra were extracted from a rectangular region between and . We selected only events with PATTERN and FLAG as a standard procedure to eliminate spurious events. We extracted the background spectrum from a region included between and . Finally, using the task rgscombine we have obtained the added source spectrum for RGS1+RGS2, the relative added background spectrum along with the relative response matrices. We have fitted RGS spectrum in the 0.5-1.8 keV energy range, whereas the pn spectrum in the 2.4-10 keV energy range. The spectral analysis of the XMM-Newton/EPIC-pn spectrum was restricted to 2.4-10 keV to exclude the region around the detector Si K-edge (1.8 keV) and the mirror Au M-edge (2.3 keV) that could affect our analysis, as well as to exclude possible residuals of instrumental origin below 2 keV that usually appear in case of bright sources observed in timing mode (see e.g. D’Aì et al. 2010; Egron et al. 2013).
In this paper we also analyze data collected by the NuSTAR satellite. A ToO was requested to observe the source during the 2015 outburst in order to complement the XMM-Newton spectrum with high energy coverage. The NuSTAR observation, obtained as Director Discretionary Time (DDT), was performed four days after the XMM-Newton observation, on 2015 April 15 (ObsID: 90102003002), for a total observing time of 55 ks, resulting in roughly 49 ks of exposure per telescope. Science data were extracted using NuSTARDAS (NuSTAR Data Analysis Software) v1.7.1. Source data have been extracted from a circular region with 120” radius whereas the background has been extracted from a circular region with 60” radius in a position far from the source. With the aim to get ”STAGE 2” events clean, we run the nupipeline with default values of the parameters and with the parameter SAAMODE set to optimized in order to eliminate high background events caused by the SAA passage. The average count rate during the NuSTAR observation was c/s.
A type-I burst is present during the NuSTAR observation, at about 14 ks from the beginning of the observation. The burst profile is not complete since the rise phase was in coincidence with a gap in the light curve. The peak of the burst seems to reach approximately 200 c/s, about a factor 4 the level of the persistent emission, and it lasted about 200 s. We eliminated a time interval of 250 s starting from 5 s before the rise of the burst, and checked that the spectra did not change significantly. Spectra for both detectors, FPMA and FPMB, were extracted using the nuproducts command. Corresponding response files were also created as output of nuproducts. A comparison of the FPMA and FPMB spectra, indicated a good agreement between them. We have therefore created a single added spectrum, with its corresponding background spectrum, ancillary response file and matrix response, using the addascaspec command. In this way, we obtain a summed spectrum for the two NuSTAR modules (see e.g. Miller et al. 2013). We fitted this spectrum in the 3-70 keV energy range, where the emission from the source dominates over the background.
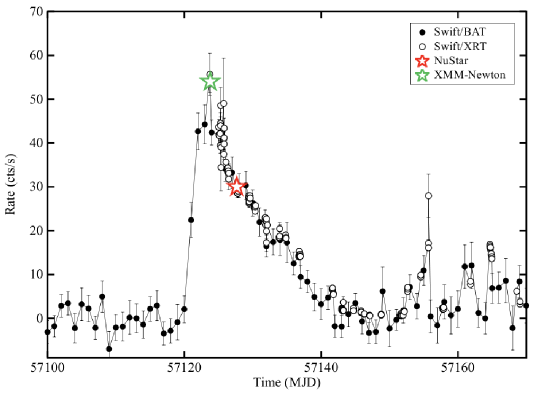
In Figure 1 we show the light curve during the 2015 outburst of SAX J1808.4–3658 obtained with the instruments, XRT and BAT, on board the Swift satellite. In this light curve the dates of the XMM-Newton and NuSTAR observations are indicated with stars.
3 Spectral Analysis and Results
For spectral analysis, the EPIC/pn energy channels were grouped in order to have at least 20 counts per energy channel and to oversample the energy resolution element by no more than three channels. RGS and NuSTAR spectra were grouped in order to have at least 20 counts per energy channel. The X-ray spectral package we use to model the observed emission is XSPEC v.12.9.1. For each fit we have used phabs in XSPEC to model the photoelectric absorption due to neutral matter, with photoelectric cross sections from Balucinska-Church & McCammon (1992) and element abundances from Anders & Grevesse (1989).
3.1 The NuSTAR spectrum
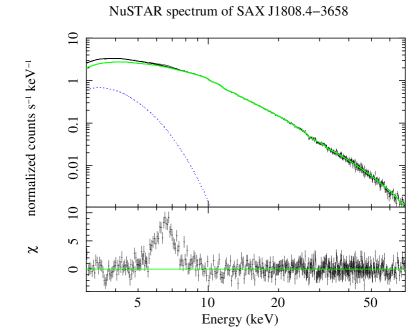
We have started analyzing the broad-band spectrum acquired with NuSTAR in the energy range keV. We fit the continuum emission with a soft blackbody and the Comptonization model nthComp in XSPEC (Życki et al. 1999), modified at low energy by photoelectric absorption caused by neutral matter. This is a standard model to fit the broad-band continuum emission in NS LMXBs of the atoll class both in the soft and in the hard states (see e.g. Piraino et al. 2007; Di Salvo et al. 2009; Egron et al. 2013; Sanna et al. 2013; Di Salvo et al. 2015, and references therein) and provides also a good fit to the broad-band continuum emission in AMSPs (see e.g. Papitto et al. 2010, 2013, 2016; Sanna et al. 2016). Because of the lack of sensitivity of NuSTAR at low energies, we had to fix the photoelectric equivalent hydrogen column density at cm-2, which is the best fit value for this parameter obtained for the X-ray spectrum of SAX J1808.4–3658 observed by XMM-Newton during the 2008 outburst (see P09). The soft blackbody component has a best fit temperature of keV, the seed photons for Comptonization, assumed to have a blackbody spectrum, have a temperature lower than keV; these photons are comptonized in a hot corona with an electron temperature of keV and a moderate optical depth, corresponding to a photon index of the Comptonization spectrum of . This continuum model gave, however, an unacceptable fit, corresponding to a , because of the presence of evident localized residuals in the keV range, clearly caused by the presence of a broad iron line, whose profile is evident in Figure 2 (left panel).
To fit these residuals we first added to our continuum model a Gaussian component to model the broad iron line profile visible in the residuals. The addition of this component resulted in a significant improvement of the fit and to an acceptable . The Gaussian centroid was at keV, its width keV, and its equivalent width was eV. We also tried to fit the residuals at the iron line energy with a diskline profile (Fabian et al. 1989) instead of a Gaussian. The addition of this component resulted in a further improvement of the fit, . The diskline component is characterized by a centroid energy of keV, indicating neutral and/or weakly ionized iron (Fe I-XV), an emissivity index, describing the emissivity of the disk as a function of the emission radius , of , an inner and outer radius of the emitting region of Rg and Rg, respectively, where R is the gravitational radius, and a large inclination angle of the system with respect to the line of sight, . The best fit parameters are reported in Table 1. These parameters are very similar (compatible well within the errors) to the best fit parameters of the iron line component obtained from the XMM-Newton spectrum of SAX J1808.4–3658 during the 2008 outburst (cf. P09); in particular the previous XMM-Newton spectrum also gave a quite small outer disk radius of Rg and a high inclination angle of .
The broad iron line profile seems to be compatible with reflection of the main Comptonization spectrum off the accretion disk, where the broadness of the profile is induced by the fast motion of the matter in the inner disk, and related (mildly) relativistic effects. However, if the iron line is produced by reflection then a Compton hump should be visible in the high energy part of the spectrum given that the source is in a hard state. To test this hypothesis we tried to substitute the diskline component with a self-consistent reflection model to fit both the iron line and the Compton hump. In particular, we used the relxillCp model (García et al. 2014), which models the irradiation of the accretion using an nthComp Comptonization continuum (Cp). Note that at the moment it is not possible to fit the temperature of the seed photons for the Comptonization component, that is fixed at 50 eV (Thomas Dauser, private communication). This should be anyway a good approximation for the case of SAX J1808.4–3658 given the low value we find for this temperature (see Table 1 and 2).
The relxillCp model allows to determine the reflection fraction, defined as ratio of intrinsic intensity emitted towards the disk compared to that escaping to infinity (see Dauser et al. 2016, for more details), the inclination angle of the system and the ionization parameter of the disk, given by , where , where is the luminosity of the incident X-ray spectrum, is the electron number density in the emitting region, and is the distance between the illuminating source and the emitting region. This reflection model includes the smearing component relconv111More details can be found in the following webpage: http://www.sternwarte.uni-erlangen.de/ dauser/research/relxill/ in order to take into account Doppler and relativistic effects caused by the fast motion of the matter in the disk. Unless specified otherwise, the two emissivity indices (defined in order to be negative as in the case of the diskline parameter Betor) have been constrained in order to assume the same value and the dimension-less spin parameter a has been fixed to 0.
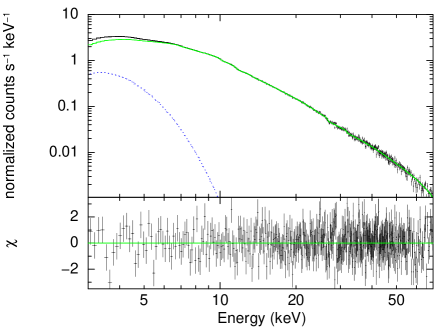
This model gives a good fit to the data, corresponding to a . We find that fixing the iron abundance, , at 2 times the solar value the fit slightly improved returning a , lower with respect to the previous fit with a diskline, corresponding to a with one extra degree of freedom. Letting the iron abundance free to vary, we find that its best fit value was corresponding to a very similar to the previous one, but the uncertainty on this parameter is quite large (), so we preferred to keep fixed this parameter at 2 times the solar value. The outer disk radius has been left free to vary, but its uncertainty could not be determined because the was quite insensitive to its value; probably the energy resolution of NuSTAR is not enough to constrain this parameter. The spectral results are reported in Table 1, and in Figure 3 (right panel) we show the NuSTAR spectrum, the best-fit model, and the residuals in units of with respect to the best-fit model. We extrapolated the total keV observed luminosity of the source during the NuSTAR observation, corresponding to ergs/s assuming a distance to the source of 3.5 kpc (Galloway & Cumming 2006).
| DISKLINE | RELXILLCP | ||
| Component | Parameter | NuSTAR | NuSTAR |
| ( keV) | ( keV) | ||
| phabs | ( cm-2) | (fixed) | (fixed) |
| bbody | (keV) | ||
| bbody | LBB () | ||
| bbody | RBB (km) | ||
| nthComp | (keV) | ||
| nthComp | |||
| nthComp | (keV) | ||
| nthComp | Flux ( ergs cm-2 s-1) | ||
| diskline | (keV) | ||
| diskline | ( ph cm-2 s-1) | ||
| diskline | (eV) | ||
| Smearing | |||
| Smearing | () | ||
| Smearing | () | (INDEF) | |
| Smearing | Incl (deg) | ||
| RelxillCp | Refl Frac | ||
| RelxillCp | Fe abund | (fixed) | |
| RelxillCp | |||
| RelxillCp | Norm () | ||
| total | Flux ( ergs cm-2 s-1) | ||
| total | (dof) |
3.2 The XMM-Newton spectrum
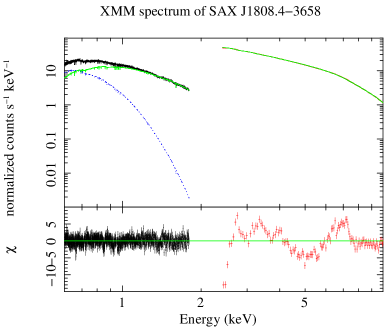
In order to check the results obtained from the NuSTAR spectrum, we have fitted separately the XMM-Newton spectra (RGS and pn, energy range keV), using the same continuum model. Again, fitting only the continuum results in an unacceptable fit, with , and clear residuals are present at the iron line energy and lower energies, at keV, keV, and keV (see Fig. 2, right panel). These low-energy residuals are similar to those observed in other bright LMXBs of the atoll class in the soft state, as 4U 1705-44 (see e.g. Di Salvo et al. 2009; Egron et al. 2013) or GX 3+1 (e.g. Piraino et al. 2012; Pintore et al. 2015). We therefore added to the continuum model four diskline components to fit the iron line and the other low energy features. The smearing parameters of the diskline fitting the low-energy lines were fixed to be the same of those of the diskline fitting the iron line. In this way we get a significative improvement of the fit, corresponding to . The best fit parameters of this fit are reported in Table 2, and in Figure 3 (left panel) we show the XMM-Newton spectrum, the best-fit model, and the residuals in units of with respect to the best-fit model.
Note that the electron temperature of the Comptonization component is much lower with respect to that measured with NuSTAR four days later, indicating that SAX J1808.4–3658 could have been in a soft state at the time of the XMM-Newton observation, in agreement with the presence of ionized discrete features in the spectrum. Note also that the XMM-Newton observation was acquired at the peak of the outburst and this is the first time that the SAX J1808.4–3658 spectrum has been observed with good energy resolution at the peak of an outburst. Substituting the diskline used for the iron line with the reflection model relxillCp, keeping the smearing parameters fixed to the corresponding smearing parameters of the other, low-energy disklines, returns a , that is slightly worse than before (), but with one extra degree of freedom. All the best-fit parameters are consistent within the errors with the best-fit values of the previous fit with disklines. As regards the reflection parameters, we fixed the iron abundance to 2, as in the case of the NuSTAR spectrum, the reflection fraction is compatible to that obtained with NuSTAR, although with a larger uncertainty, while the ionization parameter results to be much higher, , in agreement with the presence of features from highly ionized elements in the XMM-Newton spectrum. The best fit parameters of this fit are reported in Table 2. Note that some residuals are still present at keV, this is also visible in Figure 3. To fit these residuals we tried to add a Gaussian emission line at that energy, obtaining a ; the improvement of the fit is barely significant, corresponding to an F-test probability of chance improvement of . We also tried to fit the iron abundance obtaining a preference for an overabundance, , but without a statistically significant improvement of the fit (F-test probability of chance improvement for the addition of one parameter).
3.3 Combined analysis of the NuSTAR and XMM-Newton spectra
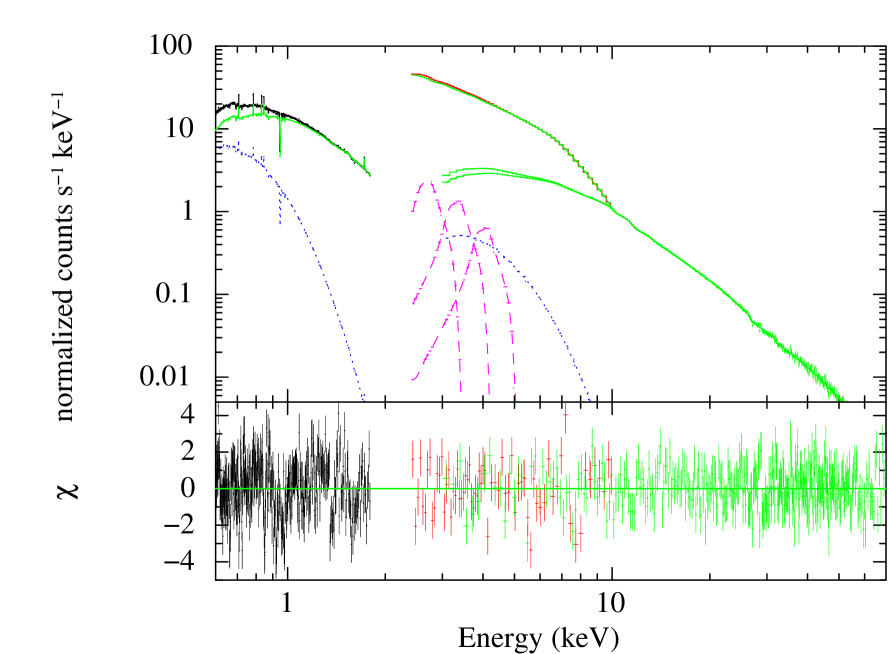
In order to increase the statistics at the iron line energy and for the whole reflection component, we tried to fit together the NuSTAR and XMM-Newton spectra, using the best-fit models obtained above. The two observations are not perfectly simultaneous, the NuSTAR observation being performed four days after the XMM-Newton observation taken at the peak of the outburst. Both the best fit continuum emission and the emission lines are very different between the two spectra. We therefore left most of the parameters free to vary between the two spectra and only few parameters were constrained to assume the same value for the two spectra; these are the equivalent hydrogen column density, of the interstellar absorption, all the parameters of the smearing component and the iron abundance. Both the ionization parameter of the reflection component and the reflection fraction were quite different between the XMM-Newton and NuSTAR spectra (cf. Table 1 and Table 2) and therefore we let these parameters free to vary between the two spectra. The low-energy disklines are not required by the NuSTAR spectrum and hence are not included in the fit of the NuSTAR spectrum. Again, letting the iron abundance free to vary (but forced to assume the same value for the two spectra) we find an improvement of the fit, corresponding to a (corresponding to an F-test probability of chance improvement of for the addition of one parameter). The best-fit value was , while all the other parameters did not change significantly. However, we could not determine the error on this parameter, and therefore we preferred to keep the iron abundance fixed to two times the Solar value. In Table 2 (last column) we report the best-fit parameters obtained for this fit. In Figure 4 we show the XMM-Newton and NuSTAR spectra together with the best fit model and residuals in units of sigma with respect to this model.
| DISKLINE | RELXILLCP | RELXILLCP | |||
| Component | Parameter | XMM-Newton | XMM-Newton | XMM-Newton | NuSTAR |
| ( keV) | ( keV) | ( keV) | |||
| phabs | ( cm-2) | ||||
| bbody | (keV) | ||||
| bbody | LBB () | ||||
| bbody | RBB (km) | ||||
| nthComp | (keV) | ||||
| nthComp | |||||
| nthComp | (keV) | ||||
| nthComp | Flux ( ergs cm-2 s-1) | ||||
| diskline | (keV) | ||||
| diskline | ( ph cm-2 s-1) | ||||
| diskline | (eV) | ||||
| diskline | (keV) | ||||
| diskline | ( ph cm-2 s-1) | ||||
| diskline | (eV) | ||||
| diskline | (keV) | ||||
| diskline | ( ph cm-2 s-1) | ||||
| diskline | (eV) | ||||
| diskline | (keV) | ||||
| diskline | ( ph cm-2 s-1) | ||||
| diskline | (eV) | ||||
| Smearing | |||||
| Smearing | () | ||||
| Smearing | () | ||||
| Smearing | Incl (deg) | ||||
| RelxillCp | Refl Frac | ||||
| RelxillCp | Fe abund | (fixed) | (fixed) | ||
| RelxillCp | |||||
| RelxillCp | Norm () | ||||
| total | Flux ( ergs cm-2 s-1) | ||||
| total | (dof) | ||||
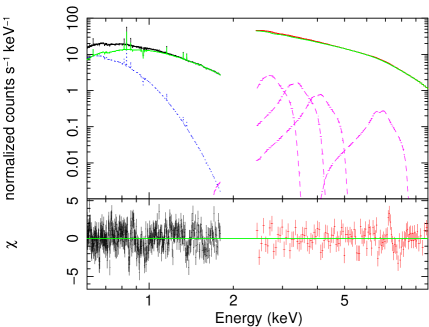
Form visual inspection of Fig. 3 and 4 some residuals are still evident in the XMM-Newton RGS (at , and keV) and pn spectra (at keV). In order to fit these residuals we tentatively add to the previous model three (Gaussian) absorption lines and an edge. The edge has a best-fit energy of keV and may be associated to mildly ionized iron (Fe V-XV). The centroid energies of the three absorption lines are 0.947 keV (possibly from Ne IX, resonance transition rest-frame energy 0.922 keV), 1.372 keV (possibly from Mg XI, resonance transition rest-frame energy 1.352 keV) and 1.596 keV, respectively. The latter is remarkably close to the resonant line of Al XII (rest-frame 1.598 keV). Note, however, that this element has a low cosmic abundance ( in number of atoms with respect to H) and that this line has a significance of about ; there is the possibility that this line is of instrumental origin, and we prefer not to discuss it further.
The first two absorption lines appear, instead, relatively broad ( keV and keV, respectively), corresponding to velocity dispersion of and of the velocity of light, respectively. If our identification of the first two absorption lines is correct, than their energies appear to be blue-shifted with respect the corresponding rest-frame energies of keV and keV, respectively, corresponding to a velocity of and of the speed of light, possibly indicating the presence of an outflowing, weakly relativistic wind. Note that, if the iron edge, that we detect at keV, is indeed a blue-shifted neutral iron edge (rest-frame energy 7.112 keV), than it would correspond to a velocity of .
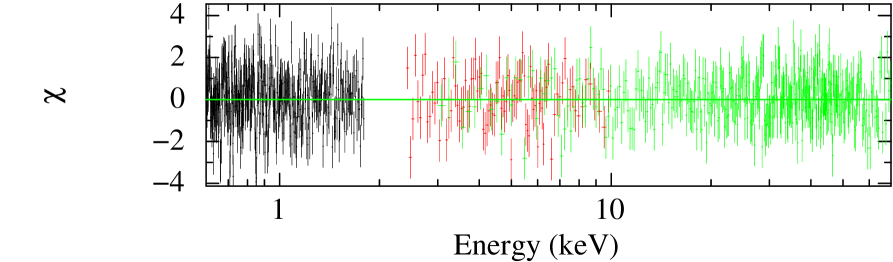
The addition of these components improved the quality of the fit, returning a , implying a decrease by for the addition of 12 parameters with respect to the previous best-fit. In this last fit, we decided to fix the outer disk radius at 1000 Rg and the iron abundance at 2 times the Solar value, and to include the low-energy disklines also in the fitting of the NuSTAR spectrum. The line at keV is indeed below the energy band used for the NuSTAR spectrum and therefore it was not included. The other two disklines were included with all the parameters fixed to those of the XMM-Newton spectrum, except for the normalization that was left free to vary. We find that the line at 3.3 keV is indeed not necessary in the NuSTAR spectrum, with an upper limits on its equivalent width of keV, while the addition of the line at keV in the NuSTAR spectrum is significant at confidence level. All the other parameters are very similar (compatible within the associated errors) to those of the previous best-fit; the most significant difference is in the ionization parameter of the NuSTAR spectrum for which we only get an upper limit of , in agreement with the centroid energy of the iron line at keV. The results of this fit are shown in Table 3, and the residuals with respect to the best fit model are shown in the bottom panel of Fig. 4.
| RELXILLCP | |||
| Component | Parameter | XMM-Newton | NuSTAR |
| ( keV) | |||
| phabs | ( cm-2) | ||
| edge | (keV) | ||
| edge | () | ||
| gauss | (keV) | ||
| gauss | (keV) | ||
| gauss | ( ph cm-2 s-1) | ||
| gauss | (eV) | ||
| gauss | (keV) | ||
| gauss | (keV) | ||
| gauss | ( ph cm-2 s-1) | ||
| gauss | (eV) | ||
| gauss | (keV) | ||
| gauss | (keV) | ||
| gauss | ( ph cm-2 s-1) | ||
| gauss | (eV) | ||
| diskline | (keV) | ||
| diskline | ( ph cm-2 s-1) | ||
| diskline | (eV) | ||
| diskline | (keV) | ||
| diskline | ( ph cm-2 s-1) | ||
| diskline | (eV) | ||
| diskline | (keV) | ||
| diskline | ( ph cm-2 s-1) | ||
| diskline | (eV) | ||
| Smearing | |||
| Smearing | () | ||
| Smearing | () | (fixed) | |
| Smearing | Incl (deg) | ||
| bbody | (keV) | ||
| bbody | LBB () | ||
| bbody | RBB (km) | ||
| nthComp | |||
| nthComp | (keV) | ||
| RelxillCp | Refl Frac | ||
| RelxillCp | Fe abund | (fixed) | |
| RelxillCp | |||
| RelxillCp | Norm () | ||
| total | (dof) | ||
4 Discussion
In this paper we have analyzed broad-band X-ray spectra acquired during the 2015 outburst of the AMSP SAX J1808.4–3658 observed by XMM-Newton and NuSTAR. The XMM-Newton ToO was performed at the peak of the outburst on 2015 April 11 for a total observing time of 110 ks, which resulted in an effective on-source exposure of ks. The NuSTAR observation was performed approximately four days later, on 2015 April 15, and resulted in 49 ks of exposure per each of the NuSTAR modules. In this way, we have obtained a broad-band (from 0.6 to 70 keV), moderately high-resolution spectrum of the source.
4.1 Comparison with previous spectral results
SAX J1808.4–3658 has been previously observed with good energy resolution by XMM-Newton and Suzaku, approximately 1 day apart, during the 2008 outburst. In that occasion, a broad iron line was detected in both the XMM-Newton and Suzaku spectra, with very similar profiles, and was fitted by a diskline (see P09, Cackett et al. 2009). The inner disk radius derived in this way was R Rg using XMM-Newton (P09) and R Rg from a joint fit of the XMM-Newton and Suzaku spectra (Cackett et al. 2009), respectively. In both cases, the inner disk radius was consistent with being inside the co-rotation radius, which is the radius at which the magnetosphere rotation velocity equals that of an assumed Keplerian disc, R, where is the NS mass and its spin angular velocity. For the case of SAX J1808.4–3658, the co-rotation radius is R km, where is the NS mass in units of . This has to be compared with the inner disk radius inferred from the reflection component, that is R km (at confidence level, P09). This is thought to be a necessary condition in order to observe coherent pulsations in accreting pulsars and to avoid efficient propeller ejection of matter due to the centrifugal barrier (according to the standard theory of accretion onto fast rotators, see e.g. Ghosh & Lamb 1979). Assuming that the inner disk (as measured by the Fe line) is truncated at the magnetospheric radius this implies a magnetic field strength of Gauss at the magnetic poles (Cackett et al. 2009). Interestingly, this estimate is consistent with other independent estimates of the magnetic field strength in this source based on completely different arguments (see e.g. Di Salvo & Burderi 2003; Burderi et al. 2003, 2006; Sanna et al. 2017, and references therein). Also, both the XMM-Newton and Suzaku spectra gave a low ionization state of iron, inferred from the line centroid always consistent with 6.4 keV (corresponding to the rest-frame energy of the K transition of neutral or moderately ionized iron), and a high inclination angle of the system with respect to the line of sight, always above .
Our analysis of the XMM-Newton and NuSTAR spectra of SAX J1808.4–3658 during the 2015 outburst gave remarkably similar results as regards the smearing parameters, both when fitting the iron line profile with a diskline and when using a self-consistent reflection model. These results are also very similar to those obtained for the 2008 XMM-Newton observation (P09). To show the agreement between these results we report in Table 4 the results obtained by P09 from the XMM-Newton observation performed in 2008 and our results from the NuSTAR spectrum obtained in 2015 when fitting the line profile with a diskline. Again we find a low ionization parameter, a large inclination angle (), and a small inner disk radius (less than 7 Rg, corresponding to R km). Even when we fit together the XMM-Newton and NuSTAR spectra with a self-consistent reflection model, we get disk parameters very similar to those obtained with the simple diskline. In particular for the NuSTAR spectrum, the ionization parameter, , is less than 2.7, the emissivity index of the disk is around 2 (compatible with the presence of a central illuminating source), the inclination angle is quite high, deg, and the inner disk radius is constrained between (best estimate) 7.5 and 11.5 Rg, corresponding to km for a 1.4 M⊙ NS, well within the co-rotation radius. Note that, despite the fact that the spectrum is typical of a hard state, the inner disk radius is quite close to the NS surface, implying that the disk is truncated not too far from the compact object in the hard state. This is also observed in other NS/LMXBs in the hard state (see Di Salvo et al. 2015, and references therein) and, as noted above, is a necessary condition to avoid a strong propeller effect in the case of a pulsar.
| Parameter | XMM-Newton (2008) | NuSTAR (2015) | XMM-Newton (2015) |
|---|---|---|---|
| (keV) | |||
| () | |||
| () | |||
| Incl (deg) | |||
| EqW (eV) | |||
| Bol (erg/s) |
A small inner disk radius is also implied for most of the other AMSPs for which a spectral analysis has been performed and a broad iron line has been detected in moderately high resolution spectra. The AMSP IGR J17511-3057, observed by XMM-Newton for 70 ks and RXTE (Papitto et al. 2010), shows both a broad iron line and the Compton hump at keV. In this case, the inner disc radius was at km for a NS, with an inclination angle between and (see also Papitto et al. 2016). The AMSP and transitional pulsar IGR J18245-2452 observed by XMM-Newton (Papitto et al. 2013), showed a broad iron line at 6.7 keV (identified as K emission from Fe XXV) with a width of keV, corresponding to R Rg or km for a NS. For comparison, the inner disk radius derived from the blackbody component was km. The (intermittent) AMSP HETE J1900-2455, observed by XMM-Newton for ks (Papitto et al. 2013), showed a broad iron line at 6.6 keV (Fe XXIII-XXV) and an intense and broad line at keV, visible both in the pn and in the RGS spectrum, compatible with being produced in the same disk region. In this case, the inner disc radius was , with an inclination angle between and . The (intermittent) AMSP SAX J1748.9-2021, observed by XMM-Newton for ks and INTEGRAL (Pintore et al. 2016), was caught at a relatively high luminosity of erg/s corresponding to of the Eddington limit for a NS, and, exceptionally for an AMSP, showed a spectrum compatible with a soft state. The broad-band spectrum is in fact dominated by a cold thermal Comptonization component ( keV) and shows an additional hard X-ray emission described by a power-law (photon index ), typically detected in LMXBs in the soft state (see e.g. Di Salvo et al. 2000). In addition, a number of broad (Gaussian keV) emission features, likely associated to reflection processes, have been observed in the XMM-Newton spectrum. A broad iron line was observed at an energy of keV, consistent with a Fe XXV K transition produced in the disc at a distance of ( km) with an inclination angle of . The other broad emission lines may be associated to K-shell emission of highly ionized elements, and are compatible with coming from the same emission region as the iron line. A moderately broad, neutral Fe emission line has been observed during the 2015 outburst of IGR J00291+5934 observed by XMM-Newton and NuSTAR (Sanna et al. 2016). Fitted with a Gaussian profile the line centroid was at an energy of keV with a eV, while using a diskline profile, the line parameters were poorly constrained. Finally, the newly discovered AMSP MAXI J0911-655, observed by XMM-Newton and NuSTAR (Sanna et al. 2016), shows the presence of a weak, marginally significant and relatively narrow emission line in the range keV, modelled with a gaussian profile with ranging between 0.02 and 0.2 keV, which was identified with K emission from moderate to highly ionized iron.
4.2 Detailed discussion of the NuSTAR and XMM-Newton spectra: similarities and differences
The use of a self-consistent reflection model instead of a diskline for the NuSTAR spectrum of SAX J1808.4–3658 gives an improvement of the fit (corresponding to a with one parameter less). This demonstrate that the Compton hump is significantly detected in the spectrum and that the line profile parameters are in good agreement with those needed to fit the whole reflection component. The best-fit results strongly suggest a moderate overabundance of iron by approximately a factor between 2 and 3. However, this overabundance may be indicative of a disk density higher than the value of cm-3 assumed in the relxill model. Indeed, García et al. (2016) have shown that the iron abundance is sensitive to the density used in calculating the reflection model, and that when assuming a higher-density disk a lower iron abundance is obtained (see also García et al. 2018, and references therein). Hence, this overabundance should be confirmed using appropriate reflection models in which the density in the disk can be varied. There are versions of the relxill model which allow to vary the disk density, although at the moment these models have a high energy cutoff of the illuminating continuum fixed to 300 keV, that is much higher than the temperature of the Comptonization continuum we find in the spectrum of SAX J1808.4–3658.
We have also fitted the value of the outer radius of the emitting region in the disk; this parameter should be always let free to vary in high statistics spectra, since it strongly correlates with the inclination angle of the system and fixing this parameter may result in an artificially narrow uncertainty for the inclination angle. In all our fitting, the value of the outer radius of the emitting region in the disk, was quite undetermined, although compatible (within the large uncertainties) with the value derived by P09 during the 2008 outburst (). Usually in other bright LMXBs, when it is possible to let this parameter free, the best fit value is most of the times very high, above (see e.g. Di Salvo et al. 2009; Iaria et al. 2009), as it should be expected if the entire disk is illuminated and emits a reprocessed spectrum. However, SAX J1808.4–3658 is a transient with short outbursts, and therefore during the outburst at least the innermost part of the disk is emptying in few days. This means that the disc, over which reflection takes place, may have a ring-like shape with an outer disk radius which is relatively close to the inner disc radius. Therefore, it is possible that the small outer disk radius inferred from the reflection component in SAX J1808.4–3658 during the 2008 outburst may be an indication that the accretion disk was already emptying or that some disk parameters may change abruptly towards the outer disk in short-duration outbursts. Unfortunately, we were not able confirm this result with these observations. Future observations at high energy resolution and high statistics (perhaps taken during the decay phase of the outburst) might be able to confirm this finding which may give important information on the evolution of the accretion disk in this kind of transients.
The best-fit continuum model that we find for the NuSTAR spectrum of SAX J1808.4–3658 is also very similar to that already used by P09 to fit the XMM-Newton spectrum during the 2008 outburst, with the difference that P09 used two soft components, a blackbody (at a temperature kT keV) and a multicolor disk blackbody (at kT keV), and a power-law to fit the Comptonization component, while we use a blackbody and a Comptonization model that include a soft (Wien spectrum) component as a seed photon. In our fit, the seed photon temperature for Comptonization (kT keV) is comparable to the disk blackbody temperature in the P09 deconvolution, possibly indicating that both the disk and the NS contribute to the seed photons for Comptonization. The 2015 NuSTAR spectrum also requires a blackbody component with a temperature of keV, slightly higher than the blackbody temperature reported by P09, and a spherical radius of the emitting region of km, a factor lower than the blackbody radius reported by P09. The value of the equivalent hydrogen column to the source is very precisely determined by the XMM-Newton spectrum, cm-2, and is slightly lower than that derived by P09 during the 2008 outburst.
On the other hand the XMM-Newton spectrum of SAX J1808.4–3658 taken in 2015 looks quite different from the 2015 NuSTAR spectrum and the 2008 XMM-Newton spectrum of the source. The blackbody component is found at a low temperature, keV, very close to the seed photon temperature ( keV), and the corresponding radius of the blackbody emitting region, assuming a spherical geometry and not considering color corrections, results to be km, much larger than the inner radius inferred from reflection features (cf. Tab. 2). The Comptonization spectrum appears much softer, with an electron temperature around keV. Moreover, several emission lines are observed in the XMM-Newton spectrum, identified with transitions of highly ionized (He-like or H-like) elements (S XVI rest-frame energy keV, Ar XVIII rest-frame energy keV, Ca XIXXX rest-frame energy and keV, respectively, and Fe XXV rest-frame energy keV). The smearing parameters of these lines are compatible to be the same, and appear very similar to what we find for the smearing parameters of the NuSTAR spectrum (emissivity index -, inner radius Rg, outer radius Rg, inclination deg). When we try to fit the reflection component (Fe line and Compton hump) with the self-consistent reflection model relxill we find parameters very similar to those obtained for the NuSTAR spectrum, except for a high value of the ionization parameter (), in agreement with the high energies of the emission lines, which would require . Most probably the XMM-Newton spectrum of SAX J1808.4–3658 taken in 2015 corresponds to a transition spectrum, in line with the fact that the XMM-Newton observation was taken at the very beginning of the outburst, that evolved to the more standard NuSTAR spectrum a few days after. If this is the case, SAX J1808.4–3658 experienced a soft to hard transition at the beginning of the outburst, that has never been observed before for an AMSP. Note that a spectral transition has been observed for the 11 Hz X-ray pulsar IGR J17480-2446 in the globular cluster Terzan 5 during its X-ray outburst in 2010 (Papitto et al. 2012). However, in that case, a hard to soft state transition was observed during the outburst rise. Unfortunately, the lack of high-energy coverage strictly simultaneous to the XMM-Newton observation of SAX J1808.4–3658 does not allow us to put further constraints on the high-energy spectrum, or to look for the presence of hard continuum components or a complex reflection component.
4.3 Binary inclination and mass of the neutron star
As stated above, despite the differences between the XMM-Newton and NuSTAR spectra we find quite similar values for the parameters of the reflection component and relativistic smearing. We therefore tried to fit simultaneously these spectra in order to increase the statistics of the reflection features and improve the constraints on the corresponding best-fit parameters. We therefore let free to vary all the parameters of the continuum emission, except for the , that was not constrained in the NuSTAR spectrum alone, and tied together the parameters of the relativistic smearing, with the iron abundance fixed at 2 times the Solar value. Fitting the XMM-Newton and NuSTAR spectra together, we could get a precise estimate of the inner disk radius, which is constrained between 7.5 and 11.5 , while the best estimate of the system inclination, constrained between and , comes from the fitting with relxillCp of the XMM-Newton spectrum (see Tab. 2).
We also find evidence in the XMM-Newton spectrum of the presence of some absorption discrete features (see Tab. 3), namely an absorption edge at keV from neutral or mildly ionized iron and at least two absorption lines, possibly from transitions of highly ionized (He-like) Ne IX (at 0.947 keV) and Mg XI (at 1.372 keV). These lines appear relatively broad (implying a velocity dispersion of ) and blue-shifted at a velocity a few percent the speed of light. If confirmed, these lines may suggest the presence of a weakly relativistic outflowing wind towards the observer. Absorption lines from ionized elements are usually observed in high-inclination () sources (see e.g. Pintore et al. 2014, and references therein) and therefore their presence in the XMM-Newton spectrum may support the possibility of a high inclination, , in SAX J1808.4–3658.
This estimate is compatible with previous estimates based on the fitting of the iron line profile during the 2008 outburst observed by XMM-Newton (P09, Cackett et al. 2009), and is also consistent with the inclination of given by Ibragimov & Poutanen (2009) from a detailed analysis of the 2002 outburst from the source, as well as with the inclination range from to given by Deloye et al. (2008) studying the optical modulation along the orbital period of the system observed during a quiescence period in 2007; these authors also suggest a pulsar mass . A high inclination is qualitatively in agreement with the claim of a massive NS () and a low mass companion star, a brown dwarf with , as suggested by Bildsten & Chakrabarty (2001) (see also Di Salvo et al. 2008; Burderi et al. 2009). Finally, a recent estimate of the inclination angle to the system comes from a time-resolved optical imaging of SAX J1808.4-3658 during its quiescent state and 2008 outburst. A Markov chain Monte Carlo technique has been used to fit the multi-band light curve of the source in quiescence with an irradiated star model, and a tight constraint of deg has been derived on the inclination angle (Wang et al. 2013). This implies a constraint on the mass of the pulsar and its companion star, which are inferred to be and (both at confidence level), respectively.
However, high values for the inclination angle of the system look at odd when considered together with optical estimates of the radial velocity of the companion star. From phase resolved optical spectroscopy and photometry of the optical counterpart to SAX J1808.4–3658, obtained during the 2008 outburst, Elebert et al. (2009) reveals a focused spot of emission at a location consistent with the secondary star. The velocity of this emission is estimated at km/s; applying a “K-correction”, the authors estimate the velocity of the secondary star projected on to the line of sight to be km/s (see also Cornelisse et al. 2009). This estimate, coupled with a high inclination angle of the system, gives very low values for the NS mass, and has been used to argue against the presence of a heavy NS in this system. In fact, the pulsar mass can be estimated using the following relation: , where is the pulsar mass, is the mass ratio of the system, is the orbital period of the system, and is the radial velocity of the companion star of mass . Using the estimated radial velocity of the companion star together with our best-fit value for the inclination angle, we find a pulsar mass in the range: . This range of masses for a NS is unacceptable and casts serious doubts on the estimates of the radial velocity of the companion and/or on a high inclination angle for the system.
A possibility we can imagine is that the reflection is measuring the inclination with respect to the sight of the inner part of the accretion disk, that may be different from the binary inclination. If the inner accretion disk is tilted with respect to the orbital plane, for instance because of the action of the NS magnetic field, such that the inner disk is observed at high inclination, than this could explain why measured inclination of the inner disk can be different from the binary inclination. However, this would not explain the high inclination angle measured by Wang et al. (2013) during X-ray quiescence.
The other possibility is that the problem comes from measurements of the companion radial velocity. Note that the reported measurements of the radial velocity are still affected by large uncertainties. This is because these measurements are taken during X-ray outburst and are affected by the presence of the accretion disk and the strong irradiation of the companion star. These estimates should therefore be confirmed in order to obtain a reliable estimate of the NS mass.
5 Conclusions
In summary, we have reported a detailed spectral analysis of the XMM-Newton and NuSTAR spectra of SAX J1808.4–3658 during the latest outburst in 2015. The main results of this study are described in the following. The XMM-Newton spectrum, taken for the first time at the beginning of the outburst, appears to be much softer than what is usually found for this source and quite puzzling, while the broad-band NuSTAR spectrum, acquired a few days after, gives results perfectly compatible with those found from the XMM-Newton observation performed in 2008. Despite the differences present between the XMM-Newton and NuSTAR spectra taken in 2015, we could fit simultaneously the smeared reflection component in these spectra. In particular, we find that the reflection component requires a ionization parameter of for the NuSTAR spectrum and a higher value, for the XMM-Newton spectrum, and strong evidence of an overabundance of iron by a factor two with respect to the solar abundance, although this may be due to a relatively high density in the disk. Also, the smearing parameters are very similar to those found with XMM-Newton during the 2008 outburst. The emissivity index of the disc is , consistent with a dominating illuminating central source, and we find that the upper limit to the inner disk radius is , compatible with an inner disk radius smaller than the corotation radius. We also give a precise measure of the inclination angle of the system, which results around , in agreement with previous spectral results, as well as with the results of fitting the reflection component in each spectrum with empirical models (disklines). A high-inclination angle for this system is also supported by the presence of absorption discrete features in the XMM-Newton spectrum, although these detections should be confirmed by further spectroscopic studies. The high inclination of the system with respect to our line of sight, when combined with available measurements of the radial velocity of the optical companion, poses, however, a problem as regards the correct determination of the mass of the NS in this systems, and therefore deserves further investigation.
We thank the unknown referee for her/his suggestions that certainly improved the quality of the manuscript. We also thank Dr. Matranga for collaborating to a first draft of this paper. We acknowledge financial contribution from the agreement ASI-INAF I/037/12/0. A.P. acknowledges funding from the European Union’s Horizon 2020 Framework Programme for Research and Innovation under the Marie Sklodowska-Curie Individual Fellowship grant agreement 660657-TMSP-H2020-MSCA-IF-2014. We acknowledges support from the HERMES Project, financed by the Italian Space Agency (ASI) Agreement n. 2016/13 U.O, as well as fruitful discussion with the international team on “The disk-magnetosphere interaction around transitional millisecond pulsars” at the International Space Science Institute, Bern.
References
- Anders & Grevesse (1989) Anders E., Grevesse N., 1989, Geochimica et Cosmochimica Acta, 53, 197
- Arzoumanian et al. (1994) Arzoumanian Z., Fruchter A. S., Taylor J. H., 1994, ApJ, 426, 85
- Balucinska-Church & McCammon (1992) Balucinska-Church M., McCammon D., 1992, ApJ, 400, 699
- Barret et al. (2000) Barret D., Olive J. F., Boirin L., Done C., Skinner G. K., Grindlay J. E., 2000, ApJ, 533, 329
- Bildsten (1998) Bildsten L., 1998, ApJ, 501, L89
- Bildsten & Chakrabarty (2001) Bildsten L., Chakrabarty D., 2001, ApJ, 557, 292
- Burderi et al. (2003) Burderi L., Di Salvo T., D’Antona F., Robba N. R., Testa V., 2003, A&A, 404, L43
- Burderi et al. (2006) Burderi L., Di Salvo T., Menna M. T., Riggio A., Papitto A., 2006, ApJ, 653, L133
- Burderi et al. (2001) Burderi L., Possenti A., D’Antona F., Di Salvo T., Burgay M., Stella L., Menna M. T., Iaria R., Campana S., d’Amico N., 2001, ApJ, 560, L71
- Burderi et al. (2009) Burderi L., Riggio A., di Salvo T., Papitto A., Menna M. T., D’Aì A., Iaria R., 2009, A&A, 496, L17
- Cackett et al. (2009) Cackett E. M., Altamirano D., Patruno A., Miller J. M., Reynolds M., Linares M., Wijnands R., 2009, ApJ, 694, L21
- Cackett & Miller (2013) Cackett E. M., Miller J. M., 2013, ApJ, 777, 47
- Cackett et al. (2010) Cackett E. M., Miller J. M., Ballantyne D. R., Barret D., Bhattacharyya S., Boutelier M., Miller M. C., Strohmayer T. E., Wijnands R., 2010, ApJ, 720, 205
- Cackett et al. (2012) Cackett E. M., Miller J. M., Reis R. C., Fabian A. C., Barret D., 2012, ApJ, 755, 27
- Campana & Di Salvo (2018) Campana S., Di Salvo T., 2018, ArXiv e-prints
- Cornelisse et al. (2009) Cornelisse R., D’Avanzo P., Muñoz-Darias T., Campana S., Casares J., Charles P. A., Steeghs D., Israel G., Stella L., 2009, A&A, 495, L1
- D’Aì et al. (2010) D’Aì A., di Salvo T., Ballantyne D., Iaria R., Robba N. R., Papitto A., Riggio A., Burderi L., Piraino S., Santangelo A., Matt G., Dovčiak M., Karas V., 2010, A&A, 516, A36
- Dauser et al. (2016) Dauser T., García J., Walton D. J., Eikmann W., Kallman T., McClintock J., Wilms J., 2016, A&A, 590, A76
- Degenaar et al. (2015) Degenaar N., Miller J. M., Chakrabarty D., Harrison F. A., Kara E., Fabian A. C., 2015, MNRAS, 451, L85
- Deloye et al. (2008) Deloye C. J., Heinke C. O., Taam R. E., Jonker P. G., 2008, MNRAS, 391, 1619
- Di Salvo & Burderi (2003) Di Salvo T., Burderi L., 2003, A&A, 397, 723
- Di Salvo et al. (2008) Di Salvo T., Burderi L., Riggio A., Papitto A., Menna M. T., 2008, MNRAS, 389, 1851
- Di Salvo et al. (2009) Di Salvo T., D’Aí A., Iaria R., Burderi L., Dovčiak M., Karas V., Matt G., Papitto A., Piraino S., Riggio A., Robba N. R., Santangelo A., 2009, MNRAS, 398, 2022
- Di Salvo et al. (2015) Di Salvo T., Iaria R., Matranga M., Burderi L., D’Aí A., Egron E., Papitto A., Riggio A., Robba N. R., Ueda Y., 2015, MNRAS, 449, 2794
- Di Salvo et al. (2000) Di Salvo T., Stella L., Robba N. R., van der Klis M., Burderi L., Israel G. L., Homan J., Campana S., Frontera F., Parmar A. N., 2000, ApJ, 544, L119
- Egron et al. (2013) Egron E., Di Salvo T., Motta S., Burderi L., Papitto A., Duro R., D’Aì A., Riggio A., Belloni T., Iaria R., Robba N. R., Piraino S., Santangelo A., 2013, A&A, 550, A5
- Elebert et al. (2009) Elebert P., Reynolds M. T., Callanan P. J., Hurley D. J., Ramsay G., Lewis F., Russell D. M., Nord B., Kane S. R., Depoy D. L., Hakala P., 2009, MNRAS, 395, 884
- Fabian (2005) Fabian A. C., 2005, APSS, 300, 97
- Fabian et al. (2000) Fabian A. C., Iwasawa K., Reynolds C. S., Young A. J., 2000, PASP, 112, 1145
- Fabian et al. (1989) Fabian A. C., Rees M. J., Stella L., White N. E., 1989, MNRAS, 238, 729
- Fiocchi et al. (2007) Fiocchi M., Bazzano A., Ubertini P., Zdziarski A. A., 2007, ApJ, 657, 448
- Galloway & Cumming (2006) Galloway D. K., Cumming A., 2006, ApJ, 652, 559
- García et al. (2014) García J., Dauser T., Lohfink A., Kallman T. R., Steiner J. F., McClintock J. E., Brenneman L., Wilms J., Eikmann W., Reynolds C. S., Tombesi F., 2014, ApJ, 782, 76
- García et al. (2016) García J. A., Fabian A. C., Kallman T. R., Dauser T., Parker M. L., McClintock J. E., Steiner J. F., Wilms J., 2016, MNRAS, 462, 751
- García et al. (2018) García J. A., Kallman T. R., Bautista M., Mendoza C., Deprince J., Palmeri P., Quinet P., 2018, in Astronomical Society of the Pacific Conference Series Vol. 515 of Astronomical Society of the Pacific Conference Series, The Problem of the High Iron Abundance in Accretion Disks around Black Holes. p. 282
- Ghosh & Lamb (1979) Ghosh P., Lamb F. K., 1979, ApJ, 232, 259
- Gierliński et al. (2002) Gierliński M., Done C., Barret D., 2002, MNRAS, 331, 141
- Hartman et al. (2009) Hartman J. M., Patruno A., Chakrabarty D., Markwardt C. B., Morgan E. H., van der Klis M., Wijnands R., 2009, ApJ, 702, 1673
- Iaria et al. (2009) Iaria R., D’Aí A., di Salvo T., Robba N. R., Riggio A., Papitto A., Burderi L., 2009, A&A, 505, 1143
- Ibragimov & Poutanen (2009) Ibragimov A., Poutanen J., 2009, MNRAS, 400, 492
- King et al. (2016) King A. L., Tomsick J. A., Miller J. M., Chenevez J., Barret D., Boggs S. E., Chakrabarty D., Christensen F. E., Craig W. W., Fürst F., Hailey C. J., Harrison F. A., Parker M. L., Stern D., Romano P., Walton D. J., Zhang W. W., 2016, ApJ, 819, L29
- Ludlam et al. (2017) Ludlam R. M., Miller J. M., Bachetti M., Barret D., Bostrom A. C., Cackett E. M., Degenaar N., Di Salvo T., Natalucci L., Tomsick J. A., Paerels F., Parker M. L., 2017, ApJ, 836, 140
- Matranga et al. (2017) Matranga M., Di Salvo T., Iaria R., Gambino A. F., Burderi L., Riggio A., Sanna A., 2017, A&A, 600, A24
- Miller et al. (2010) Miller J. M., D’Aì A., Bautz M. W., Bhattacharyya S., Burrows D. N., Cackett E. M., Fabian A. C., Freyberg M. J., Haberl F., Kennea J., Nowak M. A., Reis R. C., Strohmayer T. E., Tsujimoto M., 2010, ApJ, 724, 1441
- Miller et al. (2004) Miller J. M., Fabian A. C., Reynolds C. S., Nowak M. A., Homan J., Freyberg M. J., Ehle M., Belloni T., Wijnands R., van der Klis M., Charles P. A., Lewin W. H. G., 2004, ApJ, 606, L131
- Miller et al. (2013) Miller J. M., Parker M. L., Fuerst F., Bachetti M., Barret D., et al. 2013, ApJ, 779, L2
- Ng et al. (2010) Ng C., Díaz Trigo M., Cadolle Bel M., Migliari S., 2010, A&A, 522, A96
- Papitto et al. (2016) Papitto A., Bozzo E., Sanchez-Fernandez C., Romano P., Torres D. F., Ferrigno C., Kajava J. J. E., Kuulkers E., 2016, A&A, 596, A71
- Papitto et al. (2013) Papitto A., D’Aì A., Di Salvo T., Egron E., Bozzo E., Burderi L., Iaria R., Riggio A., Menna M. T., 2013, MNRAS, 429, 3411
- Papitto et al. (2012) Papitto A., Di Salvo T., Burderi L., Belloni T. M., Stella L., Bozzo E., D’Aì A., Ferrigno C., Iaria R., Motta S., Riggio A., Tramacere A., 2012, MNRAS, 423, 1178
- Papitto et al. (2009) Papitto A., Di Salvo T., D’Aì A., Iaria R., Burderi L., Riggio A., Menna M. T., Robba N. R., 2009, A&A, 493, L39
- Papitto et al. (2013) Papitto A., Ferrigno C., Bozzo E., Rea N., Pavan L., Burderi L., Burgay M., Campana S., di Salvo T., Falanga M., Filipović M. D., et al. 2013, Nature, 501, 517
- Papitto et al. (2010) Papitto A., Riggio A., di Salvo T., Burderi L., D’Aì A., Iaria R., Bozzo E., Menna M. T., 2010, MNRAS, 407, 2575
- Patruno et al. (2012) Patruno A., Bult P., Gopakumar A., Hartman J. M., Wijnands R., van der Klis M., Chakrabarty D., 2012, ApJ, 746, L27
- Patruno & Watts (2012) Patruno A., Watts A. L., 2012, ArXiv e-prints
- Pintore et al. (2015) Pintore F., Di Salvo T., Bozzo E., Sanna A., Burderi L., D’Aì A., Riggio A., Scarano F., Iaria R., 2015, MNRAS, 450, 2016
- Pintore et al. (2016) Pintore F., Sanna A., Di Salvo T., Del Santo M., Riggio A., D’Aì A., Burderi L., Scarano F., Iaria R., 2016, MNRAS, 457, 2988
- Pintore et al. (2014) Pintore F., Sanna A., Di Salvo T., Guainazzi M., D’Aì A., Riggio A., Burderi L., Iaria R., Robba N. R., 2014, MNRAS, 445, 3745
- Piraino et al. (2007) Piraino S., Santangelo A., di Salvo T., Kaaret P., Horns D., Iaria R., Burderi L., 2007, A&A, 471, L17
- Piraino et al. (1999) Piraino S., Santangelo A., Ford E. C., Kaaret P., 1999, A&A, 349, L77
- Piraino et al. (2012) Piraino S., Santangelo A., Kaaret P., Mück B., D’Aì A., Di Salvo T., Iaria R., Robba N., Burderi L., Egron E., 2012, A&A, 542, L27
- Poutanen (2006) Poutanen J., 2006, Advances in Space Research, 38, 2697
- Sanna et al. (2018) Sanna A., Bozzo E., Papitto A., Riggio A., Ferrigno C., Di Salvo T., Iaria R., Mazzola S. M., D’Amico N., Burderi L., 2018, A&A, 616, L17
- Sanna et al. (2017) Sanna A., Di Salvo T., Burderi L., Riggio A., Pintore F., Gambino A. F., Iaria R., Tailo M., Scarano F., Papitto A., 2017, MNRAS, 471, 463
- Sanna et al. (2018) Sanna A., Ferrigno C., Ray P. S., Ducci L., Jaisawal G. K., Enoto T., Bozzo E., Altamirano D., Di Salvo T., Strohmayer T. E., Papitto A., et al. 2018, ArXiv e-prints
- Sanna et al. (2013) Sanna A., Hiemstra B., Méndez M., Altamirano D., Belloni T., Linares M., 2013, MNRAS, 432, 1144
- Sanna et al. (2016) Sanna A., Papitto A., Burderi L., Bozzo E., Riggio A., Di Salvo T., Ferrigno C., Rea N., Iaria R., 2016, ArXiv e-prints
- Sanna et al. (2016) Sanna A., Pintore F., Bozzo E., Ferrigno C., Papitto A., Riggio A., Di Salvo T., Iaria R., D’Aì A., Egron E., Burderi L., 2016, ArXiv e-prints
- Sleator et al. (2016) Sleator C. C., Tomsick J. A., King A. L., Miller J. M., Boggs S. E., Bachetti M., Barret D., Chenevez J., Christensen F. E., Craig W. W., Hailey C. J., Harrison F. A., Rahoui F., Stern D. K., Walton D. J., Zhang W. W., 2016, ApJ, 827, 134
- Titarchuk et al. (2009) Titarchuk L., Laurent P., Shaposhnikov N., 2009, ApJ, 700, 1831
- Wang et al. (2013) Wang Z., Breton R. P., Heinke C. O., Deloye C. J., Zhong J., 2013, ApJ, 765, 151
- Wijnands & van der Klis (1998) Wijnands R., van der Klis M., 1998, Nature, 394, 344
- Yoshida et al. (1993) Yoshida K., Mitsuda K., Ebisawa K., Ueda Y., Fujimoto R., et al. 1993, PASJ, 45, 605
- Życki et al. (1999) Życki P. T., Done C., Smith D. A., 1999, MNRAS, 309, 561