A consistent view of the samarium hexaboride terminations to resolve the nature of its surface states
Abstract
The research effort prompted by the prediction that could be the first topological Kondo insulator has produced a wealth of new results, though not all of these seem compatible. A major discrepancy exists between scanning tunneling microscopy / spectroscopy (STM/S) and angle-resolved photoemission spectroscopy (ARPES), because the two experimental methods suggest a very different number of terminations of the (100) surface with different properties. Here we tackle this issue in a combined STM/S and ARPES study. We find that two of the well-ordered topographies reported in earlier STM studies can be associated with the crystal terminations identified using photoemission. We further observe a reversal of the STM contrast with bias voltage for one of the topographies. We ascribe this result to a different energy dependence of Sm and B-derived states, and show that it can be used to obtain element specific images of and identify which topography belongs to which termination. We finally find STS results to support a modification of the low-energy electronic structure at the surface that has been proposed as the trivial origin of surface metallicity in this material.
I Introduction
Unlike most other topical phenomena in solid state research, the topological insulator can be understood entirely in non-interacting terms. Since the establishment of topological insulators, a lot of interest has turned to systems that combine a non-trivial topology with stronger electron correlation, as they hold the promise of phenomena such as spin-charge separated excitations Pesin and Balents (2010). Dzero and coworkers opened an important avenue to correlated topological insulators, by pointing out that Kondo insulators possess both local and itinerant states of opposite parity, and relatively strong spin-orbit interaction Dzero et al. (2010).
The proposal that could be the first topological Kondo insulator has lead to a resurgence of interest in this material [See][foraconcisereview.]Allen:2016kv. This attention has brought a number of important properties of to light that appear to support the suggestion that the material is a topological insulator: It was found that only the surface remains conductive at low temperature Wolgast et al. (2013); Kim et al. (2013), and surface states that could account for this conductivity were found at the and points of the surface Brillouin zone as predicted in the topological scenario Xu et al. (2013); Jiang et al. (2013); Li et al. (2014). In spite of this progress, today —more than eight years since the original publication— it is still unclear whether Dzero et al.’s proposal applies to . Before we can answer this fundamental question, it is necessary to resolve the most important contradictions from the various experimental techniques. A prominent example of apparent disagreement is the issue of crystal termination. A variety of surface terminations has been suggested on the basis of STM: A structure seen by several groups Yee et al. (2013); Rößler et al. (2014) was interpreted as a missing-row reconstruction, because the bulk truncated (100) surfaces are polar and the reconstruction would lift the polarity. In spite of potential issues due to polarity, seemingly unreconstructed areas have been observed as well Yee et al. (2013); Ruan et al. (2014); Rößler et al. (2014). Rößler et al. have proposed that areas can correspond to both B and Sm termination Rößler et al. (2014). Seemingly different unreconstructed topographies are also reported by Sun et al. Sun et al. (2018). Finally, apparently unstructured areas have been found to be abundant Yee et al. (2013); Ruan et al. (2014), with areas of the well-ordered topographies existing only on a small length scale Yee et al. (2013).
ARPES results, on the other hand, strongly suggest the existence of just two distinct, chemically pure terminations Hlawenka et al. (2018), with areas of a single dominant termination persisting on the scale of at least hundreds of micrometers Denlinger et al. (2014).
Here we aim at resolving this apparent contradiction by studying surfaces prepared from parts of the same crystal with STM and ARPES. STS, as a probe of the local density of states (LDOS), can further be used to test the hypothesis that termination-dependent surface shifts of the 4-like intensity near are the cause of surface conductivity in this material Hlawenka et al. (2018). The results allow us to establish a link between the well-defined STM topographies reported earlier Yee et al. (2013); Rößler et al. (2014), and the two crystal terminations seen in photoemission Denlinger et al. (2014); Hlawenka et al. (2018). While unresolved issues remain, in particular with respect to the surface structure, our work shows that the results from STM and ARPES experiments can largely be reconciled.
II Methods
STM and ARPES experiments were done on pieces from the same floating zone grown crystal. Crystal growth details have been published elsewhere Hlawenka et al. (2018). STM experiments were performed in Graz using a liquid He cooled instrument operated at a temperature of 6 K. Samples were cleaved in ultra-high vacuum at K. While this temperature is higher than that employed in earlier studies, the obtained surface structures appear to be identical. Spectra in Figs. 1(b,d) are shifted by mV to compensate a systematic offset. Tunneling spectra have been measured with a lock-in technique using a bias modulation amplitude of 5 mV.
We have approximated the experimental low-bias tunneling spectra using the description published by Maltseva et al. Maltseva, Dzero, and Coleman (2009), with meV; eV; eV. This choice of parameters yields an indirect hybridiation gap of meV. The other parameters have been adapted per topography to match the experimental results. We have used and 1 meV for the and spectra, respectively, and topography-dependent values for and , as detailed below.
Photoemission measurements were done in Berlin using the -ARPES experiment connected to the UE112-PGM2b beam-line of the BESSY II synchrotron light source. Samples are cleaved in ultra-high vacuum at temperatures below 45 K. Energy resolution is 3 meV for the measurements at eV.
III Results and discussion
III.1 Topographies
Surfaces prepared by cleaving pieces from the same ingot used in photoemission experiments presented here and in an earlier study by Hlawenka et al. Hlawenka et al. (2018), yield one of the following distinct topographies:
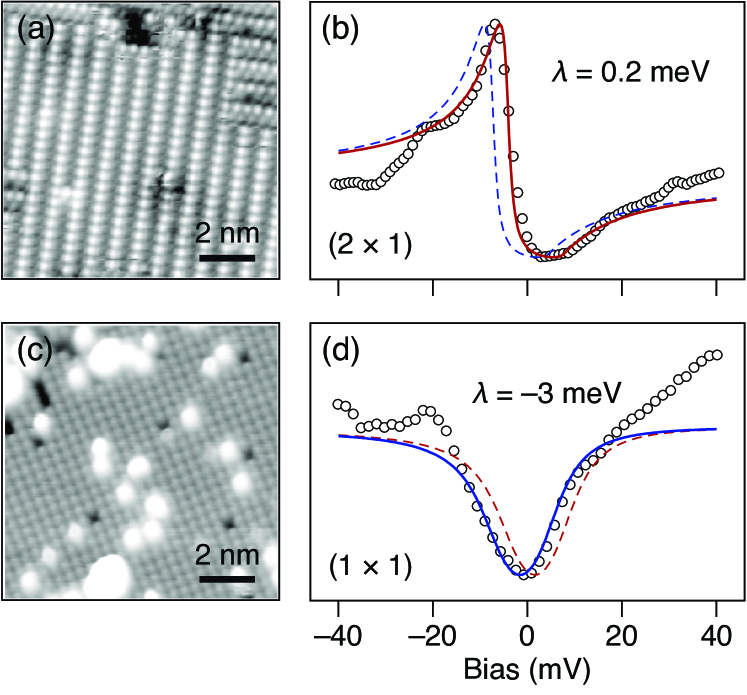
Both Yee, He et al., and Rößler et al. have observed well-ordered surface areas with very similar characteristics Yee et al. (2013); Rößler et al. (2014): A topography with spectra nearly identical to that shown in Fig. 1(b) has been reported by both groups. Both Yee et al. and Rößler et al. have also observed well-ordered unreconstructed topographies, but spectra from these areas show a larger variation: Rößler et al. have reported two kinds of spectra from topographies. One type is very similar to that in Fig. 1(d), i.e., Fano resonance-like with , while the second has a more pronounced maximum at the negative bias side Rößler et al. (2014). Yee, He et al. exclusively report tunneling spectra more similar to the second with a prominent maximum near mV on the unreconstructed areas Yee et al. (2013). In two independent sub-Kelvin studies Jiao et al. Jiao et al. (2016) and Sun et al. Sun et al. (2018) observe nearly identical (although energetically shifted) fine structure spectra obtained on unreconstructed areas.
An important departure from earlier publications is that —although we have not scanned the entirety of the cleaved areas— we only find a single topography on a given surface. In contrast, Rößler et al. have reported that unreconstructed areas are observed only rarely and the majority of the surface area shows the structure Rößler et al. (2014), while Yee and He et al. even find the majority of the surface to be disordered Yee et al. (2013). Our result appears to support the ARPES experiments done on surfaces from this crystal, where we find that only a single termination dominates the photoemission spectrum on the millimeter scale (see below). We therefore argue that the two distinct topographies presented in Fig. 1 must correspond to B and Sm termination, and will attempt to make an assignment below.
III.2 Element selective imaging
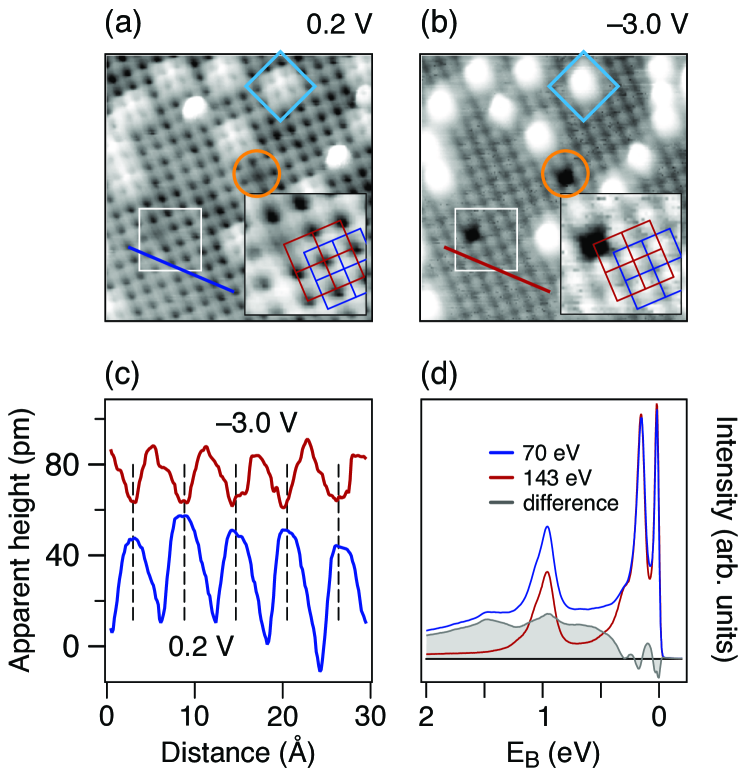
We will address one more property of the surface seen in STM that will prove important for making this assignment. We find the STM contrast on the topography to depend strongly on the bias voltage as illustrated in Fig. 2. Corrugation maxima shift by half a lattice constant depending on the bias voltage. Bias dependent results are shown in Fig. 2(a,b) along with a line profile (c) that cuts the unit cell diagonally. We attribute this effect to a different energy dependence for the density of Sm and B-derived states. In particular, band structure calculations Antonov, Harmon, and Yaresko (2002); Lu et al. (2013) reveal a several eV wide gap in the B 2 state density around , a result that is confirmed by Denlinger and coworkers who have successfully matched the calculated B 2 band structure to photoemission results Denlinger et al. (2014). Since has the CsCl crystal structure, the corrugation maximum can shift from Sm to B6 sites depending on which states dominate the tunnel current.
The phase shift of the corrugation is only seen on the unreconstructed surface, which suggests that this structure is B terminated: With the B 2 states spatially closer to the tip, the B contribution will start to dominate at bias voltages above the B 2 state density threshold ( V). We can thus assign the unreconstructed topography shown in Fig. 1(c) to B termination. Another consequence of the energy dependence of the B state density is that an absolute bias voltage larger than 1 V is required to access B 2 states and reliably image the location of B atoms.
The circles and diamonds in Figs. 2(a,b) highlight the two most common defects we find on the surface. The defect within the orange circles appears as a weak depression at low bias but becomes a much more prominent at V. Using the reasoning that led to the above assignment we conclude that this type would correspond to a defect in the surface B layer. The other type of defect highlighted with the diamond is relatively pronounced at both bias voltages. It appears at on-top sites of the low-bias lattice (and consequently in the hollow site of the high-bias, presumably B lattice). Neither of these appear to correspond to the features seen on the unreconstructed surface in the recent study by Sun and coworkers Sun et al. (2018). A possible explanation for this difference is the relatively high cleaving temperature in our experiment, which might allow for (partial) recovery of defects originating from the cleaving process.
We conclude this section by providing a further estimate of the energy dependence of B 2 state density from photoemission spectra obtained at two different photon energies, shown in Fig. 2(d). The spectrum at the lower photon energy ( eV) is comprised of signal from both B and Sm states. In the spectrum obtained by resonant excitation with a photon energy near the Sm 4 binding energy ( eV) on the other hand, any B spectral weight is overwhelmed by intensity from the Sm -orbital multiplet. The difference between both spectra, given by the filled area in Fig. 2(d), therefore provides an estimate of the possible B spectral weight. Since the intensity of the difference spectrum vanishes below a binding energy of 0.5 eV, we can again conclude there is no significant B state density in this energy window.
The element-specific energy dependence of the LDOS has not been considered in earlier studies. Rößler et al. assign topographies to structures comprised of both Sm and B atoms Rößler et al. (2014), even though the results have been obtained with a bias voltage that lies well in the B 2 band gap. Other than to assume very strong B–Sm admixture well outside the unmixed B 2 bandwidth Lu et al. (2013), we find it difficult to understand what the contrast mechanism is. Similarly, Sun et al. propose an assignment by comparing experimental results to images simulated for a range of different B terminated structures Sun et al. (2018). The 1 V bias used in the simulations is, however, more than three times larger than the experimental bias ( mV). We presume little variation would be observed in the simulated results had they been performed with the experimental value.
III.3 Differential conductance
Hlawenka and coworkers have observed termination-dependent shifts of the 4-like intensity near using photoemission Hlawenka et al. (2018): A 4 component appears 10 meV below the bulk peak for B termination and 10 above it at the Sm terminated surface. Since STS also provides experimental access to the state density, we can try and establish further connections. Hlawenka et al. found a surface 4 component at meV at the B terminated surface. Interestingly, both Yee, He et al. Yee et al. (2013) and Rößler et al. Rößler et al. (2014) have reported a feature near this energy ( and mV) in tunneling spectra obtained on the unreconstructed topography. This result appears to support the interpretation given above that the unreconstructed topography corresponds to the B terminated surface. In addition, the prominent feature near mV in tunneling spectra on the topography nearly coincides with surface component seen in photoemission for the Sm terminated surface ( meV). Jiao et al. and Sun et al. further reported a fine structure in sub-Kelvin tunneling spectra Jiao et al. (2016); Sun et al. (2018). It is tempting to interpret this fine structure in terms of peaks in the LDOS, and the attribution to crystal electric field splitting seems reasonable.
We have to consider, however, that interference between parallel tunneling pathways complicates the interpretation of differential conductance spectra in Kondo systems. In the case of a single magnetic impurity, the spectrum takes the appearance of the well-known Fano resonance. In lattice systems like , the low-bias spectrum can take a more structured form Maltseva, Dzero, and Coleman (2009); Figgins and Morr (2010). The solid lines in Figs. 1(b,d) show a description of the differential conductance using the model by Maltseva et al. Maltseva, Dzero, and Coleman (2009), where we have manually adjusted the parameters to reach qualitative agreement between model and data. The most prominent difference between spectra on both topographies is a different ratio of tunneling amplitudes into the composite 4– 5 states (), and into the conduction electron states directly (). On the reconstructed topography we find a ratio to describe the experimental result, while a smaller absolute value near 0.002 appears to fit the spectra from the unreconstructed areas. Assuming that the topography corresponds to Sm termination as argued above, the relatively large tunneling amplitude for tunneling into composite 4–5 states found on this topography could be due to closer spatial proximity of tip and Sm LDOS. On a B terminated surface where the separation between tip and the first Sm layer is likely to be larger, the tunneling channel into the more delocalized conduction band would be more important.
As a second notable difference between the spectra in Fig. 1(b) and (d), we find that an agreement between model and data can only be obtained by assuming a different position of the renormalized 4 level () for the different topographies. We find that meV provides a good match to the experimental spectrum on the surface, while a value of meV fits the unreconstructed case. This shift of the renormalized 4 energy further supports the assignment of the reconstructed topography to Sm termination, and the to B termination: With ARPES the smaller surface 4 binding energy is found at the Sm terminated surface. We will argue below that this should also hold for the angle integrated state density measured with STM. We note, however, that in , three 4 states are involved in forming the many-body resonance at (mixed valence between and ), whereas the model description assumes only a single localized state. Since the 4-like states formed by hybridization in are expected to be degenerate only at the point Lu et al. (2013), a mere termination dependent difference in amplitude for tunneling into the various components of the same band structure could also give rise to a shift.
III.4 Surface terminations in photoemission
The characteristics of B and Sm terminated (100) surfaces in photoemission have already been reported by Hlawenka et al. Hlawenka et al. (2018). The most important result of that work in the light of the present study, is that either termination appears to have only a single under-coordinated surface element, i.e., is purely Sm- or B terminated. Here we demonstrate that singly terminated areas can exceed the size of the synchrotron light spot (FWHM m). This can be concluded from Fig. 3, where results from ten independently prepared surfaces are shown. The photoemission intensity images in (a) clearly form two distinct sets, even though they are obtained under identical conditions. The results in the left column of Fig. 3(a) can be associated with B termination on the basis of the corresponding B 2 and Sm 4 spectra, those on the right with Sm termination Hlawenka et al. (2018).

The energy distribution curves in Fig. 3(b) show that the Sm 4-like intensity at is displaced for the two different terminations by an amount that is roughly equivalent to the peak width. We can therefore conclude that the distribution of the results is bimodal with negligible overlap between the modes: The energy distribution curves from B terminated samples (blue) have less than 20% of their maximum intensity at meV [indicated by the dashed vertical line in Fig. 3(b)]. Spectra from Sm terminated samples (red), on the other hand, have attained of their maximum intensity at this binding energy.
In Fig. 3(c) we present the photoemission intensity integrated along the — direction. It can be seen that the surface shifts of the 4-like intensity at reported by Hlawenka et al. are likely to persist, albeit to lesser extent, in the angle-integrated state density relevant for the STS measurement. The dashed vertical lines in Fig. 3(c) indicate the positions of the surface component on the B (blue) and Sm terminated surface (red) along with the position of the more bulk-like 4 component common to both terminations.
III.5 Umklapp intensity
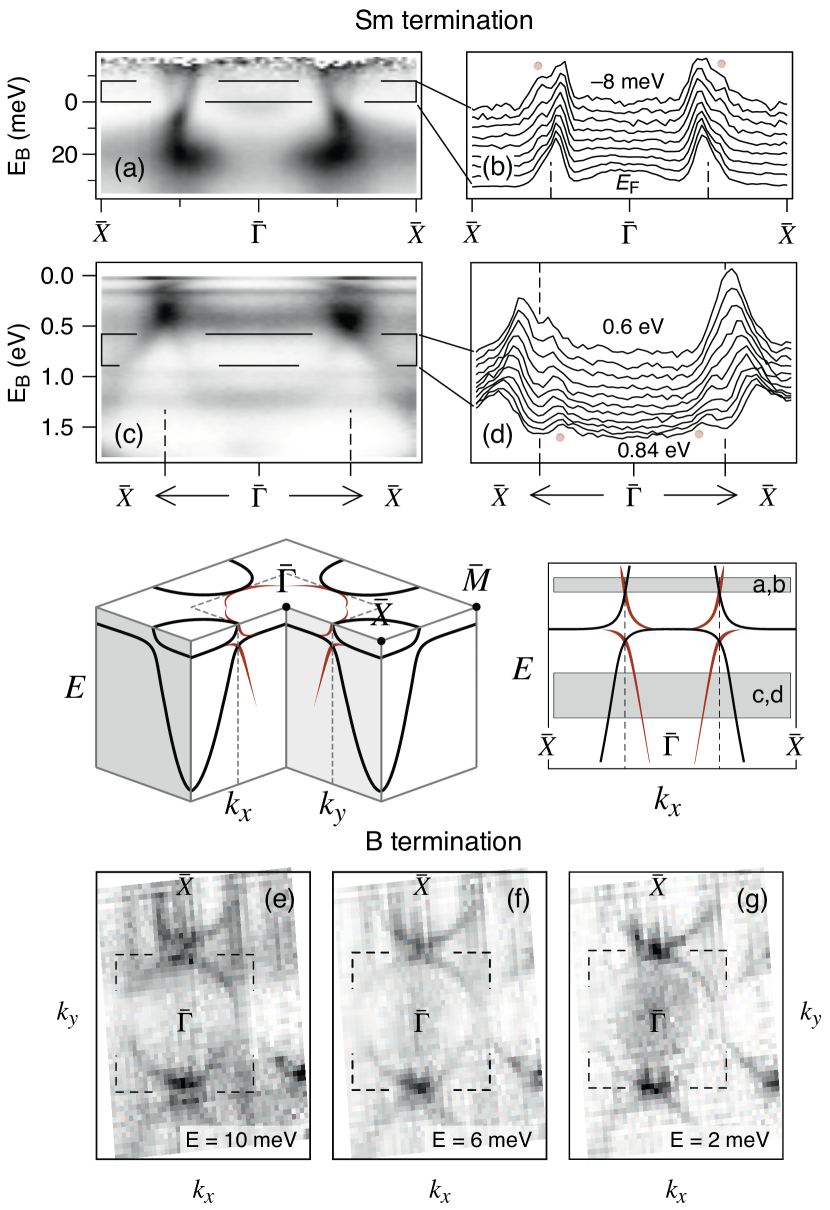
Back-folded photoemission intensity has been reported in several ARPES studies Jiang et al. (2013); Xu et al. (2013); Hlawenka et al. (2018) and could provide a further test for the assignment of STM topographies to surface terminations. Umklapp intensity is most readily seen at B terminated surfaces with photon energies below eV. The surface state responsible for the elliptic Fermi surface contour around is indicated in Fig. 3(a) with the label ‘-state’. For B termination (left column) we can see the replica of this state at values closer to labeled ‘-umklapp’. The nature of this feature as a backfolded state along a supercell zone boundary with twice the lattice constant can be confirmed in the constant energy surfaces shown in Fig. 4(e–f). The elliptical pockets centered at are seemingly reflected by a mirror plane that cuts the constant energy surfaces at the dashed line, exactly halfway from to .
We can also see signs of a superstructure at the Sm terminated surface. A replica of the dispersion of the surface state forming the electron pocket around can be seen just above [Fig. 4(a,b)]. The maximum due to the umklapp feature is highlighted with a dot in (a). A similar replica of the 5-like dispersion at higher binding energy can be seen in Figs. 4(c,d). Hypothetically, this intensity can also be attributed to the projected bulk 5 band centered around . This would, however, require the complete absence of resolution and a particular matrix element that only highlights the envelope of the bulk 5 band. We think this scenario is very unlikely, since we can estimate the resolution under these conditions to be approximately (supplementary Fig. 6(c) of Ref. Hlawenka et al. (2018)). In conclusion, the photoemission results from both terminations seem to bear signs of a superstructure. In contrast, only one of the topographies seen with STM has a clear superstructure. If we assume, as argued above, that the topography corresponds to Sm termination and the unreconstructed topography to B termination, the origin of the umklapp intensity is accounted for at the former, but remains an open question for the latter termination. We propose that the superstructure seen in ARPES for B termination could be due to a subtle structural effect such as a small tilt of the B octahedra, which would not easily be seen in STM.
III.6 General discussion
The result that we only observe a single topography with STM and a single termination with ARPES for any given surface strongly suggests a connection between the two. As noted above, the bias-dependent contrast on the unreconstruced surface (shown in Fig. 2) strongly suggests that the structure is B terminated: The measured corrugation inverts with increasing bias, as the B state density that is spatially closest to the tip becomes available upon crossing the threshold of the B 2 gap around . At the Sm terminated surface, on the other hand, the outermost Sm layer is likely to dominate the tunneling current over the entire bias voltage range. In contrast, Rößler et al. have assigned unreconstructed areas with a slightly different appearance to B and Sm termination Rößler et al. (2014). We question this assignment, because it is based on results with bias voltages where B states are not expected to contribute noticeably to the tunnel current. In addition, as the spectra obtained on these areas appear indistinguishable, we suggest that they should all be attributed to B termination.
Both Yee, He et al. Yee et al. (2013) and Rößler and coworkers have suggested that the structure is due to a Sm missing-row reconstruction, but only support this claim with an interpretation of apparent height differences that is oversimplified since it does not take the (element specific) LDOS into account Rößler et al. (2014). While such a structure would indeed avert divergence of the electrostatic surface potential that would occur at the bulk-truncated (100) surface, we note that a missing-row structure is not compatible with photoemission experiments: Combining measurements of the Sm 4 and B 2 levels, Hlawenka et al. show that there appears to be no distinct termination with both under-coordinated B and Sm atoms Hlawenka et al. (2018). On the basis of that result, we expect the surface structure to expose only Sm atoms and otherwise consist of bulk coordinated B octahedra.
IV Conclusions
We present a consistent view of the (100) surface based on a study that combines STM and ARPES experiments on surfaces prepared from the same crystal. Using the energy dependence of Sm and B derived state densities, we conclude that the unreconstructed STM topography corresponds to B termination. Consequently, we assign the remaining topography to Sm termination. We cannot yet elucidate the surface structure of both terminations nor the origin of umklapp intensity on one of the surfaces. We do find the differential conductance of the different topographies to be distinctly different, and show that this result supports the interpretation that a shift of the Sm 4-like intensity is the trivial origin of the surface states.
V Acknowledgments
We acknowledge financial support by Deutsche Forschungsgemeinschaft through SFB 1143 as well as SPP 1666, and by project APVV-14-0605 of the Slovak Academy of Sciences.
References
- Pesin and Balents (2010) D. Pesin and L. Balents, Nat. Phys. 6, 376 (2010).
- Dzero et al. (2010) M. Dzero, K. Sun, V. Galitski, and P. Coleman, Phys. Rev. Lett. 104, 106408 (2010).
- Allen (2016) J. W. Allen, Philosophical Magazine 96, 3227 (2016).
- Wolgast et al. (2013) S. Wolgast, Ç. Kurdak, K. Sun, J. W. Allen, D.-J. Kim, and Z. Fisk, Phys. Rev. B 88, 180405 (2013).
- Kim et al. (2013) D.-J. Kim, S. Thomas, T. Grant, J. Botimer, Z. Fisk, and J. Xia, Sci. Rep. 3, 1 (2013).
- Xu et al. (2013) N. Xu, X. Shi, P. K. Biswas, C. E. Matt, R. S. Dhaka, Y. K. Huang, N. C. Plumb, M. Radović, J. H. Dil, E. Pomjakushina, K. Conder, A. Amato, Z. Salman, D. M. Paul, J. Mesot, H. Ding, and M. Shi, Phys. Rev. B 88, 121102 (2013).
- Jiang et al. (2013) J. Jiang, S. Li, T. Zhang, Z. Sun, F. Chen, Z. R. Ye, M. Xu, Q. Q. Ge, S. Y. Tan, X. H. Niu, M. Xia, B. P. Xie, Y. F. Li, X. H. Chen, H. H. Wen, and D. L. Feng, Nat. Commun. 4, 3010 (2013).
- Li et al. (2014) G. Li, Z. Xiang, F. Yu, T. Asaba, B. Lawson, P. Cai, C. Tinsman, A. Berkley, S. Wolgast, Y. S. Eo, D.-J. Kim, Ç. Kurdak, J. W. Allen, K. Sun, X. H. Chen, Y. Y. Wang, Z. Fisk, and L. Li, Science 346, 1208 (2014).
- Yee et al. (2013) M. M. Yee, Y. He, A. Soumyanarayanan, D.-J. Kim, Z. Fisk, and J. E. Hoffman, arXiv (2013), 1308.1085v2 .
- Rößler et al. (2014) S. Rößler, T. H. Jang, D.-J. Kim, L. H. Tjeng, Z. Fisk, F. Steglich, and S. Wirth, Proc. Natl. Acad. Sci. 111, 4798 (2014).
- Ruan et al. (2014) W. Ruan, C. Ye, M. Guo, F. Chen, X. Chen, G.-M. Zhang, and Y. Wang, Phys. Rev. Lett. 112, 136401 (2014).
- Sun et al. (2018) Z. Sun, A. Maldonado, W. S. Paz, D. S. Inosov, A. P. Schnyder, J. J. Palacios, N. Y. Shitsevalova, V. B. Filipov, and P. Wahl, Phys. Rev. B 97, 1 (2018).
- Hlawenka et al. (2018) P. Hlawenka, K. Siemensmeyer, E. Weschke, A. Varykhalov, J. Sánchez-Barriga, N. Y. Shitsevalova, A. V. Dukhnenko, V. B. Filipov, S. Gabáni, K. Flachbart, O. Rader, and E. D. L. Rienks, Nat. Commun. 9, 517 (2018).
- Denlinger et al. (2014) J. D. Denlinger, J. W. Allen, J.-S. Kang, K. Sun, B.-I. Min, D.-J. Kim, and Z. Fisk, JPS Conf. Proc. 3, 017038 (2014).
- Maltseva, Dzero, and Coleman (2009) M. Maltseva, M. Dzero, and P. Coleman, Phys. Rev. Lett. 103, 206402 (2009).
- Jiao et al. (2016) L. Jiao, S. Rößler, D.-J. Kim, L. H. Tjeng, Z. Fisk, F. Steglich, and S. Wirth, Nat. Commun. 7, 1 (2016).
- Antonov, Harmon, and Yaresko (2002) V. Antonov, B. Harmon, and A. Yaresko, Phys. Rev. B 66, 165209 (2002).
- Lu et al. (2013) F. Lu, J. Zhao, H. Weng, Z. Fang, and X. Dai, Phys. Rev. Lett. 110, 096401 (2013).
- Figgins and Morr (2010) J. Figgins and D. K. Morr, Phys. Rev. Lett. 104, 187202 (2010).