Cold Exponential Disks from Interstellar Fountains
Abstract
We present the results of a simple numerical model with phenomenological cloud growth and explosive disruption processes, and with fountain launched ballistic motions of disrupted cloud fragments out of the disk. These processes generate an effective scattering of gas elements over much larger distances than noncircular impulses in the plane, which are quickly damped. The result is evolution of the global cloud density profile to an exponential form on a roughly Gyr timescale. This is consistent with our previous results on the effects of star scattering off massive clumps in young disks, and gas holes in dwarf galaxies. However, in those cases the scattering processes generated thick, warm/hot stellar disks. Here we find that the exponential gas disks remain cold. Star formation in this gas would produce a thin exponential stellar disk.
Subject headings:
galaxies: evolution - galaxies: formation - galaxies: structureI. Introduction
The origin of the exponential radial profile in galaxy disks is not well understood. Profiles close to exponential can result from galaxy formation, with (Aumer & White, 2013; Martig, et al., 2014; Herpich et al., 2015; Rathaus & Sternberg, 2016) or without (Mestel, 1963; Freeman, 1970) specific angular momentum conservation, and two gassy disks can adjust after a merger to be an exponential (Athanassoula, et al., 2016; Borlaff et al., 2014). However, young galaxies are observed to be highly irregular (Elmegreen & Elmegreen, 2005; Conselice, 2006) and subsequent mass accretion can be irregular too (e.g., Ceverino et al., 2016b). This makes the extreme regularity and smoothness of radial profiles in today’s old stellar disks somewhat puzzling. Such regularity seems to require constant re-adjustments to smooth out environmental perturbations and remake the exponential shape.
We have proposed that stellar scattering from clouds (Bournaud et al., 2007; Elmegreen & Struck, 2013, hereafter Paper I) and interstellar holes (Struck & Elmegreen, 2017, hereafter Paper II) in galaxy disks can maintain and even make an exponential from some very different initial structure. Purely random scattering with a slight inward radial bias can make an exponential as stars migrate around the disk (Elmegreen & Struck, 2016). Such a bias might arise from angular momentum perturbations of initially circular orbits with energy-conserving collisions such as those between stars and massive clouds. Cloud-like scattering is favored over spiral-arm scattering in dwarf irregular galaxies which have exponential profiles without spirals or bars (Herrmann et al., 2013). Cloud scattering might also be preferred over viscous evolution (Lin & Pringle, 1987) because dwarfs have little shear.
Stellar scattering from midplane clouds and holes tends to be self-limiting (Papers I, II). The stars scatter both parallel and perpendicular to the disk and those with high scale heights do not interact with clouds as much (Lacey, 1984). The velocity dispersion can get large, however, and this can be a problem for the scattering model if a major radial readjustment is necessary before the exponential forms.
Here we show that exponentials also form in dissipative gas that explodes out of the disk and falls back down to mix with other disk gas. Examples of observed exponential gas profiles are in e.g., Wong & Blitz (2002), Leroy et al. (2009), and Gallagher, et al. (2018), and for high redshift profiles see Fujimoto et al. (2018). For recent models of widespread disk outflows, see e.g., Ceverino et al. 2016a; Martizzi, et al. 2016. This dissipative process does not lead to large velocity dispersions even when the disk is rearranged completely. A process like this that forms exponentials in gas might be preferred to purely stellar scattering because the gas is more fundamental than stars in building a disk. Even in the present universe this process can be efficient, since a significant amount of gas is lofted out of disks with strong star formation; e.g., roughly of the total HI mass in some cases (see Vargas, et al. 2017 on NGC 4559 and references therein to other HALOGAS studies). Star formation in this reconfigured gas would then produce the stellar exponential, although with a slightly different scale length in proportional to the power of the non-linear Kennicutt-Schmidt relation.
II. Models
The effects of gas mixing on radial profiles is isolated by using an idealized model of a disk of clouds with a fixed potential for rotational motions and no other torques that might also re-arrange the disk. The clouds are test particles initially in circular orbits, and the rotational potential is a power-law in radius (see Paper I). The acceleration is given by,
| (1) |
where is the central radius in three dimensions, and the 0.2 term is an arbitrary softening constant. In this potential the disc has a circular velocity that increases gradually as , where is the projected radius within the disc. The gravitational mass within a radius is .
In the direction perpendicular to the disk, there is a vertical component of the total gravity implicit in equation (1), plus a vertical gravity from the disk mass itself. To consider the second component, we use an effective gravity in the vertical direction to help hold the disk in place,
| (2) |
This acceleration is linear in , and with a moderate magnitude, allows the formation of a thick disk if the vertical dispersion is high.
We use dimensionless units, i.e, , with . We will use two representative scalings for a normal and dwarf type disk, respectively. For the normal disk these are: kpc, km s-1, Myr, and . Then, the rotation periods at and kpc for a flat rotation curve of magnitude 6 velocity units are and Myr, respectively. For the dwarf disk these are: kpc, km s-1, Myr, and .
The particles are initialized with a mass of one unit, but build up in the merging phase (see below). These mass units are arbitrary, since there are no gravitational interactions between the clouds. In each computational cycle, particles with masses of three units or more have a finite probability of being broken up by feedback effects, thereby “exploding”. This probability is set to 0.1 for particles of mass 3.0 units, and it increases by 0.05 for each increase of particle mass by one unit, up to 1 for masses greater than or equal to 22 units. Other values of these parameters have been tested, and found to not change the results qualitatively.
The computational cycle has three parts: 1) an explosion phase representing star formation feedback in the interstellar medium; 2) a phase of particle ballistic motion in the fixed galaxy potential, and 3) a phase of merging of adjacent particles to make bigger clouds. In each stage all particles are affected simultaneously. In the explosion phase, all selected particles of mass units are divided into particles, and each is given additional random velocity impulses in the x, y, and z directions. The average magnitude of these velocity increments ranges from 0.3-4.0 code units, where peak circular velocities are typically 6-10 code units.
In the second phase, we adopt a picture like that of Marasco, Fraternali & Binney (2012) who assumed that clouds were launched from superbubbles onto nearly ballistic orbits, despite their interaction with coronal gas. We also neglect this interaction. The assumption of nearly ballistic orbits allows gas clouds to scatter across significant parts of the disk over time. The duration of the ballistic phase is generally taken equal to 2.0 time units. The exact value is not important as long as there is enough time for significant (non-circular) motions of the component particles.
In the merging phase, a grid is imposed on the disk and all particles in each grid cell are merged as expected from cloud collisions and local gravitational instabilities. This merging phase is where the dissipation occurs, and it tends to maintain circular motions in the gas. The velocity components of the merged particle are computed as mass weighted averages of the components of the constituent particles. In most runs, the cell sizes are 0.1 units in radius and in azimuth. Particles farther than 2.0 units from the mid-plane of the disk are not merged, but continue on ballistic trajectories. Since the disks remain relatively thin, this constraint has little effect other than contributing to the disk thickness. With these cell sizes, the particles can sometimes merge into relatively massive clouds containing several tens of mass units, especially if the randomness of the explosions allows them to survive for several explosion phases. Eventually each cloud is broken up in some explosion phase, depending on the probabilities, and after redistribution of their constituent particles through ballistic trajectories in the halo, other clouds take their place.
Angular momentum and energy are explicitly conserved in the ballistic phase, i.e., particles that scatter outward and fall back at larger radii will have lower azimuthal speeds than those they meet in the disk.
III. Results and Discussion
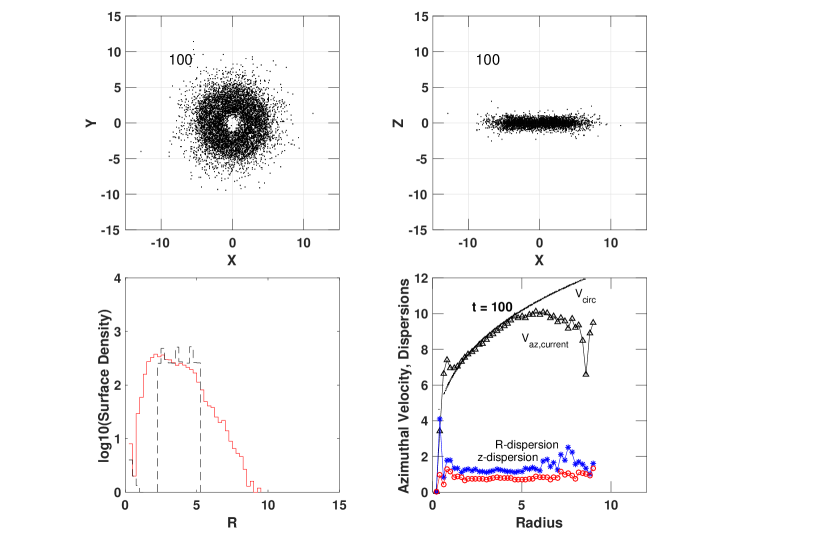
The algorithm of the previous section was run with a wide range of parameters to determine the evolution of surface density profiles in different regimes (see below). An example is shown in Figure 1 where the disk begins with a flat radial profile and evolves to an exponential. The halo potential corresponds to a slowly rising rotation curve typical of a low mass galaxy, (Persic et al., 1996). The upper panels show the particle distribution at the end of the run (), and after the feedback/exploding and ballistic travel phases. After the merging phase all particles would be located at the centers of adopted grid elements. The particle distribution is smooth and the disk appears moderately thick. A large majority of the particles lie in a quite thin disk. A negligible fraction () of the material has been pushed to more than spatial units out of the disk, where it temporarily does not participate in the merging and exploding phases.
The panel in the lower left shows the surface density profile at the initial and final times. The latter is close to an exponential form.
The lower right panel shows the initial rotation curve as a solid line, the final azimuthal rotation speed as open triangles, and the radial and vertical () velocity dispersions as asterisks and circles. The azimuthal velocity lags behind the initial circular rotation curve because of the random motions. The ratio of the velocity dispersion to the azimuthal velocity is substantially lower with this cloud scattering than it is in models with stellar scattering off interstellar clumps and holes (Papers I, II). The dissipation in the merging phase is responsible. The final time shown corresponds to about Gyr in this dwarf scaling, and the exponential starts to appear in about half of that time.
In the model of Fig. 1, the average magnitude of the velocity impulse given to each fragment in each coordinate direction is 1.5 units, or a total average magnitude of units. This value equals km s-1 in the dwarf scaling given above and is reasonable or even conservative for shell and supershell ejections off the plane. For example, Relaño, et al. (2007) find expansion velocities of km s-1 in the H shells around OB associations in local galaxies.
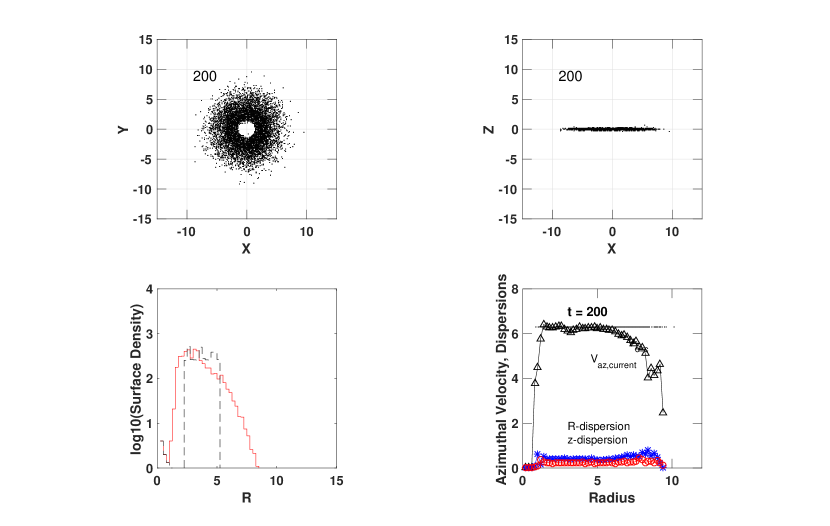
Fig. 2 shows a case with a flat rotation curve and a small average relative feedback velocity of 0.45 units, corresponding to an explosion velocity of km s-1 in the disk scaling above. The figure shows that this small feedback yields a very thin disk, and an average dispersion to azimuthal velocity ratio of less than a tenth. The surface density profile in this case is a Type II form by the final time, which corresponds to about Gyr in the disk scaling. Slow explosion velocities take longer to form the exponential.
The half-mass height in Fig. 1, the thicker case, is 0.13 units. Taking the radius to be about 10 units we get a ratio of height to radius equal to 0.013. This is smaller than in NGC 891, a vigorously star-forming, edge-on disk galaxy. According to Bocchio et al. (2016), the dust scale height of N891 is kpc, and the galaxy radius in NED111NASA/IPAC Extragalactic Database is 6.75 arcmin, which is 17.8 kpc with the scaling of 2.64 kpc per arcmin. Thus the ratio of the dust scale height to radius in NGC 891 is , a factor of 6 larger than in the figure. In the case shown in Fig. 2, the half-mass height to radius ratio is 0.0022, much smaller than in Fig. 1, as we might expect in this very mild case.
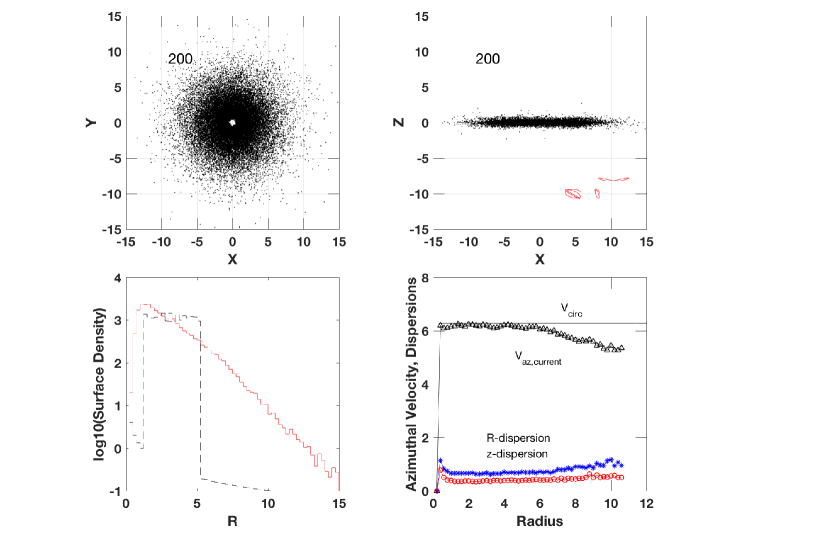
Fig. 3 is for a case with a flat rotation curve and a larger average relative feedback velocity of 0.75 units, corresponding to an explosion velocity of km s-1 in the disk scaling above. In addition, this model also had the merger grid cell sizes decreased by a factor of two in both radial and azimuthal directions. The particle number was also increased by more than a factor of four (to 58,560), so that the clouds are more like giant clouds in present-day disks than very massive clouds in young disks. However, this change had little effect on the profile evolution when compared to a comparable model with the original grid and particle number. The radial profile evolves more rapidly in this case, and generates larger velocity dispersions and a somewhat thicker disk than in Fig. 2. The exponential form starts to appear at a time of a little over Gyr. By the late time shown in the figure the profile has nearly a single exponential form. Despite the larger explosion velocity input (using the disk scaling), this flat rotation curve model retains a thin disk. Indeed, compared to recent cosmological galaxy formation models, the feedback seems quite modest (e.g., Christensen et al. 2016, Hopkins et al. 2018). In our models increased feedback magnitude leads to thicker disks, but this is not necessarily the case in self-consistent cooling models.
We have also done another run like that in Fig. 3, but with the initial particle mass further reduced by a factor of 5, the cell size reduced by 10% and the feedback magnitude increased by 20%. The results are essentially the same as Fig. 3. These results emphasize a couple of points: 1) a slightly increased feedback magnitude can significantly decrease the profile change timescale, and 2) smaller, but more numerous star-forming clouds can have the same effect as a smaller population of more massive clouds.
In sum, these models show that fountain feedback scattering can generate exponential or Sérsic type density profiles, with Sérsic index close to 1.0 in the latter case. We have carried out many more runs with different model parameter values, and found that this is a general result as long as the explosive input velocities of the feedback phase are sufficient to propel some gas elements over significant radial excursions, though generally over a modest fraction of their initial radii (see upper right panel in Fig. 3 for examples). Specifically, we have carried out models with: 1) rotation curves ranging from nearly Keplerian to nearly solid body, 2) explosive impulse velocities ranging over an order of magnitude, 3) ballistic phase timescales ranging over a factor of a few, and 4) particle numbers and cell sizes ranging over a factor of a few. All of these models tend toward exponential profiles, albeit on timescales that depend on the parameter values. It appears that this is essentially a diffusion process, which is not sensitive to the details of individual scattering events. For reasonable values of the feedback velocity input these gas disks can also be quite cold.
IV. Conclusions
As discussed in the Introduction, exponential disks have been a persistent mystery. Their universality suggests a common, robust generation mechanism associated with galaxy formation, but disruptions from global disturbances like interactions and accretions also suggest a second mechanism involving disk restoration that works relatively rapidly. In a series of papers, we have demonstrated that stellar scattering off massive clumps and holes in the interstellar medium can generate stellar exponential profiles on timescales typically less than a Gyr. However, these stellar processes generally yield thick disks, not cold, thin exponentials. Radial migration from spirals (Sellwood & Binney, 2002) could, in principle, form an exponential-like profile while maintaining near-circular orbits, but recent work by Daniel & Wyse (2018) suggests that too few stars would migrate over large enough radial distances to rearrange the density profile on the required timescale.
In the previous sections we have shown how scattering of clouds in supershells and local fountains can drive the gas towards an exponential profile in about a Gyr. Profile change is a diffusive process averaged over many such events. While star-clump scattering tends to produce thick stellar disks, gas scattering alone is dissipative and can produce thin disks. Depending on parameter values, it can do so on short timescales, facilitating the reformation of disturbed exponential thin disks.
In addition there is an evolutionary sequence in both the models above and the previous stellar scattering models (Papers I, II). Initially scattering processes, in flat-to-moderately rising rotation curve potentials, throw particles to larger radii, even to twice the initial radius with strong scattering. This extended disk usually has a steep exponential (Type II) profile. The evolution of the rest of the initial disk to an exponential profile is much slower, so a shallow exponential is present there for a long time (see Fig. 2). In the models here the break in the slope between the two exponentials marks the initial outer radius. Eventually, the scattering works to produce a single exponential (Fig. 3).
These models suggest a two-part solution to disk maintenance. Star-forming disks generate exponential gas profiles through cloud scattering by feedback while stars formed in these clouds inherit the profiles. Plus, stellar scattering by clumps and holes operates at the same time, also forming an exponential, but without needing to do all of the rearrangement by itself. In this way, the velocity dispersion of the stars stays reasonably low and the disk maintains an exponential on sub-Gyr timescales.
V. Acknowledgements
We are grateful to an anonymous referee for helpful comments that significantly clarified the presentation.
References
- Athanassoula, et al. (2016) Athanassoula, E., Rodionov, S.A., Peschken, N. & Lambert, J.C. 2016, ApJ, 821, 90
- Aumer & White (2013) Aumer, M. & White, S.D.M. 2013, MNRAS, 428, 1055
- Bocchio et al. (2016) Bocchio, M., Bianchi, S., Hunk, L. K., & Schneider, R. 2016, A&A, 586, A8
- Borlaff et al. (2014) Borlaff, A., Carmen Eliche-Moral, M., Rodríguez-Pérez, C., Querejeta, M., Tapia, T., Pérez-González, P.G., Zamorano, J., Gallego, J., & John Beckman, J. 2014, A&A 570, A103
- Bournaud et al. (2007) Bournaud, F., Elmegreen, B. G., & Elmegreen, D. M., ApJ, 670, 237
- Ceverino et al. (2016a) Ceverino, D., Arribas, S., Colina, L., Rodríguez Del Pino, B., Dekel, A. & Primack, J. 2016, MNRAS, 460, 2731
- Ceverino et al. (2016b) Ceverino, D., Jorge Sánchez Almeida, J., Muñoz-Tuñón, C., Dekel, A., Elmegreen, B.G., Elmegreen, D.M., & Primack, J. 2016, MNRAS, 457, 2605
- Christensen et al. (2016) Christensen, C. R., Davé, R., Governato, F., Pontzen, A., Brooks, A., Munshi, F., Quinn, T., & Wadsley, J. 2016, ApJ, 824, 57
- Conselice (2006) Conselice, C.J. 2006, MNRAS, 373, 1389
- Daniel & Wyse (2018) Daniel, K. J., & Wyse, R. F. G. 2018, MNRAS, 476, 1561
- Elmegreen & Elmegreen (2005) Elmegreen, B.G., & Elmegreen, D.M 2005, ApJ, 627, 632
- Elmegreen & Struck (2013) Elmegreen, B.G., & Struck, C., 2013, ApJL, 775, L35 (Paper I)
- Elmegreen & Struck (2016) Elmegreen, B.G., & Struck, C., 2016, ApJ, 830, 115
- Elmegreen, Struck, & Hunter (2014) Elmegreen, B.G., Struck, C., & Hunter, D. A. 2016, ApJ, 796, 110
- Freeman (1970) Freeman, K. C. 1970, ApJ, 160, 811
- Fujimoto et al. (2018) Fujimoto, S., et al. 2018, ApJ, 861, 7
- Gallagher, et al. (2018) Gallagher, M. J., et al. 2018, ApJ, 858:90
- Herpich et al. (2015) Herpich, J., Stinson, G.S., Dutton, A.A., Rix, H.-W., Martig, M., Roškar, R., Macciò, A.V., Quinn, T.R., & Wadsley, J. 2015, MNRAS, 448, L99
- Herrmann et al. (2013) Herrmann, K.A., Hunter, D.A., & Elmegreen, B.G. 2013, AJ, 146, 104
- Hopkins et al. (2018) Hopkins, P. F., et al. 2018, MNRAS, 480, 800
- Lacey (1984) Lacey, C. G. 1984, MNRAS, 208, 687
- Lin & Pringle (1987) Lin D. N. C., & Pringle J. E., 1987, ApJL, 320, L87
- Leroy et al. (2009) Leroy, A. K., et al. 2009, AJ, 137, 4670
- Marasco, Fraternali & Binney (2012) Marasco, A., Fraternali, F., & Binney, J. J., 2012, MNRAS, 419, 1107
- Martig, et al. (2014) Martig, M., Minchev, I. & Flynn, C. 2014, MNRAS, 442, 2474
- Martizzi, et al. (2016) Martizzi, D., Fielding, D., Faucher-Giguère, & Quataert, E. 2016, MNRAS, 459, 2311
- Mestel (1963) Mestel L. 1963, MNRAS, 126, 553
- Persic et al. (1996) Persic, M., Salucci, P., & Stel, F. 1996, MNRAS, 281, 27
- Rathaus & Sternberg (2016) Rathaus, B., & Sternberg, A. 2016, MNRAS, 458, 3168
- Relaño, et al. (2007) Relaño, M., Beckman, J. E., Daigle, O., & Carignan, C. 2007, A&A, 467, 1117
- Sellwood & Binney (2002) Sellwood, J. A.., & Binney, J. J. 2002, MNRAS, 336, 785
- Struck & Elmegreen (2017) Struck, C. & Elmegreen, B.G. 2017, MNRAS, 469, 1157 (Paper II)
- Vargas, et al. (2017) Vargas, C. J., Heald, G., Walterbos, R. A. M., Fraternali, F., Patterson, M. T., Rand, R. J., Jozsa, G. I. G., Gentile, G., & Serra, P. 2017, ApJ, 839, 118
- Wong & Blitz (2002) Wong, T., & Blitz, L. 2002, ApJ, 569, 157