SIReferences
Anion-order driven polar interfaces at LaTiO2N surfaces
Abstract
Perovskite oxynitrides have recently attracted attention for their ability to photocatalytically split water. Compared to oxides the arrangement of anions in the material represents a further structural degree of freedom. The bulk oxynitride LaTiO2N prefers a bonding-dominated cis nitrogen arrangement, while we have previously shown that the (001) surface prefers a non-polar trans order to compensate polarity. Here we consider, using density functional theory calculations, the polar/non-polar interface that would necessarily be present between the two anion orders. We show that the Ti-terminated surface will adopt up to two trans ordered surface layers, which has a beneficial effect on the oxygen evolution efficiency. We then consider the hypothetical case of a polar cis ordered surface layer atop a non-polar trans bulk and show that similar electronic reconstructions as in the LaAlO3/SrTiO3 interface can be expected when interfaces between different anion orders are engineered in one and the same oxynitride material.
Introduction
Oxynitrides have recently attracted attention as electrodes for photocatalytic water-splitting under visible light.Ebbinghaus et al. (2009); Takata et al. (2015); Ahmed and Xinxin (2016) These mixed-anion compounds are semiconductors and combine the characteristics of the corresponding pure oxides and nitrides. The former have a good chemical stability, but their large band gaps - typically in excess of 3 eV - limit the absorption of solar light to the ultra-violet region. The substitution of oxygen by less electronegative nitrogen reduces the band gap, however at the expense of a reduction in stability.
Oxynitrides can occur in the perovskite crystal structure where common deviations from the perfect cubic cell, such as rotations and distortions of the cation coordination octahedra, can have an impact on the electronic properties of the material.Kubo et al. (2017) In addition, perovskite oxynitrides are characterised by the order of the oxygen and nitrogen anions. While for some materials, such as LaZrO2N and LaTiO2N,Clarke et al. (2002) a complete disorder was reported, both experiment and theory have suggested the preference for a short-range cis order of nitrogen in 2-dimensional planesYang et al. (2011); Porter et al. (2014) that optimises the coordination of the cation by the anionic ligands.Yang et al. (2011)
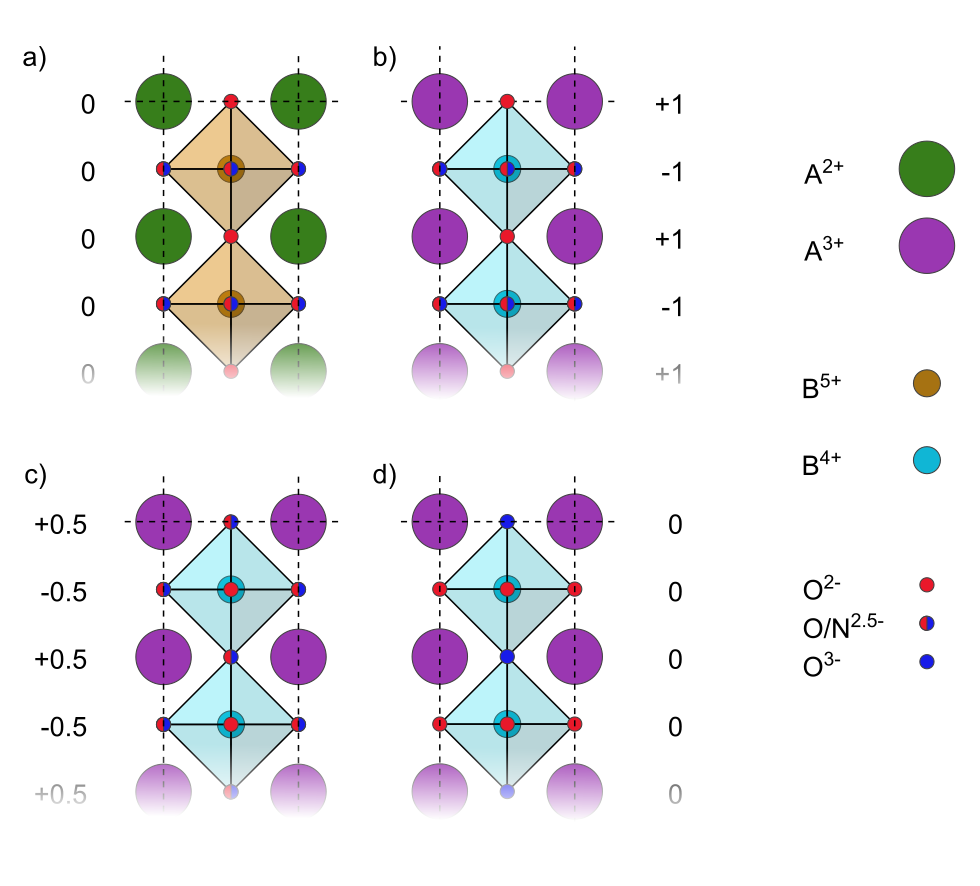
This, however, may not necessarily be the case at the surface. Surfaces with alternating net positively and negatively charged layers are inherently unstable due to the diverging electrostatic energy and require electronic and/or structural reconstructions to cancel the resulting surface dipole. Goniakowski et al. (2007) Perovskite oxynitrides with the general formula A2+B5+O2N can have a non-polar stacking of neutral A2+O/B5+ON planes along the 001 direction while preserving the bulk 2D cis anion order in BON planes also at the surface (Fig. 1a). Oxynitrides with the general formula A3+B4+O2N, however, would result in alternating charged planes (AON/BO3N or AO2/BO2N2 depending on the specific 001 direction with respect to the anion order, see Figs. 1 b and c), while preserving a cis anion order. As we have previously shown for LaTiO2N using density functional theory (DFT) calculations, a local trans anion reordering at the surface results in a sequence of neutral A3+N/B4+O2 layers (Fig. 1 d) and lower surface energies compared to cis ordered surfaces.Ninova and Aschauer (2017)
This implies that at surfaces of A3+B4+O2N oxynitrides such as LaTiO2N, the electrostatic energy will favour a trans nitrogen order along the out-of-plane direction over the bonding-dominated stable cis order of the bulk. This change in anion order at the surface will result in a trans region at the surface and an underlying cis bulk. In the present paper, we investigate the structure and stability of this cis/trans interface, the thickness of the trans layer and the resulting surface properties of LaTiO2N (001) using DFT calculations. As the interface resembles the LaAlO3/SrTiO3 interface that hosts a 2D electron gas to compensate polarity,Ohtomo and Hwang (2004) we also investigate the hypothetical case of a trans bulk with a cis surface to assess if an anion-order induced non-polar/polar interface could lead to similar effects in an oxynitride material.
Methods
Initial LaTiO2N (001) surface slabs were built from two different bulk models, corresponding to model 3 and model 4 in Ref. Ninova and Aschauer (2017). Both bulk models have a cis arrangement of Ti-N bonds, which is the most stable anion order in the bulk, but differ in the direction of the Ti-N chains, which propagate in bc (model 3) and ab (model 4) planes respectively. The resulting slabs thus differ in their atomic-layer chemical composition - either La2NO/Ti2O3N or La2O2/Ti2O2N2 - and thus in their resulting surface dipole moment. From now on, we will refer to them as model A and model B respectively.
Our surface slabs are asymmetric, 22 perovskite unit cells wide and 4 unit-cell (8 atomic layers) layers thick. Periodic images along the surface normal are separated by 10 Å of vacuum and a dipole correctionBengtsson (1999) is applied, so as to cancel the effect of the artificial electric field across the slab as a result of the differently charged terminations. The atoms in the bottommost unit cell are kept fixed at their bulk position and relaxations are performed with convergence thresholds of eV for the energy and 0.05 eV/Å for the forces.
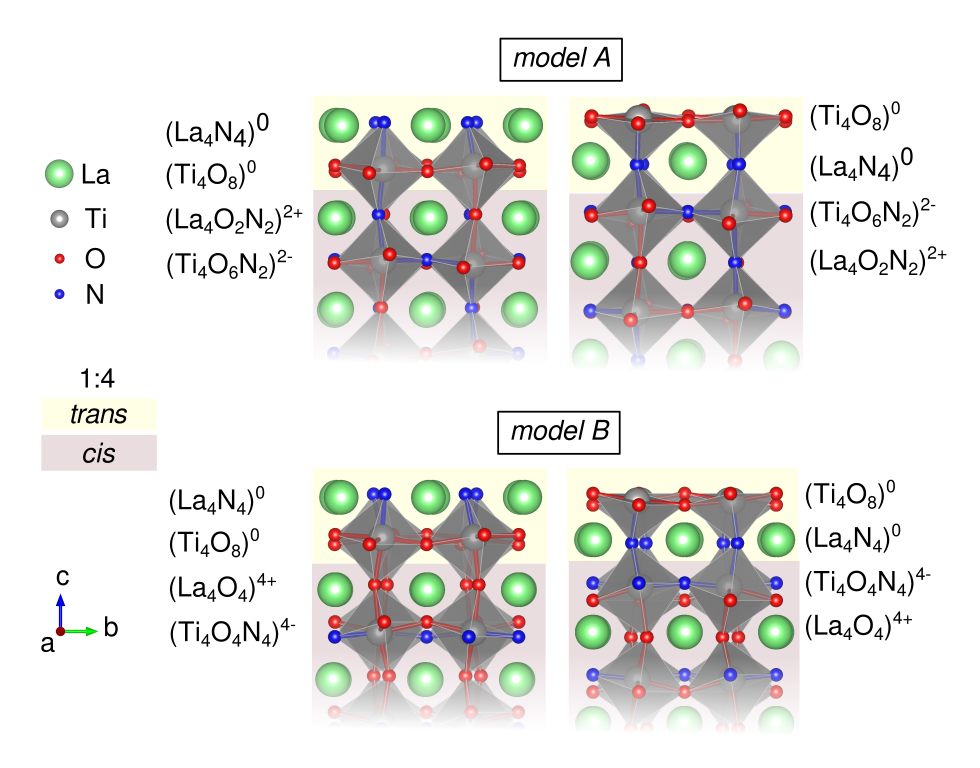
Based on these initial model A and model B slabs, we construct mixed anion-ordered slabs by exchanging N and O atoms within one unit-cell layer at a time, starting from the topmost one and proceeding downwards, resulting in the electroneutral La2N2/Ti2O4 stacking sequence in the anion-exchanged layers. Notation-wise, such slabs will be called “1:4” when the first layer of the slab is trans-ordered, “2:4” - when the top half of the slab trans-ordered and “3:4” - when only the bottommost unit-cell is cis-ordered. Following this notation for the number of layers with altered (trans) anion order compared to the total thickness of the slab, the initial purely cis-ordered surface slabs are “0:4”. Examples of model A and model B “1:4” slabs with both La and Ti termination layers are shown in Fig. 2.
The energy gain/loss of this anion exchange, Eionex, is evaluated as the energy difference between relaxed surface slabs with mixed anion order and without. Additionally, we assess the quantitative effect of the anion exchange on surface energies, following equation 1. We assume that the process of surface creation with anion reordering happens in two steps - first, the surface is cleaved from the bulk structure and then the anion exchange occurs, which is the reason why is chosen to be that of models A or B with no anion exchange; subsequently, the surface relaxes into a slab with the chosen anion order. Ebulk is the bulk energy of each model and Asurf is the surface area.
| (1) |
We carry out all calculations with the PBE functionalPerdew et al. (1996) and the Quantum ESPRESSO package.Giannozzi et al. (2009, 2017) The ion-electron interactions are described with ultrasoft pseudopotentials,Vanderbilt (1990) and the wavefunctions are expanded in plane waves. The chosen cut-offs for the kinetic energy and the augmented density are 40 Ry and 320 Ry, respectively. A Hubbard U parameter of 3 eV is applied on the Ti-3d orbitals.Anisimov et al. (1991) The Brillouin zone is sampled with a sufficiently dense 661 Monkhorst-Pack k-mesh.Monkhorst and Pack (1976) The projected density of states (PDOS) are plotted with a Gaussian broadening of 0.01 Ry. Finally, we use VESTA for all graphical representations of our models.Momma and Izumi (2011)
Results and Discussion
Mixed-order surfaces
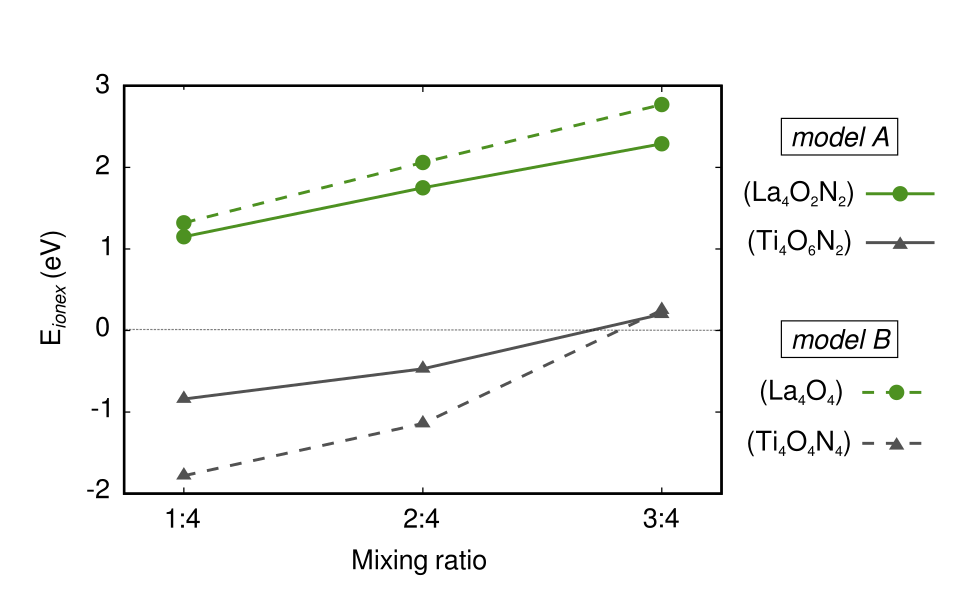
In figure 3, we report the energy gain (negative) or loss (positive) associated with exchanging anions in successive layers for both the La and the Ti terminated surfaces of models A and B. We observe that assuming a trans order has dramatically different effects for the La and Ti terminations, independently of the model. While the trans (TiO2)/(LaN) surface order is favourable for Ti-terminated surfaces (negative Eionex), no such stabilization occurs for the La-terminated surface. This energy evolution is also reflected in the surface energies as shown in Table S1. For the Ti terminated surface, we observe negative Eionex for anion exchange in the first and second layer, reordering being more favourable for the more polar model B. An anion exchange from the 3rd layer onwards is energetically no longer favorable, suggesting a trans layer thickness of 2 unit cells at the Ti terminated surface. For the La terminated surface, on the other hand, we observe positive and continuously increasing Eionex, implying that the cis ordered surface is most stable. This is surprising, considering that the surface slab with the lowest surface energy was found to have a LaN termination,Ninova and Aschauer (2017) the difference being that there the whole slab assumes a trans anion order.
We perform extensive tests to ensure that these observations are not affected by the computational setup. Indeed, neither the thickness nor the type of slab (symmetric or asymmetric) alters the observed trends (see Tables S3 and S4). The frozen bottommost layer does also not significantly alter the slab geometry, as shown in Figure S4. We thus assume that the observed energy evolutions and deviating behaviour for the terminations are physically meaningful. As anion exchange affects the structure and energetics in more than one way, we will, in following paragraphs, try to decouple these energy contributions and investigate the possible cause for the different behaviour of the two terminations.
The most obvious effect is that here we compute a trans surface layer on top of a cis ordered bulk and thus impose the cis lattice parameters on the trans layer. Due to different Ti-N and Ti-O bond lengths, this will lead to strain in the trans layer that could affect the energy. By relaxing the in-plane lattice parameters of a model B 1:4 slab, we find a 0.2% smaller cell parameter that, however, amounts to only 0.02 eV strain energy per exchanged layer. Also this strain effect should be similar for both terminations and can therefore not explain the observed marked difference.
Relaxation of the internal geometry could also contribute to the stabilization observed for Ti-terminated surfaces. While geometry changes for the Ti terminated surfaces are generally small, the model B La terminated 1:4 surface undergoes an expansion of the topmost layer by 4.6% with respect to 0:4 (see Table S2) without large changes in the underlying layers. We also observe a change in the octahedral rotation pattern at the La terminated surface, where the longer Ti-O bonds lead to out-of-phase rotations along the surface normal, while the aforementioned expansion of the surface reduces the tilt angle from 12.4 to 9.11∘. The Ti terminated surface retains the bulk rotation pattern and has smaller changes in tilt angle from 13.0 to 11.9∘. Geometry changes for the Ti terminated surface are thus small, yet we find negative reordering energies for the Ti terminated slabs of both models only after geometry optimization (see Table S1). This is also observed for the 1:4 surface of the less polar Model A. More interesting though is the 1:4 surface in Model B, where anion exchange in the topmost unit cell even without geometry relaxation results in a stabilization by 0.12 eV compared to the purely cis-ordered surface. While geometry relaxations thus play a role, the last observation points to a strong alteration of the electrostatics in the slab.
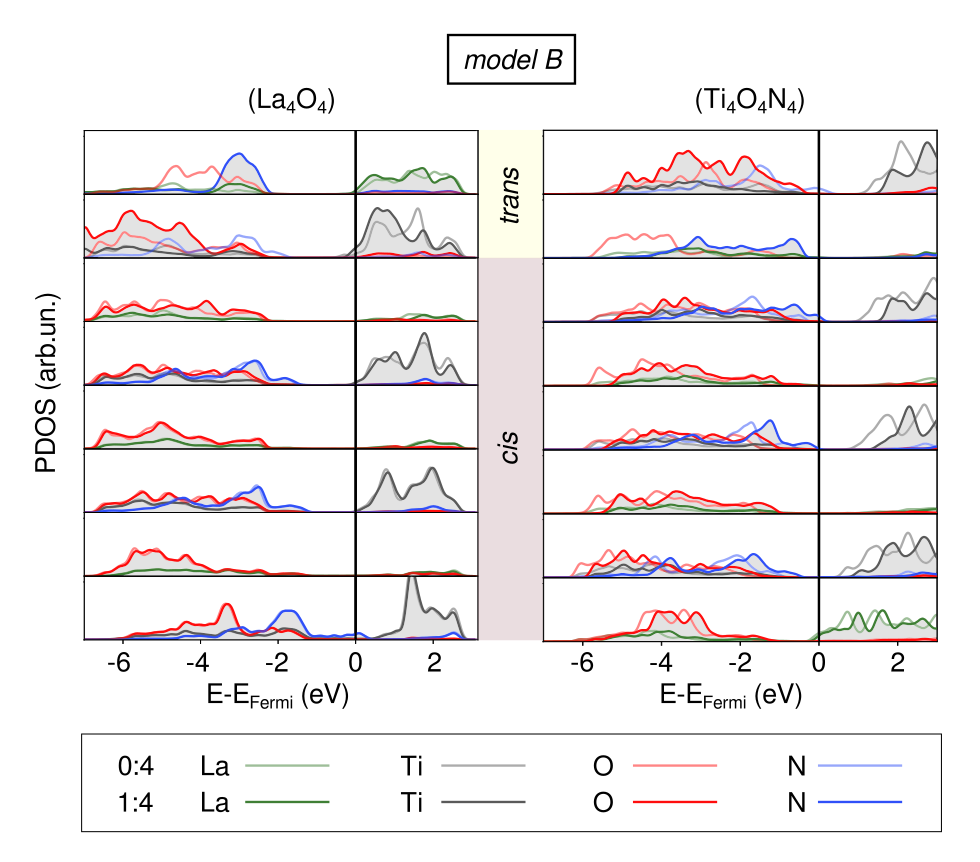
Anion exchange leads not only to the formation of polar-compensated atomic layers at the surface, which should be favoured since they reduce the surface dipole, but also introduces a polar/non-polar interface at the trans/cis boundary. Strong electronic reconstructions, such as the accumulation or depletion of charge, are expected to arise in this region, affecting the electrostatic interactions in the slab. To establish these electronic structure changes, we examine the layer-resolved projected density of states (PDOS) of the 0:4 and 1:4 slabs for both terminations of model B shown in Figure 4 and model A in Figure S3. For the pure cis 0:4 slab N-2p states constitute the top of the valence region, while the bottom of the conduction band is dominated by Ti-3d states. As a result of the nominally charged atomic layers, an electric field appears through the slab, the stabilisation of which requires electronic reconstruction via a compensating charge. In the case of the 0:4 (La4O4)-termination this occurs by partially filling the Ti-bands in the first sub-surface layer. The 0:4 (Ti4O4N4)-termination, on the other hand, is hole doped in the surface layer. This can be observed more clearly for the case of the more polar model B, on which we will focus our discussion in the following.
In the La-terminated slab, anion exchange from 0:4 to 1:4 leads to significant PDOS changes only in the topmost three atomic layers. We observe bonding-induced changes in the nitrogen and oxygen states of the valence band: Due to the lack of strong bonds with Ti in the 1:4 structure, the N- and N- states form a large peak at about -3 eV and the valence band maximum is no longer N-2p dominated. Despite these changes, there is, however, no significant impact on the electron doping of the subsurface (Ti4O4)0 layer, which does not disappear or shift to lower layers with the formation of the charge-neutral surface layers upon anion exchange. In contrast, anion exchange in the Ti-terminated surface affects the whole slab down to the bulk layers: Besides a notable upward shift of states in all atomic layers, the hole doping shifts from the surface layer to the trans/cis interface. By assuming that charge accumulation layers can be represented by charged plates, we can make an analogy to a capacitor model, where the energy decreases with decreasing plate distance. The absence of a shift in the charge accumulation layers for the La-terminated slab implies no marked change in energy, while the shift of one unit-cell layer for the Ti-terminated surface results in a marked reduction in energy. It is thus only for the Ti-terminated surface that the electrostatic energy gain can outweigh the other energy contributions, resulting in an overall stabilization. It is necessary, however, to point out that such a capacitor analogy, while valid for our slabs, may lose its validity when macroscopic dielectric materials are considered.
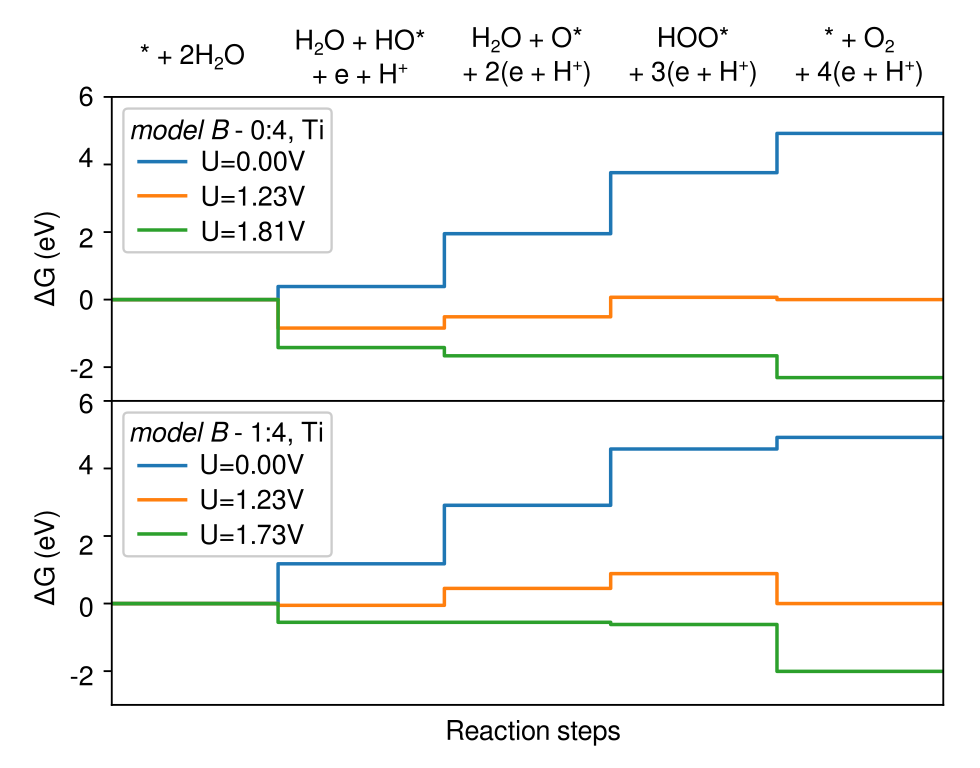
Polar/non-polar interfaces with accompanying internal electric fields were postulated to be promising for photocatalysis due to the effective exciton dissociation and spatial separation of anode and cathode reactions. Guo et al. (2016) We, therefore, investigate the influence of such a non-polar/polar interface on the water-oxidation efficiency. In this reaction molecular oxygen is formed via four proton-coupled electron transfer steps. To compare the efficiency of the 0:4 and 1:4 surface, we compute the reaction free energies of the four steps following the procedure proposed by Nørskov and co-workersNørskov et al. (2004); Valdés et al. (2008) and determine the overpotential necessary to render the reaction thermodynamically favorable (see Figure 5). We observe a slight decrease in overpotential from 0.58 eV for 0:4 to 0.50 eV in the case of 1:4. The different electric field in the 0:4 and 1:4 do not affect the interaction with the intermediates (OH*, O*, OOH*) in terms of bond lengths with the Ti adsorption site. Interestingly though, the potential determining step changes from the formation of the hydroperoxo adsorbate for 0:4 to the deprotonation of the hydroxo for 1:4. Based on these results, we expect the Ti-termination with mixed anion order to be more reactive for water splitting than a pure cis termination.
The polar interface
We have in the previous section established that at the Ti-terminated surface of LaTiO2N, anion reordering leads to a non-polar trans surface stacking atop a polar cis bulk anion order. The interface between the two regions bears resemblance with polar/non-polar interfaces obtained by coherent epitaxially growth of polar materials atop non-polar substrates as for example in the LaAlO3/SrTiO3 (LAO/STO) interface. Ohtomo et al. (2002); Biscaras et al. (2010) In these structures the interface leads to a diverging electrostatic energy (the “polar catastrophe”), which is stabilized by charge transfers from the surface of the polar overlayer to the interface, forming a so-called 2-dimensional electron gas (2DEG). Ohtomo and Hwang (2004); Goniakowski et al. (2007); Goniakowski and Noguera (2014) The interfaces of type TiO/LaO+1 and SrO0/AlO give rise to electron (n-type) and hole (p-type) accumulation respectively at the interface once the polar overlayer has reached a critical thickness, which is 4 and 6 unit-cells for the n-type and p-type interface respectively.Ohtomo and Hwang (2004); Guo et al. (2016); Wang et al. (2018)
There are two differences between the LaTiO2N case discussed above and the LAO/STO interface: first, the reordered surface layer on LaTiO2N (001) is non-polar, whereas the bulk underlayer is polar and second, the interface considered here is not between two different materials, but within the same material, differing only by its anion order. To assess the potential of using anion order to construct interfaces similar to LAO/STO, we consider in the following section the hypothetical scenario of a trans-bulk/cis-surface. While such a structure is not expected to arise from surface stabilization, our findings motivate this computational experiment, in particular since engineering such anion-ordered layers does not seem impossible using modern thin-film growth techniques. Apart from direct growth of the different layers from nitride and oxide targets, it was shown for example that compressive epitaxial strain can lead to trans order in SrTaO2N and LaTiO2N.Oka et al. (2017, 2014); Vonrüti and Aschauer (2018a). Once a film becomes thick enough for the effect of strain to weaken, a cis ordered overlayer would result, leading to the thought-after interface.
In our case, the n-type interface should result at the boundary between (La4O4)4+/(Ti4O8)0, while the p-type interface is formed at (Ti4O4N4)4-/(La4N4)0 boundaries. The thickness of formally electroneutral trans layers are kept fixed to 4 unit cells, whereas we test an increasing thickness for the cis-ordered part of the slab, from 2 to 6 unit cells, so as to examine the point of band inversion. Due to the increased number of atoms, we use a ()-R45∘ cell with respect to our above calculations. No atoms are frozen and we used cell dimensions of the trans anion arrangement (5.5395.608 Å in the xy-plane) and a constant vacuum of 12 Å along the surface normal. As mentioned above, we find the strain effect resulting from lattice mismatch between the two regions to be negligible.
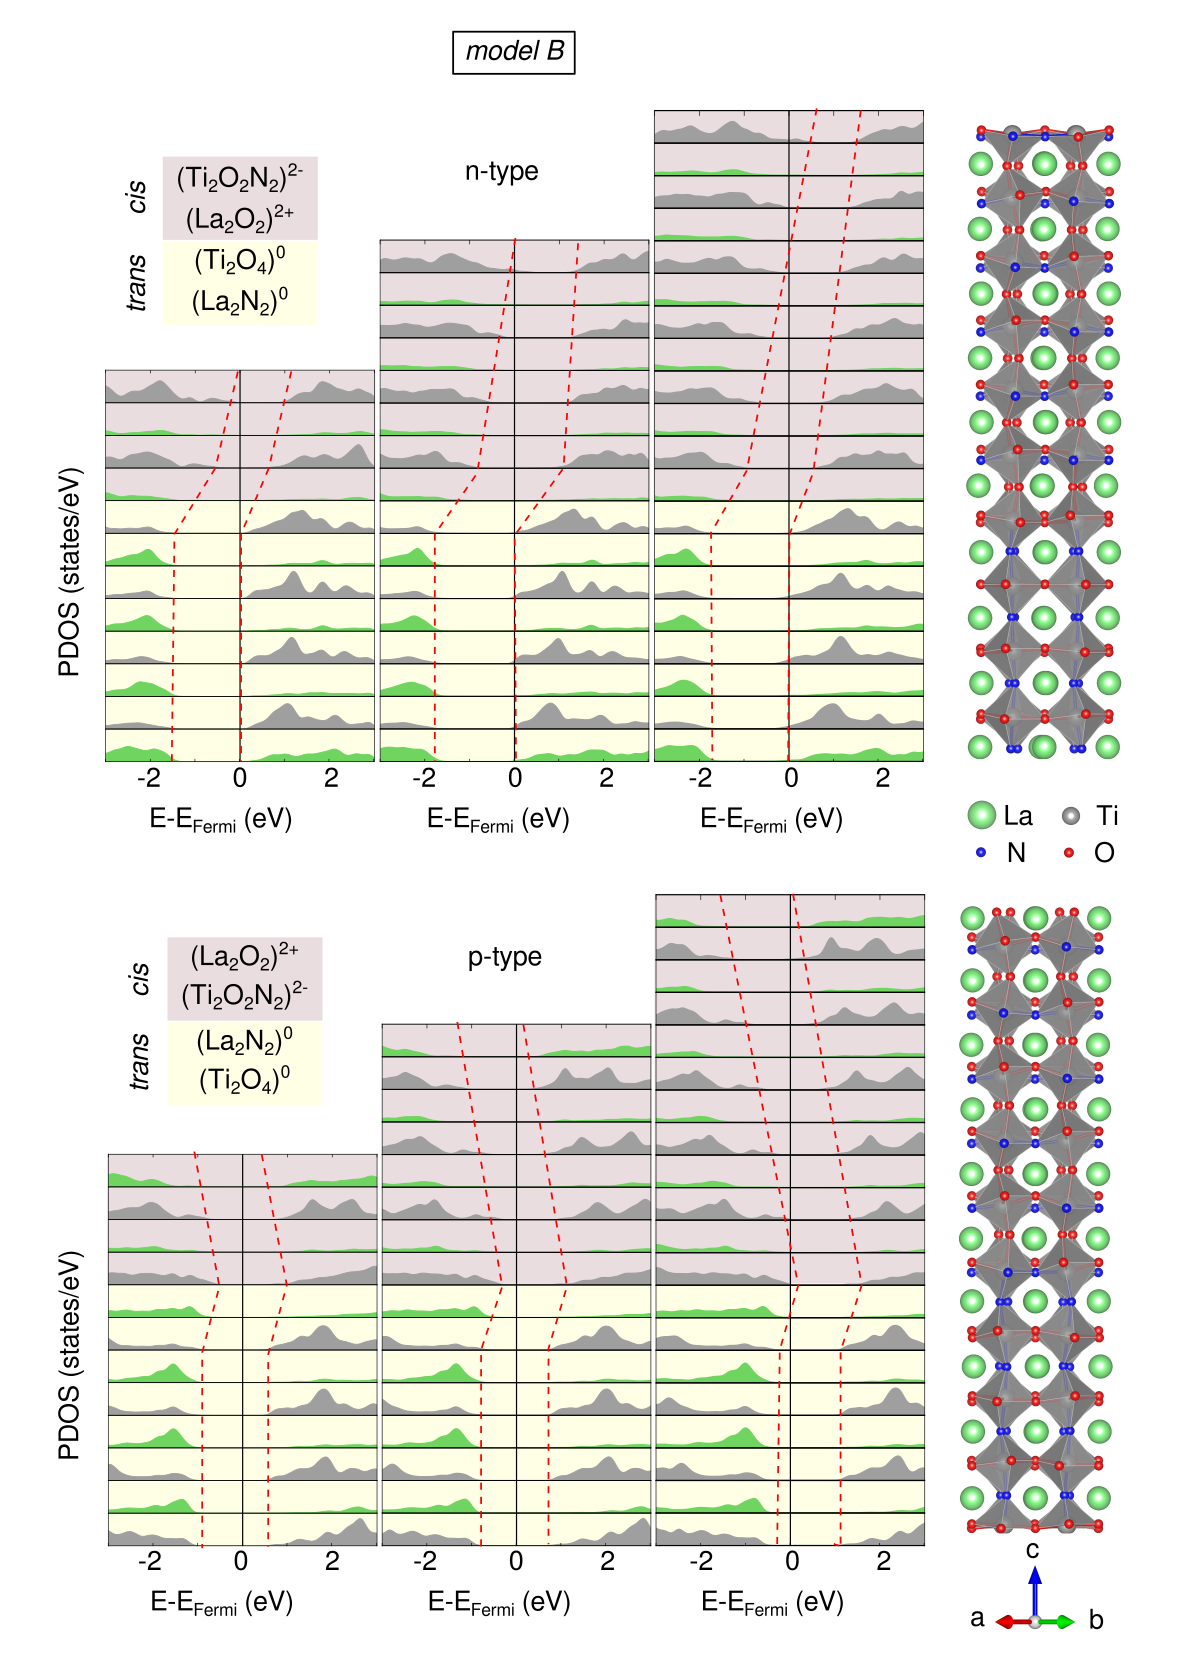
In Figure 6 we observe no charge transfers from the surface to the interface layers for a two unit-cell cis overlayer. In agreement with the LAO/STO interface already for four and even more so for six cis unit cells, we see hole doping of the surface and electron doping in Ti states in particular in layers below the interface. While the exact thickness of the 2DEG in n-type LAO/STO interfaces is still debated, there have been clear indications of it being hosted - at least partially - on interface Ti atoms.Pentcheva and Pickett (2006); Sing et al. (2009) In the present case, the 2DEG seems to be excluded from the very interface, which is possibly explained by changes in orbital energies due to polar distortions and octahedral rotations as outlined in the supporting information section S2. Conversely, in the p-type interface (Figure 6), we do not yet observe charge transfers for six cis unit cells. However for the largest thickness investigated here, the surface conduction band is already very close to the Fermi level, suggesting imminent charge transfers for further increased thickness of the cis layer. As shown in Figure S5, interfaces constructed from the less polar cis Model A do not reach the charge transfer state for the cis layer thickness studied here. This could be ascribed to the lower charge per atomic layer and we would expect it to need at least double the amount of cis unit cells compared to the more polar model B.
Conclusions
In the present study we investigate the formation of a polar/non-polar interface at the LaTiO2N (001) surface as a mechanism for surface stabilization. While the preferred bulk order is cis, the Ti-terminated surface is predicted to be stabilized by up to two non-polar trans layers. This effect is absent on the La-terminated surface, which we explain with different electronic reconstructions taking place in the two cases. We show that the overpotential for the oxygen evolution reaction is smaller on surfaces with this polar/non-polar interface compared to purely cis ordered surfaces. Finally we have shown that anion order with a trans bulk and a cis-ordered surface can lead to electronic reconstruction effects and electron accumulation at the interface similar to the LaAlO3/SrTiO3 interface.
Acknowledgements
We thank Claudine Noguera for helpful discussions. This research was funded by the SNF Professorship Grant . Calculations were performed on UBELIX (http://www.id.unibe.ch/hpc), the HPC cluster at the University of Bern.
References
- Ebbinghaus et al. (2009) S. G. Ebbinghaus, H. P. Abicht, R. Dronskowski, T. Müller, A. Reller, and A. Weidenkaff, Progress in Solid State Chemistry 37, 173 (2009).
- Takata et al. (2015) T. Takata, C. Pan, and K. Domen, Science and Technology of Advanced Materials 16, 033506 (2015).
- Ahmed and Xinxin (2016) M. Ahmed and G. Xinxin, Inorganic Chemistry Frontiers 3, 578 (2016).
- Kubo et al. (2017) A. Kubo, G. Giorgi, and K. Yamashita, Chemistry of Materials 29, 539 (2017).
- Clarke et al. (2002) S. J. Clarke, B. P. Guinot, C. W. Michie, M. J. C. Calmont, and M. J. Rosseinsky, Chemistry of Materials 14, 288 (2002).
- Yang et al. (2011) M. Yang, J. Oró-Solé, J. A. Rodgers, A. B. Jorge, A. Fuertes, and J. P. Attfield, Nature Chemistry 3, 47 (2011).
- Porter et al. (2014) S. H. Porter, Z. Huang, and P. M. Woodward, Crystal Growth & Design 14, 117 (2014).
- Goniakowski et al. (2007) J. Goniakowski, F. Finocchi, and C. Noguera, Reports on Progress in Physics 71, 016501 (2007).
- Ninova and Aschauer (2017) S. Ninova and U. Aschauer, Journal of Materials Chemistry A 5, 11040 (2017).
- Ohtomo and Hwang (2004) A. Ohtomo and H. Hwang, Nature 427, 423 (2004).
- Bengtsson (1999) L. Bengtsson, Physical Review B 59, 12301 (1999).
- Perdew et al. (1996) J. Perdew, K. Burke, and M. Ernzerhof, Physical Review Letters 77, 3865 (1996).
- Giannozzi et al. (2009) P. Giannozzi, S. Baroni, N. Bonini, M. Calandra, R. Car, C. Cavazzoni, D. Ceresoli, G. L. Chiarotti, M. Cococcioni, I. Dabo, A. Dal Corso, S. de Gironcoli, S. Fabris, G. Fratesi, R. Gebauer, U. Gerstmann, C. Gougoussis, A. Kokalj, M. Lazzeri, L. Martin-Samos, N. Marzari, F. Mauri, R. Mazzarello, S. Paolini, A. Pasquarello, L. Paulatto, C. Sbraccia, S. Scandolo, G. Sclauzero, A. P. Seitsonen, A. Smogunov, P. Umari, and R. M. Wentzcovitch, Journal of Physics: Condensed Matter 21, 395502 (19pp) (2009).
- Giannozzi et al. (2017) P. Giannozzi, O. Andreussi, T. Brumme, O. Bunau, M. B. Nardelli, M. Calandra, R. Car, C. Cavazzoni, D. Ceresoli, M. Cococcioni, N. Colonna, I. Carnimeo, A. D. Corso, S. de Gironcoli, P. Delugas, R. A. D. Jr, A. Ferretti, A. Floris, G. Fratesi, G. Fugallo, R. Gebauer, U. Gerstmann, F. Giustino, T. Gorni, J. Jia, M. Kawamura, H.-Y. Ko, A. Kokalj, E. Küçükbenli, M. Lazzeri, M. Marsili, N. Marzari, F. Mauri, N. L. Nguyen, H.-V. Nguyen, A. O. de-la Roza, L. Paulatto, S. Poncé, D. Rocca, R. Sabatini, B. Santra, M. Schlipf, A. P. Seitsonen, A. Smogunov, I. Timrov, T. Thonhauser, P. Umari, N. Vast, X. Wu, and S. Baroni, Journal of Physics: Condensed Matter 29, 465901 (2017).
- Vanderbilt (1990) D. Vanderbilt, Physical Review B 41, 7892 (1990).
- Anisimov et al. (1991) V. I. Anisimov, J. Zaanen, and O. K. Andersen, Physical Review B 44, 943 (1991).
- Monkhorst and Pack (1976) H. J. Monkhorst and J. D. Pack, Physical Review B 13, 5188 (1976).
- Momma and Izumi (2011) K. Momma and F. Izumi, Journal of Applied Crystallography 44, 1272 (2011).
- Guo et al. (2016) H. Guo, W. A. Saidi, J. Yang, and J. Zhao, Nanoscale 8, 6057 (2016).
- Nørskov et al. (2004) J. K. Nørskov, J. Rossmeisl, A. Logadottir, L. Lindqvist, J. R. Kitchin, T. Bligaard, and H. Jonsson, The Journal of Physical Chemistry B 108, 17886 (2004).
- Valdés et al. (2008) Á. Valdés, Z.-W. Qu, G.-J. Kroes, J. Rossmeisl, and J. K. Nørskov, The Journal of Physical Chemistry C 112, 9872 (2008).
- Ohtomo et al. (2002) A. Ohtomo, D. Muller, J. Grazul, and H. Y. Hwang, Nature 419, 378 (2002).
- Biscaras et al. (2010) J. Biscaras, N. Bergeal, A. Kushwaha, T. Wolf, A. Rastogi, R. C. Budhani, and J. Lesueur, Nature Communications 1, 89 (2010).
- Goniakowski and Noguera (2014) J. Goniakowski and C. Noguera, Journal of Physics: Condensed Matter 26, 485010 (2014).
- Wang et al. (2018) Y. Wang, H. Guo, Q. Zheng, W. A. Saidi, and J. Zhao, The Journal of Physical Chemistry Letters 9, 3049 (2018), pMID: 29767527.
- Oka et al. (2017) D. Oka, Y. Hirose, F. Matsui, H. Kamisaka, T. Oguchi, N. Maejima, H. Nishikawa, T. Muro, K. Hayashi, and T. Hasegawa, ACS Nano 11, 3860 (2017), pMID: 28347140, https://doi.org/10.1021/acsnano.7b00144 .
- Oka et al. (2014) D. Oka, Y. Hirose, H. Kamisaka, T. Fukumura, K. Sasa, S. Ishii, H. Matsuzaki, Y. Sato, Y. Ikuhara, and T. Hasegawa, Scientific Reports 4, 4987 (2014).
- Vonrüti and Aschauer (2018a) N. Vonrüti and U. Aschauer, Physical Review Letters 120, 046001 (2018a).
- Pentcheva and Pickett (2006) R. Pentcheva and W. E. Pickett, Physical Review B 74, 035112 (2006).
- Sing et al. (2009) M. Sing, G. Berner, K. Goß, A. Müller, A. Ruff, A. Wetscherek, S. Thiel, J. Mannhart, S. A. Pauli, C. W. Schneider, P. R. Willmott, M. Gorgoi, F. Schäfers, and R. Claessen, Physical Review Letters 102, 176805 (2009).
- Gazquez et al. (2017) J. Gazquez, M. Stengel, R. Mishra, M. Scigaj, M. Varela, M. Roldan, J. Fontcuberta, F. Sánchez, and G. Herranz, Physical Review Letters 119, 106102 (2017).
- Vonrüti and Aschauer (2018b) N. Vonrüti and U. Aschauer, Physical Review Materials 2, 105401 (2018b).
Supplementary information for
Anion-order driven polar interfaces at LaTiO2N surfaces
by
Silviya Ninova and Ulrich Aschauer
S1 Surfaces
In Table S1, we show the surface and anion exchange energies for La and Ti terminations of surfaces constructed from both model A and B as a function of the number of exchanged layers. While for the La-terminated surface, there is a continuous increase of the surface energy, independent of the model, the surface energy for the Ti-termination drops below that of the purely cis surface (0:4) for up to two exchanged layers (2:4). An analysis of the anion exchange energy without relaxation (E, Eq. S1) shows that only the Ti-terminated surface of model B favourably exchanges one layer of anions, while relaxation effects (Eionex) lead to the aforementioned preference for up to two exchanged layers for both models A and B.
| (S1) | |||||
| (S2) |
| Termination | trans:total | (J/m2) | (eV) | (eV) | |||
|---|---|---|---|---|---|---|---|
| (layers) | model A | model B | model A | model B | model A | model B | |
| La | 0:4 | 1.161 | 1.255 | - | - | - | - |
| 1:4 | 1.456 | 1.590 | 1.15 | 1.32 | 2.25 | 5.40 | |
| 2:4 | 1.612 | 1.776 | 1.75 | 2.06 | 4.53 | 8.87 | |
| 3:4 | 1.752 | 1.957 | 2.29 | 2.77 | 5.32 | 11.08 | |
| Ti | 0:4 | 1.145 | 1.448 | - | - | - | - |
| 1:4 | 0.930 | 0.997 | -0.84 | -1.78 | 0.09 | -0.12 | |
| 2:4 | 1.024 | 1.159 | -0.47 | -1.14 | 1.99 | 2.89 | |
| 3:4 | 1.196 | 1.511 | 0.20 | 0.25 | 3.09 | 5.68 | |
| Model | Termination | trans:total | (%)a | (%)a | sO (Å)b | sN (Å)b |
|---|---|---|---|---|---|---|
| model A | La | 0:4 | -3.2 | 3.9 | 0.288 | 0.170 |
| 1:4 | -4.2 | 4.3 | - | 0.105/0.119 | ||
| 2:4 | -3.2 | 3.8 | - | 0.100 | ||
| 3:4 | -2.8 | 3.4 | - | 0.091/0.114 | ||
| Ti | 0:4 | -9.6 | 5.2 | -0.258/-0.181/0.332 | 0.075 | |
| 1:4 | -8.6 | 4.7 | -0.158/-0.058/0.128/0.371 | - | ||
| 2:4 | -9.4 | 5.3 | -0.103/0.009/0.072/0.314 | - | ||
| 3:4 | -9.4 | 5.6 | -0.091/0.029/0.050/0.299 | - | ||
| model B | La | 0:4 | -7.1 | 4.6 | 0.387 | - |
| 1:4 | -2.8 | 4.8 | - | 0.132 | ||
| 2:4 | -1.3 | 4.0 | - | 0.114 | ||
| 3:4 | -1.1 | 3.4 | - | 0.105 | ||
| Ti | 0:4 | -7.0 | 5.6 | -0.338 | 0.208 | |
| 1:4 | -5.8 | 5.9 | -0.170/0.324 | - | ||
| 2:4 | -7.2 | 4.2 | -0.146/0.306 | - | ||
| 3:4 | -7.5 | 5.2 | -0.142/0.303 | - |
a The interplanar distances, , are calculated as the difference between the averaged topmost atomic layer heights with respect to the bulk value along that specific direction.
b The rumpling, s, is calculated as the difference along z between the O or N atoms and the plane formed by the metal ones.
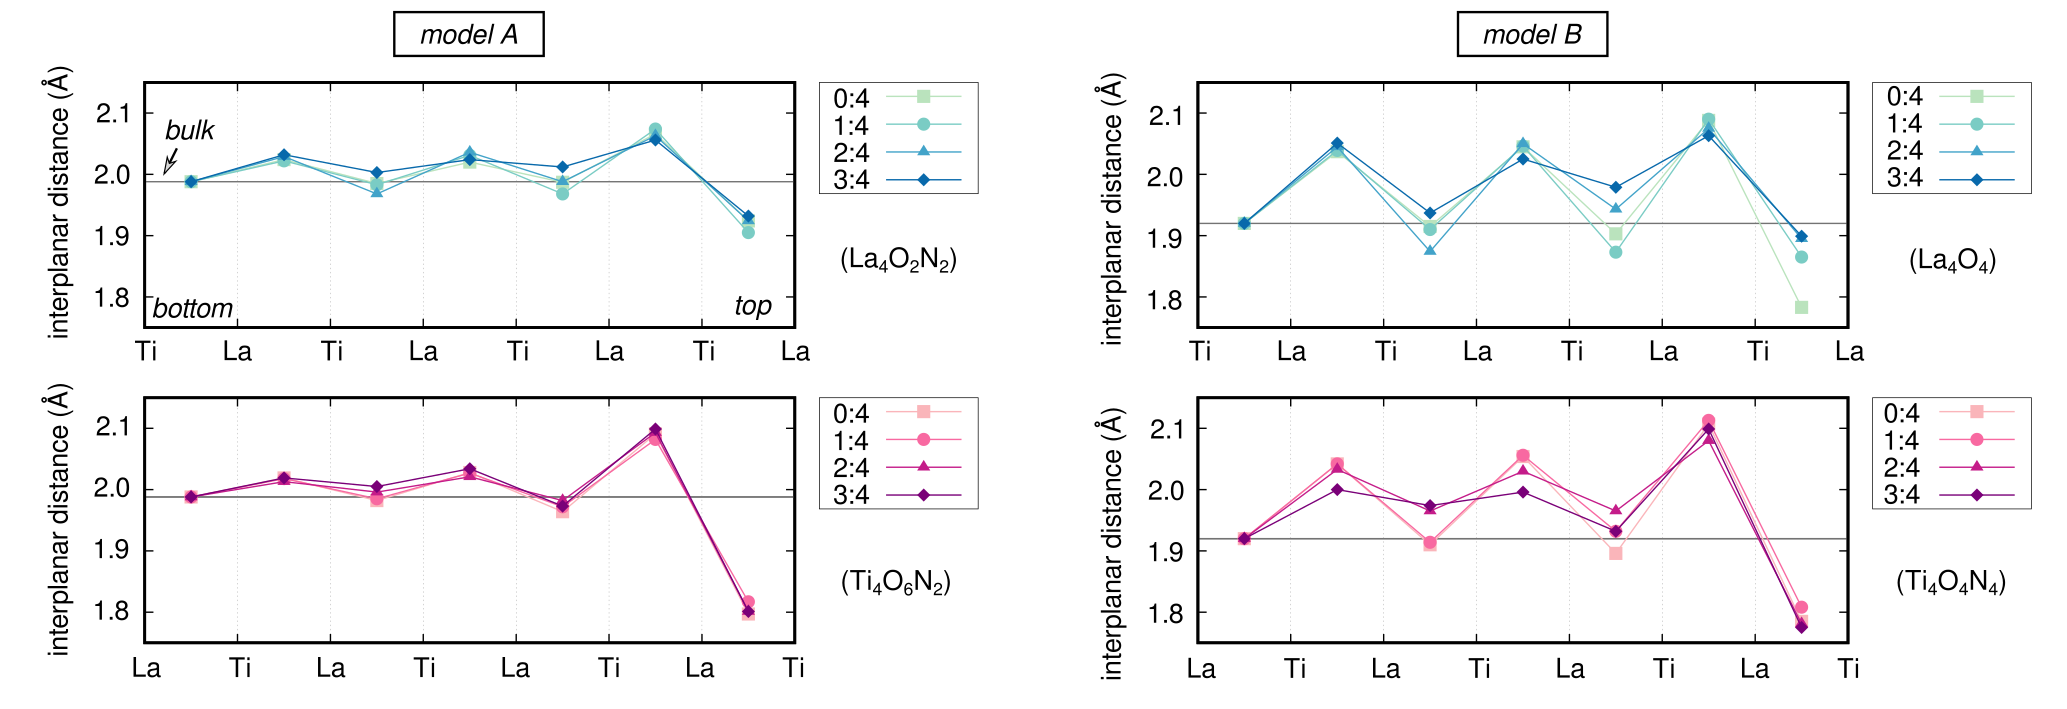
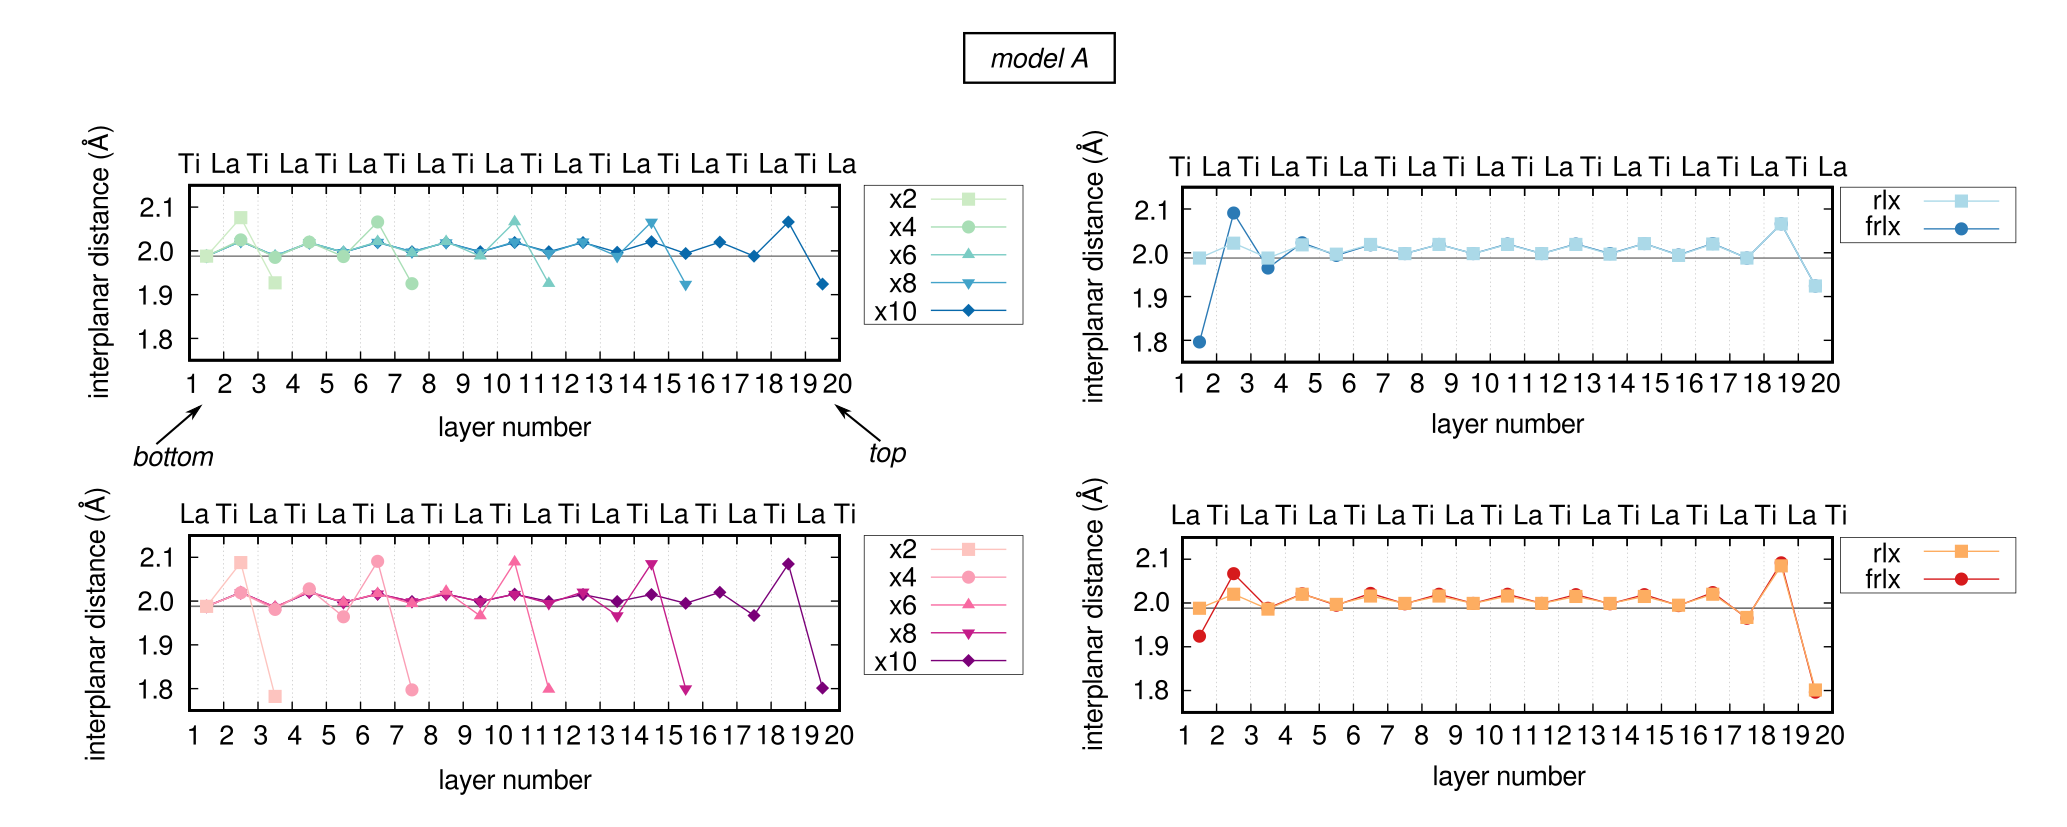
In Figure S1, we report the change of the interplanar distance as a function of the trans:total ratio for both terminations and both models. As we can see, model A has generally smaller changes in the interplanar distances compared to model B. In general we observe an inward relaxation of the surface layer, followed by an oscillating inwards/outwards relaxation sequence. While the La termination of Model A shows a systematic change as a function of the trans:total ratio going towards a more uniformly expanded surface without oscillations, the Ti termination shows no large changes. Model B surfaces in general show larger changes as a function of the trans:total ratio also moving from oscillatory to more uniformly expanded with increasing number of trans layers. The interplanar spacings between the first and second as well as second and third layer are numerically given in Table S2, along with the rumpling of oxygen and nitrogen atoms in the surface layer. In general, we see that the anion exchange decreases the rumpling in the surface layer.
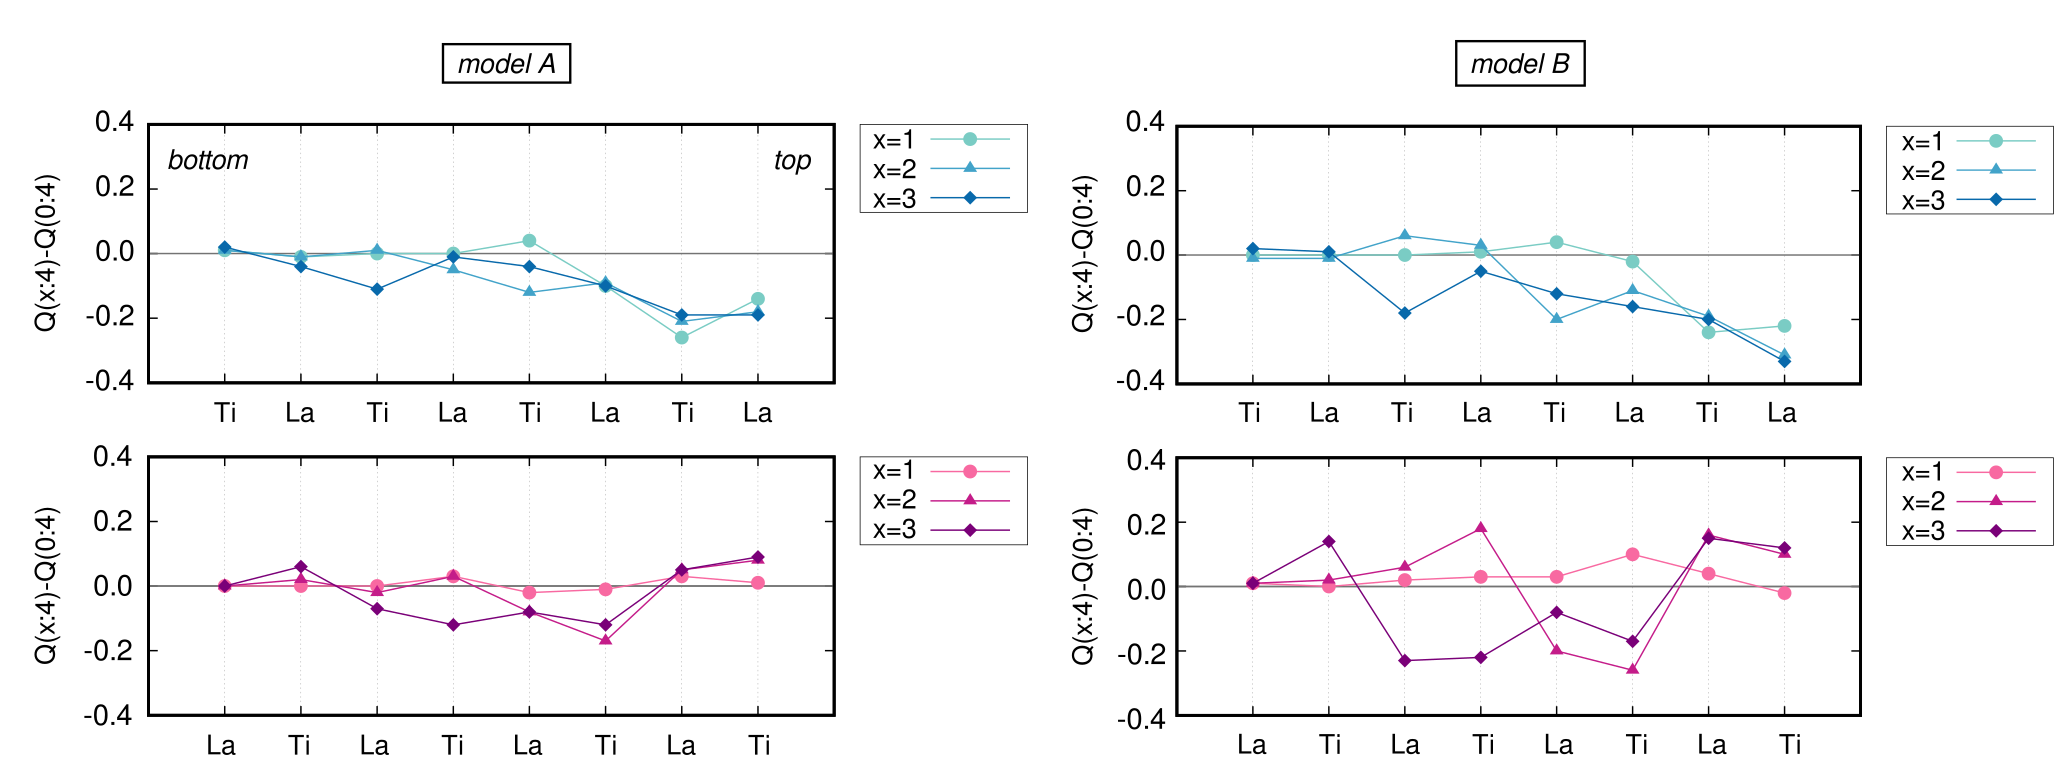
In Figure S2, we report the change in layer-averaged Löwdin charges upon anion exchange. While for the La terminated surfaces of both model A and B, we see a large negative change (electron accumulation) in the exchanged surface region, that steadily decreases towards the bottom of the slab, the Ti termination shows a completely different behaviour. Starting from two trans layers, we there see a positive change (hole accumulation) at the surface, followed by a negative region (electron accumulation) before becoming positive again. The lower boundary of this electron accumulation region shifts as a function of the number of exchanged layers. This is in line with the different electronic reconstruction observed for the two termination in the main text.
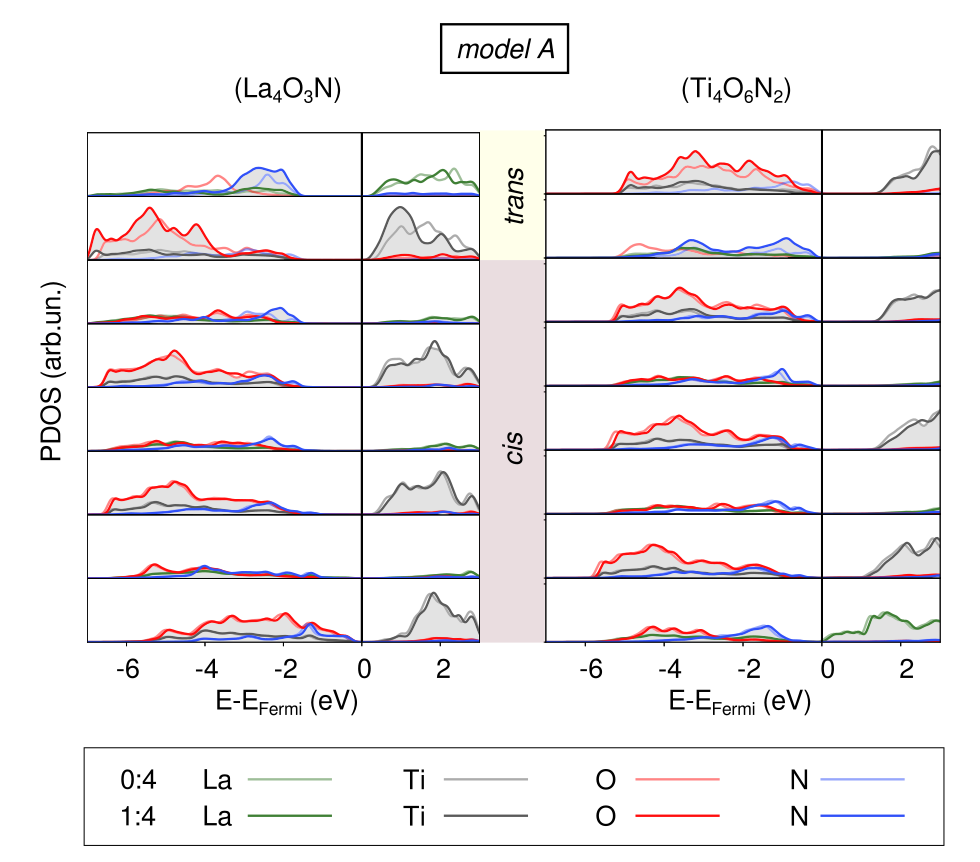
In Figure S3 we report the layer-resolved projected density of states for model A. The changes as a result of the different anion order at the topmost surface layer are similar to those observed in model B (see Figure 4 in the main text), however, pronounced to a lesser extent.
S1.1 Additional surface models
Here we present surface calculations obtained with slab models that have dimension -R45∘ with respect to the supercell used in the above calculations. The reduced lateral dimensions allows us to consider thicker slab models to verify if our main conclusions are affected by artefacts resulting from our slab setup (4x model used in the main text). As shown for Model A La- and Ti-terminated surfaces in the left column of Figure S4, the relaxation of the surface layer is not affected by the limited thickness of our slab as we observe an upwards shift of the same relaxation pattern at the surface and the underlying layers with increasing slab thickness. As shown in the right column of S4, keeping the bottom layer frozen does also not affect the relaxation pattern at the surface.
In Table S3, we show the anion exchange energies without () and with () relaxation for both Model A and B as well as the La and Ti termination. We consider slabs that have the asymmetric geometry with a fixed bottom layer as in our standard setup (asymm), an asymmetric slab, where the fixing of the bottom layer is omitted (frlxasymm) and a symmetric slab setup with one additional atomic layer at the bottom of the slab (symm). We can see that while for model A there is a large difference between the symmetric and asymmetric slabs without relaxation, this difference is reduced to almost nothing when the models are relaxed. We can thus see that the different slab setups lead to very similar for the different models and terminations, slight differences occurring for 3:4 ratios when the bottom of the slab is allowed to relax. More importantly though the slab setup does not affect our qualitative conclusions that only the Ti terminated surface has negative for up to two layers.
| E (eV) | Eionex (eV) | ||||||||
| trans:total | model A | model B | model A | model B | |||||
| Termination | (layers) | asymm | symm | asymm | asymm | frlxasymm | symm | asymm | frlxasymm |
| La | 1:4 | 2.25 | 2.70 | 5.40 | 1.15 | 1.15 | 1.01 | 1.32 | 1.48 |
| 2:4 | 4.53 | 4.51 | 8.87 | 1.75 | 1.76 | 1.57 | 2.06 | 2.30 | |
| 3:4 | 5.32 | 6.44 | 11.08 | 2.29 | 2.11 | 2.12 | 2.77 | 2.59 | |
| Ti | 1:4 | 0.09 | 1.84 | -0.12 | -0.84 | -0.83 | -0.82 | -1.78 | -1.86 |
| 2:4 | 1.99 | 3.48 | 2.89 | -0.47 | -0.52 | -0.39 | -1.14 | -1.29 | |
| 3:4 | 3.09 | 5.38 | 5.68 | 0.20 | 0.12 | 0.24 | 0.25 | -1.08 | |
In order to evaluate if the proximity of the frozen bottom layer or the small thickness of the slab could have an effect on the observed , we repeat the calculations for model A also with a thicker 6-layer slab. The results shown in Table S4, show that the results are qualitatively and even quantitatively the same, only the Ti termination having negative for up to two trans layers at the surface. We thus conclude that the slab setup used in the main text has no effect on our conclusions as the same results are obtained with thicker or differently constructed slabs.
| Termination | Mixing ratio | model A | |
|---|---|---|---|
| Mixing ratio | (J/m2)a | Eionex (eV) | |
| La | 0:6 | 1.115 | - |
| 1:6 | 1.408 | 1.14 | |
| 2:6 | 1.570 | 1.77 | |
| 3:6 | 1.708 | 2.31 | |
| 4:6 | 1.847 | 2.84 | |
| 5:6 | 1.974 | 3.34 | |
| Ti | 0:6 | 1.104 | - |
| 1:6 | 0.891 | -0.82 | |
| 2:6 | 0.983 | -0.47 | |
| 3:6 | 1.123 | 0.07 | |
| 4:6 | 1.267 | 0.64 | |
| 5:6 | 1.436 | 1.29 | |
S2 Polar interface
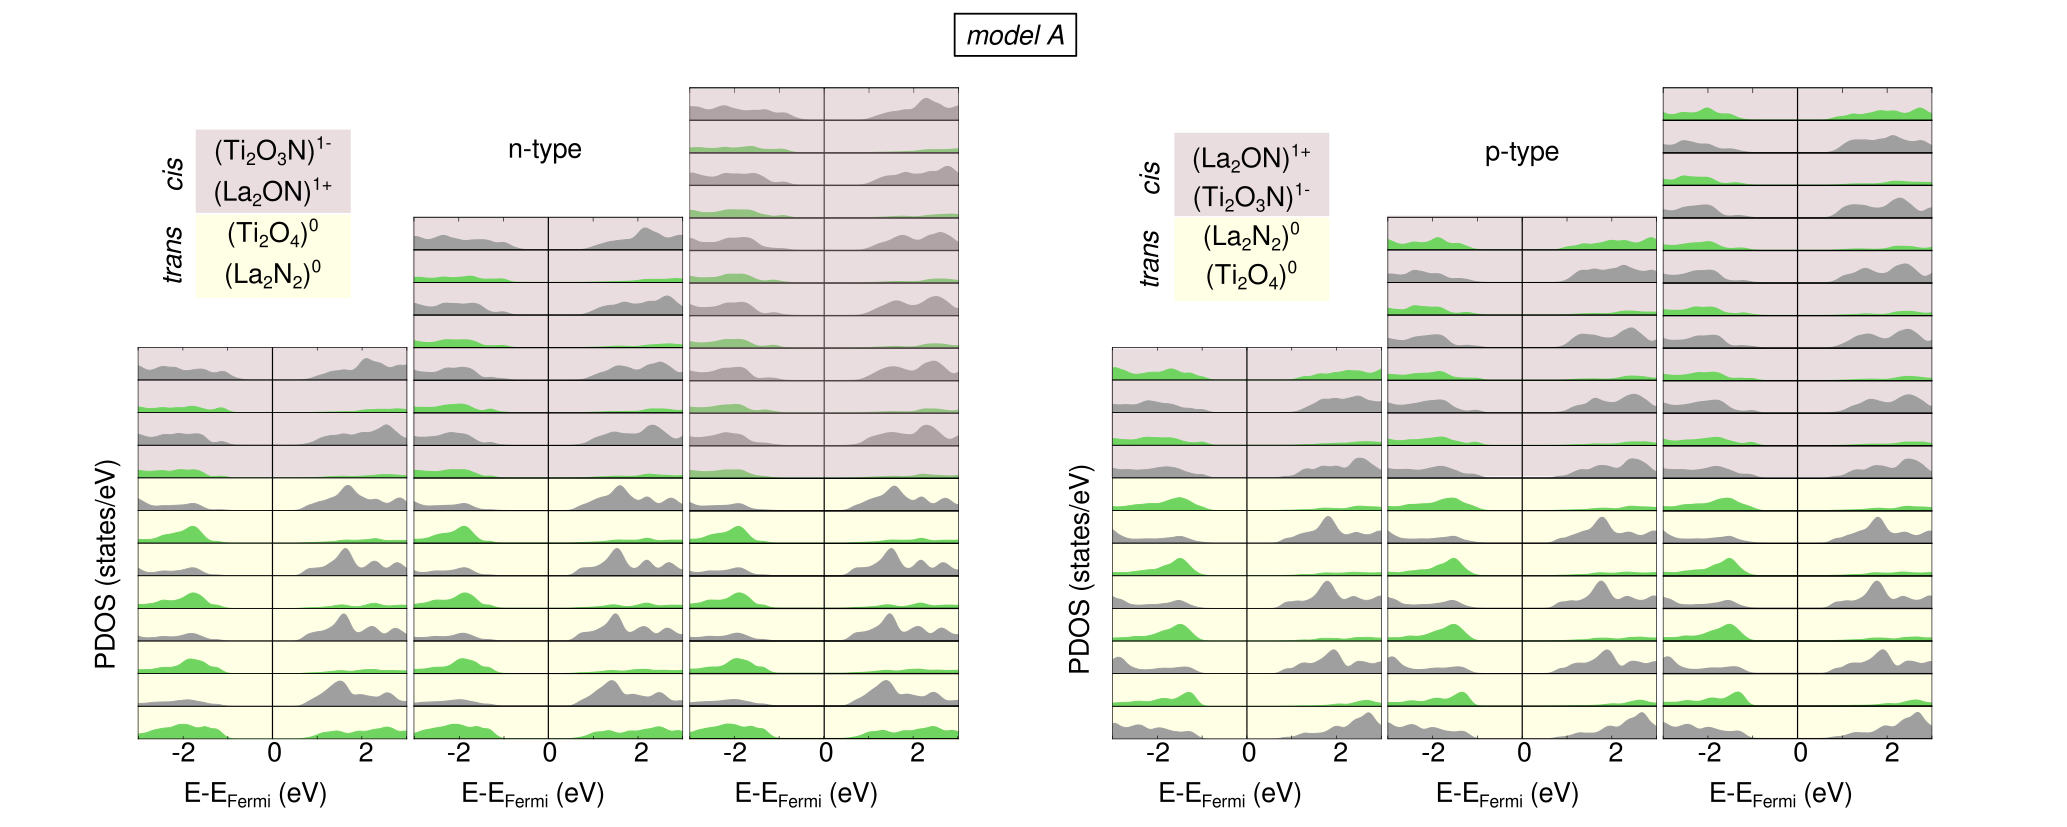
In Figure S5 we show the layer-resolved projected density of states of the polar interfaces constructed from model A bulk. The polarity in this model is weaker and it fails to reach band-inversion and electron/hole doping of the interface for the overlayer thicknesses investigated here.
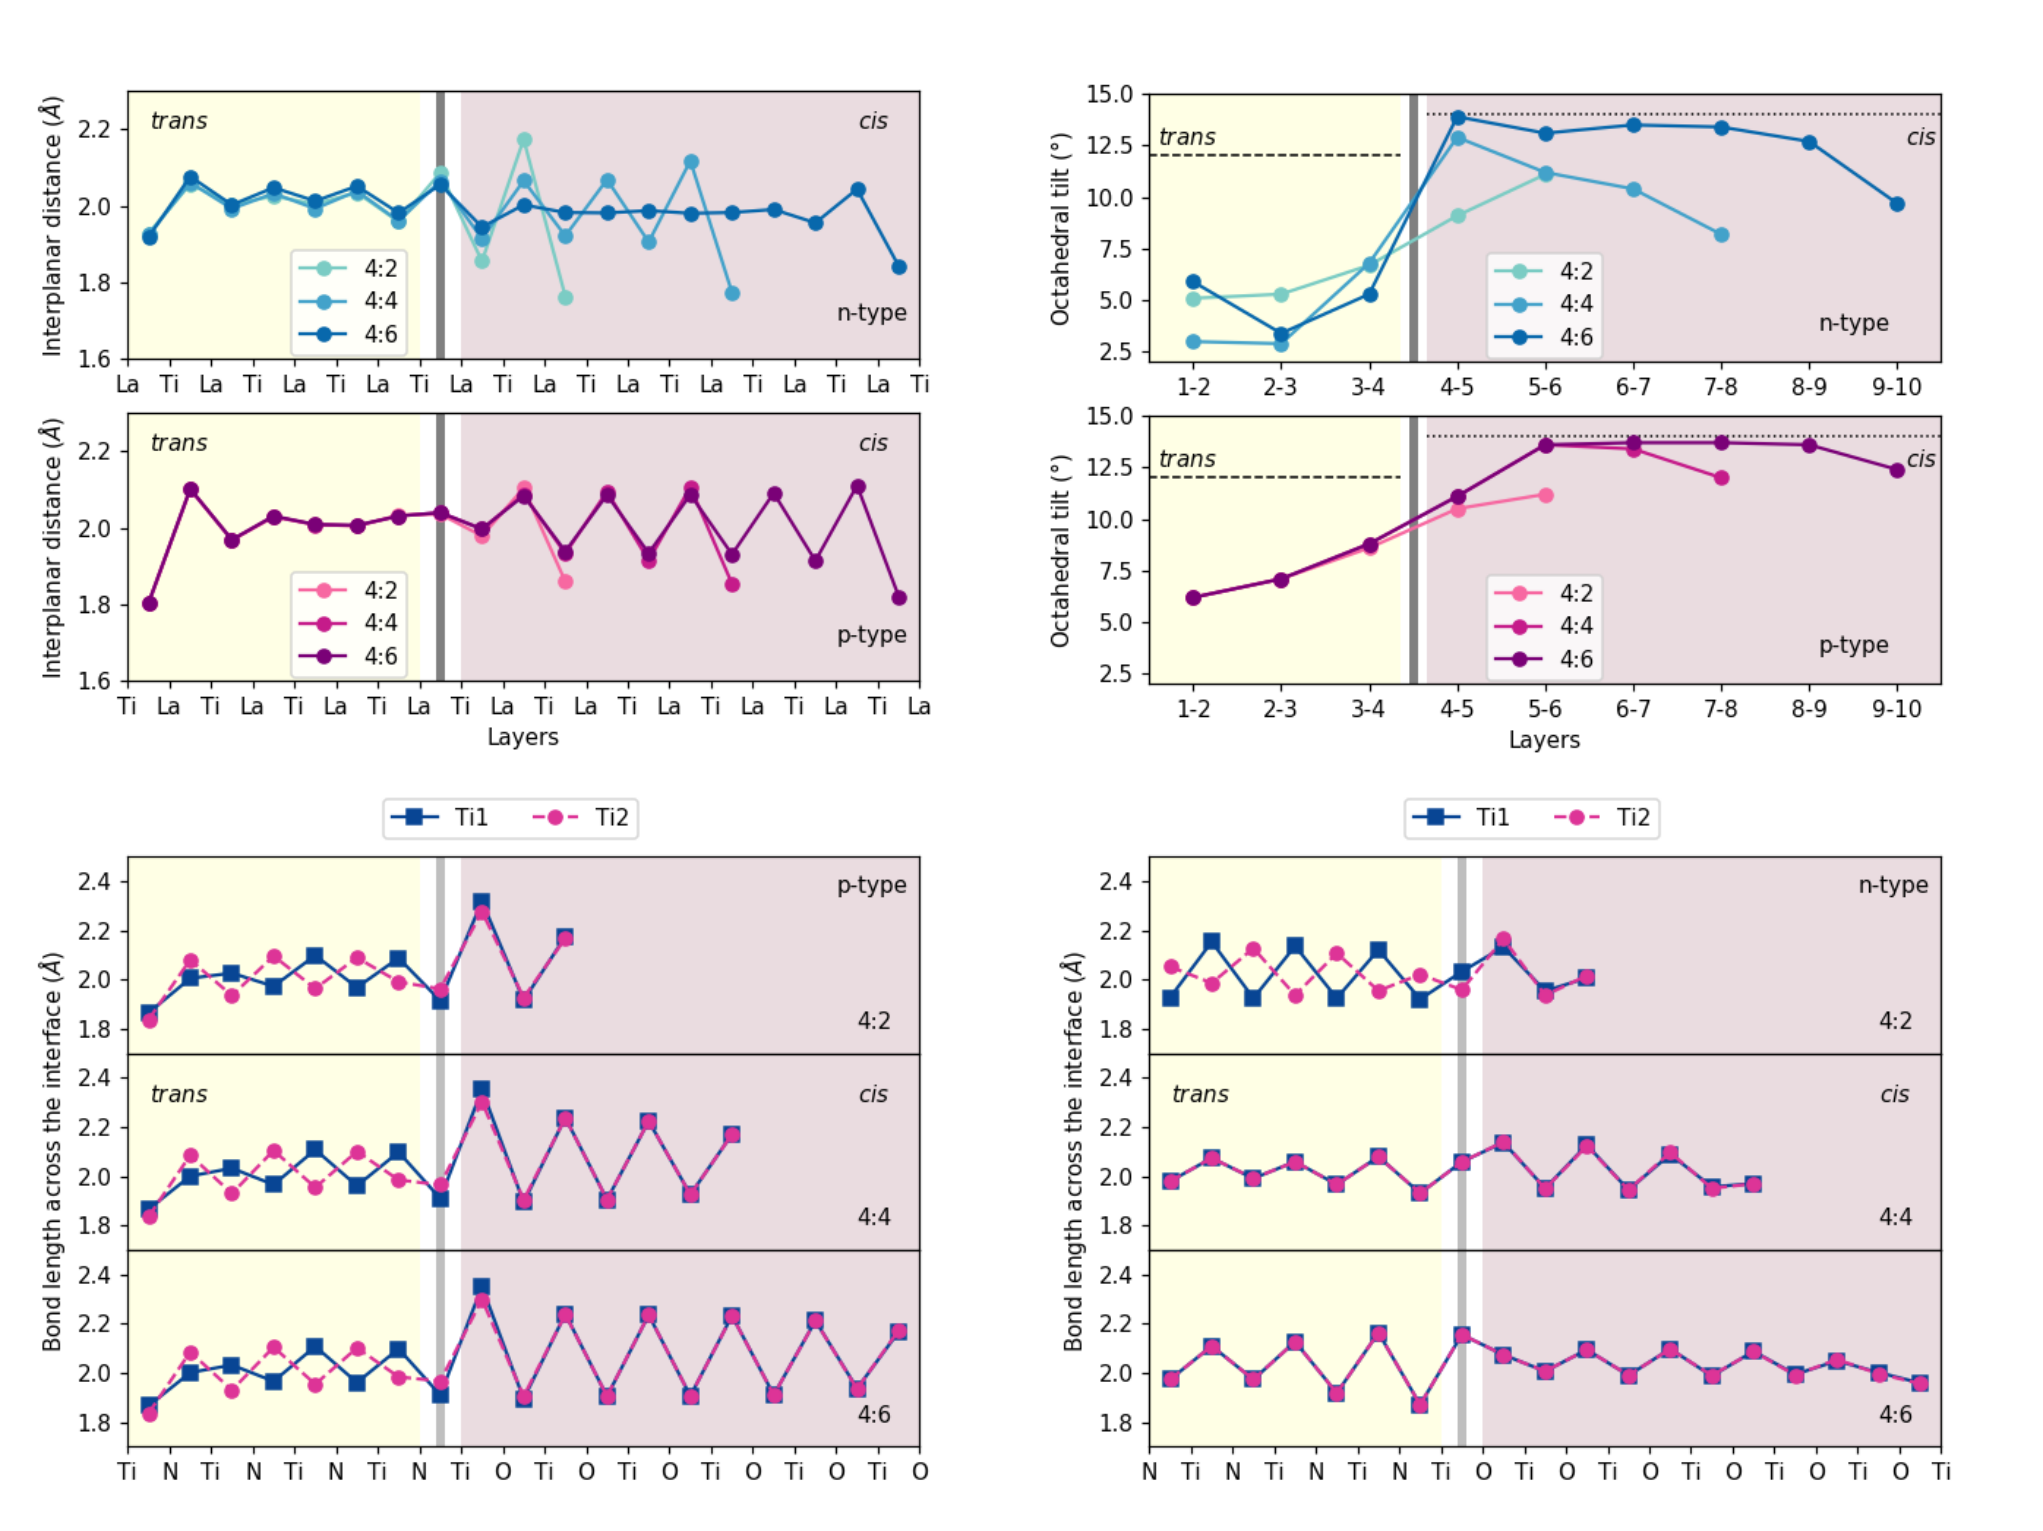
In Figure S6, we analyze the geometry of the model B interfaces in terms of interlayer spacings, octahedral tilts and Ti-X bond lengths along the interface normal direction. In terms of inter-layer spacings, both the n- and p-type interface show strong oscillations in the polar cis part of the slab for thin overlayers. Interestingly though, these oscillations completely disappear once the slab becomes solidly metallic for the 4:6 n-type interface. We see in general strongly suppressed octahedral rotations in the trans part of the interface compared to the corresponding bulk value. For the n-type interface the bulk tilt angle is only recovered for the metallic 4:6 slab, whereas for the p-type interface a bulk-like structure is already recovered for the 4:4 slab. Besides changes in octahedral rotation magnitudes, we also observe a favoring of in-phase octahedral rotations around the interface normal direction in the trans part of the slab, which is complete for the n-type and partial for the p-type interface.
Similarly to other oxide interfaces, the strong suppression of octahedral tilts in the non-polar part of the interface can lead to the appearance of polar distortions to optimise bonding in the perovskite structure.Gazquez et al. (2017) We see these polar distortions emerging as strong oscillations of the Ti-X bond lengths, where up- and down-oriented bonds of the same Ti differ by about 0.24Å. Such polarity was also seen in the trans-ordered bulk.Vonrüti and Aschauer (2018b) For all p-type interfaces as well as the 4:2 n-type interface we observe opposite displacements of Ti-X bonds for different Ti in the same layer. This implies an anti-ferroelectric type distortion, which will however have a similar effect on orbital energies as a purely ferroelectric one observed in n-type 4:4 and 4:6.
library.bib