Vol.0 (200x) No.0, 000–000
22institutetext: Key Laboratory of Modern Astronomy and Astrophysics, Nanjing University, China
33institutetext: Department of Physics, The University of Hong Kong, Hong Kong SAR, China
44institutetext: Laboratory for Space Research, The University of Hong Kong, Hong Kong SAR, China
55institutetext: School of Physics and Astronomy, Sun Yat-sen University, Guangzhou 510275, China
Searching for GeV gamma-ray emission from the bulge of M31
Abstract
The three major large-scale, diffuse -ray structures of the Milky Way are the Galactic disk, a bulge-like GeV excess towards the Galactic center, and the Fermi bubble. Whether such structures can also be present in other normal galaxies remains an open question. M31, as the nearest massive normal galaxy, holds promise for spatially-resolving the -ray emission. Based on more than 8 years of Fermi-LAT observations, we use (1) disk, (2) bulge, and (3) disk-plus-bulge templates to model the spatial distribution of the -ray emission from M31. Among these, the disk-plus-bulge template delivers the best-fit, in which the bulge component has a TS value 25.7 and a photon-index of , providing strong evidence for a centrally-concentrated -ray emission from M31, that is analogous to the Galactic center excess. The total 0.2–300 GeV -ray luminosity from this bulge component is , which would require millisecond pulsars, if they were the dominant source. We also search for a Fermi bubble-like structure in M31 using the full dataset (pass8), but no significant evidence is found. In addition, a likelihood analysis using only photons with the most accurate reconstructed direction (i.e., PSF3-only data) reveals a 4.8 point-like source located at 10 kpc to the northwest of the M31 disk, with a luminosity of and a photon-index of . Lacking of a counterpart on the southeast side of the disk, the relation between this point-like source and a bubble-like structure remains elusive.
keywords:
gamma-rays: galaxies–galaxies: individual (M31)1 Introduction
The Fermi Gamma-ray Space Telescope, with its principle instrument, the Large Area Telescope (LAT; Atwood et al. 2009), has revolutionized our view of the -ray ( GeV) sky since its launch in 2008. In particular, GeV -ray emissions have been detected for the first time from a handful of nearby galaxies with moderate to strong star formation activities, such as the Small Magellanic Cloud (SMC; Abdo et al. 2010a), Large Magellanic Cloud (LMC; Abdo et al. 2010b, Ackermann et al. 2016), M 31 (Abdo et al. 2010d, Ackermann et al. 2017), M 82, NGC 253 (Abdo et al. 2010c), NGC 4945 (Ackermann et al. 2012a), NGC 1068 (Ackermann et al. 2012a), NGC 6814 (Ackermann et al. 2012b), NGC 2146 (Tang et al. 2014) and Arp 220 (Peng et al. 2016). Abdo et al. (2010d) found a tight correlation between the -ray ( GeV) luminosity and the star formation rate, strongly suggesting that the GeV emission is dominated by the interaction between the cosmic-rays (CRs) and the interstellar medium (ISM). Supernova remnants are generally thought to be the primary accelerators of CRs with energies up to eV. The CR hadrons can collide with the ISM to produce neutral pions, which subsequently decay into -ray photons. Leptonic processes such as inverse-Compton and bremsstrahlung of CR electrons may also contribute to the detected -ray emission (e.g., Strong et al. 2010).
To better understand the production and transportation of CRs in galactic environments, it is desirable to spatially resolve the CR-induced, presumably diffuse -ray emission. However, due to the limited angular resolution of Fermi-LAT, only the nearest galaxies hold promise for such a purpose. For instance, the Magellanic Clouds have been reported to show extended GeV emission (Abdo et al. 2010a, Abdo et al. 2010b, Ackermann et al. 2016). Located at a distance of 780 kpc (Stanek & Garnavich 1998), the Andromeda galaxy (M31) is perhaps the only massive external galaxy that currently permits a spatially-resolved study with the Fermi-LAT. Indeed, with an inclination angle of 78∘, the HI disk of M31 spans 3.2\degr1\degr on the sky, which makes M31 a potentially resolvable source to the Fermi-LAT (LAT’s single-photon resolution, FWHM 0.8∘, for a 1 GeV photon).
The -ray emission from M31 has been the focus of various recent works (e.g. Abdo et al. 2010d, Li et al. 2016, Pshirkov et al. 2016). Using the first two years LAT pass6 data, Abdo et al. (2010d) first detected the GeV emission from M31, which is spatially correlated with the IRAS 100 m image, a good tracer of the neutral gas primarily located in the disk of M31. Pshirkov et al. (2016), who used 7-year LAT data, claimed a detection of halo structures similar to the Fermi bubbles in our Galaxy (Su et al. 2010). In particular, Pshirkov et al. (2016) adopted a template of two 0.45-radius uniform circular disks, which are symmetrically located perpendicular to the M31 disk, and derived a total GeV luminosity of (3.20.6) from these two disks. Bird et al. (2015) studied the -ray emission from M31 using VERITAS observations and 6.5-year pass7 data of Fermi-LAT. Their 54-hour VERITAS observations had resulted in an upper limit of the -ray flux above 100 GeV, while their Fermi-LAT spectrum suggested a turnover below 1 GeV.
More recently, Ackermann et al. (2017) performed a detailed morphological analysis using GeV photons detected by Fermi-LAT in the first 7 years. They tested different morphological representations of M31: a central point source, a Herschel map, a Spitzer map, a neutral hydrogen column density map, a projected uniform circular disk on the sky, a projected elliptical disk, a Gaussian disk, and an elliptical Gaussian disk. As the authors admit, it remains inconclusive to give the best spatial template statistically. For simplicity, a uniform circular disk (as projected on the sky) was adopted as the spatial model of M31 by Ackermann et al. (2017). They also concluded that the GeV emission of M31 might be more confined to the inner regions than a uniform circular disk template would predict. They suggested that the emission is not correlated with regions rich in gas or star formation activity, and gave an alternative and non-exclusive interpretation that the emission results from a population of millisecond pulsars(MSPs) dispersed in the bulge and disk of M31 by disrupted globular clusters or from the decay/annihilation of dark matter particles, as an analogy to what have been proposed to account for the Galactic center excess found by Fermi-LAT.
In the Milky Way, GeV excess in the Galactic center has been extensively examined (Zhou et al. 2015, Calore et al. 2015, Ajello et al. 2016, Daylan et al. 2016). There are mainly two explanations for this excess: the dark matter (DM) annihilation scenario and the astrophysical scenario, the latter one usually involving unresolved MSPs. Hooper et al. (2013) have performed a series of work on the DM annihilation origin of Galactic center -ray excess. They argued that the millisecond pulsar scenario cannot explain all the excess emission, and the argument seems to have received support from a detailed study of the MSPs in Galactic globular clusters (Hooper & Linden 2016). However, the alternative, astrophysical scenario has gained more support from various groups over the recent years: the scenario including the Galactic center CRs (Cholis et al. 2014), the MSPs in the bulge (Yuan & Zhang 2014), and the disrupted globular clusters (Brandt et al. 2015). Yang et al. (2016) noted that the GeV excess in Galactic center shows no spherical symmetry, but rather a bipolar distribution, which may indicate an astrophysical origin. Most recently, Macias et al. (2018) explained the excess with the X-shaped stellar bulge and the nuclear bulge in the Galactic center, and strongly preferred an astrophysical origin rather than a DM origin.
Since the -ray photons are optically thin in the Fermi’s eye, the Galactic plane is a projection of 3D distribution of -ray emission. It would reveal more information if one could measure this excess from a location outside of the Milky Way. A GeV excess from the center of M31 (analogous to the excess towards the Galactic Center), if present could also be potentially detected by Fermi. In this work, we specifically search for such an excess towards the M31 center, which we refer to as a bulge component. We utilize more than 8-year Fermi-LAT data to provide further insight on the origin of GeV emission from M31. Our data reduction procedure and analysis are presented in Sect. 2. We discuss the possible origins of the -ray emission from M31 in Sect. 3, and summarize our study in Sect. 4.
2 Observations and data analysis
2.1 Data preparation
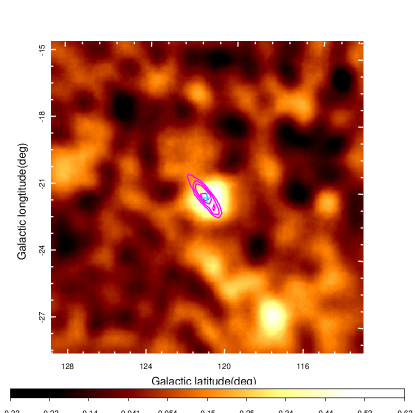
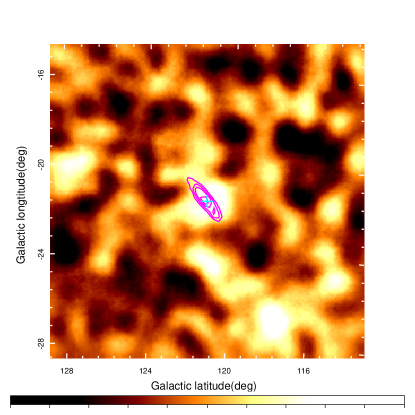
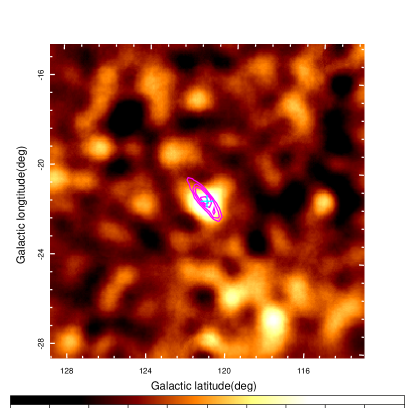
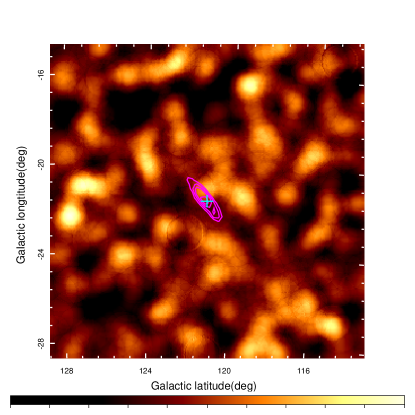
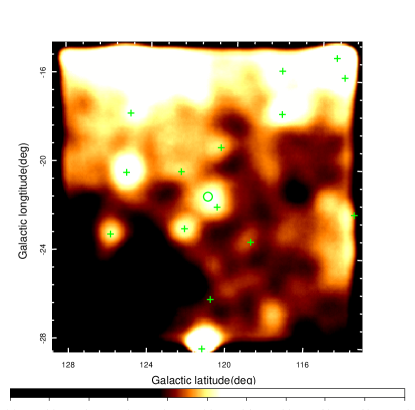
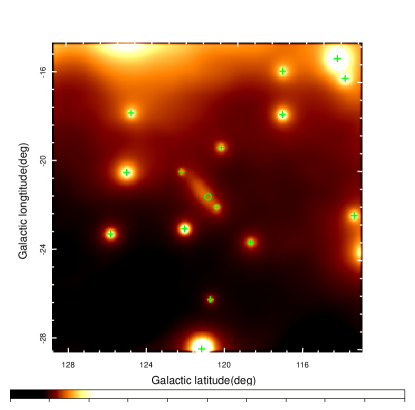
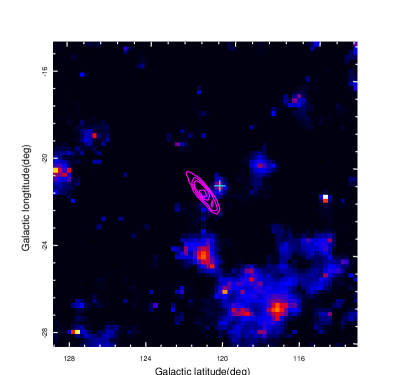
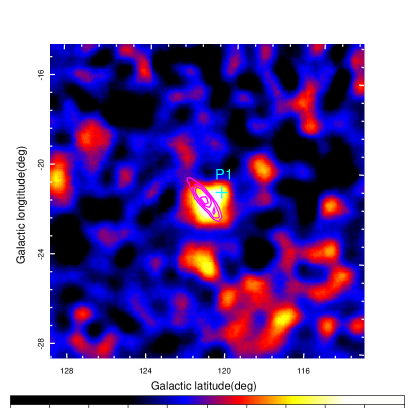
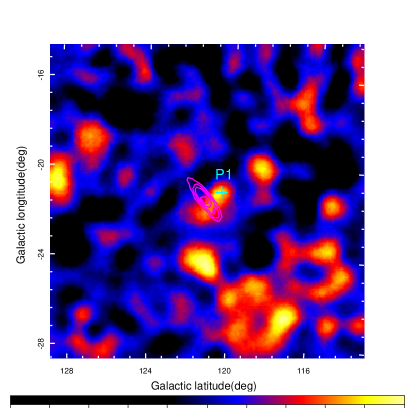
Our analysis is based on the data taken by the Fermi-LAT between August 8, 2008 and October 7, 2016, over a period of more than 8 years. The Fermi Science Tools v10r0p5 is used in our analysis, and the data used here are restricted to the ones with zenith angles 100, and within the time intervals when the satellite rocking angle was less than 52. We include all the GeV events within a rectangular region of interest (ROI), with a size of 14 14 centered at M31 [RA, DEC] = [00h42m44.3s, 41\degr16\arcmin09\arcsec] (see Figure 1). Our background model includes the 3FGL catalog sources (95 sources within a radius of 20 from the center of M31), the Galactic diffuse emission (), and the isotropic emission (), using the user-contributed make3FGLxml.py tool. The adopted instrument response function (IRF) is .
2.2 Analysis
2.2.1 Spatial models of M31
As we are most interested in distinguishing the physical regions from where the observed -ray emission is produced, we use three spatial templates to model the -ray emitting region of M31: the disk only, the bulge only and the disk+bulge templates. Assuming a hadronic origin, we employ the IRAS 100 m image as the spatial model for the disk component in both the disk and disk+bulge templates, where IRAS 100 m is a good tracer of the neutral gas. We use a power law as the spectral model for the disk component. During the analysis, we set free the spectral parameters of M31 and any 3FGL sources with a distance to M31 of 10, we also set free the normalization parameters of Galactic diffuse emission and isotropic background emission. Positions of the background sources are fixed to those given in the 3FGL catalog.
A point source was employed to model the bulge component in both the bulge and the bulge+disk templates. In principle, the bulge component should be extended, if the -ray emission predominantly arises from stellar populations and/or dark matter. Due to the small spatial extension of the M31 bulge, i.e., a high-light radius of 1 kpc, or 4 is suggested by (Dong et al. 2015), a point source spatial model could perform well to represent the -ray emission from the bulge by LAT. We note that the central super-massive black hole in M31 is currently extremely quiescent (Li et al. 2011), thus no significant -ray emission from an AGN is expected.
We use power law as the spectral model for the bulge template. As seen in Table LABEL:tab:test, at an energy band of 0.2–300 GeV, the best fit position of M31 is [RA, DEC] = [10.7806, 41.2741] with error radius0.09, and the optical center of M31 of [RA, DEC] = [10.6847, 41.2687] is well within such an error circle, see Figure 2 (top right, the green circle). We notice that Ackermann et al. (2017) did the same test in an energy band of 1GeV. Using their energy selection, we found a best fit position of M31 as [RA, DEC] = [10.8466, 41.2223], with a radius of error circle 0.0769, and the optical center of M31 is slightly outside this error circle (see Figure 2, top right, the white circle), which agree with Ackermann et al. (2017). In the following analysis, we fix the point source to be the center of M31.
Figure 3 shows the GeV background-subtracted counts maps derived with the different spatial models of M31, and all maps are overlaid with IRAS 100 m intensity contours. Emission from M31 is clearly visible (top left panel in Figure 3). At a glance, all three spatial models lead to a reasonable characterization of M31 (other panels in Figure 3).
To further evaluate the goodness of different templates, we examine the log(likelihood) (denoted by log in the following) of each fitting, to find the maximum likelihood goodness-of-fit. We note that the background model, i.e., excluding any components of M31, gives log = -501420. Taking this as the fiducial value, an increase in log when one adds a source model component (i.e., M31) indicates a more significant improvement of the fit (Ackermann et al. 2017). As seen in table LABEL:tab:pass8, log of the disk, bulge and disk+bulge spatial template is -501389, -501400 and -501383, respectively. This suggests that the disk+bulge template is more favored with a significance . All three templates predict similar 0.2-300 GeV luminosities. The significance of each spatial component is expressed by a test statistic (TS) value, . In the fitting results of the disk+bulge template, , , which strongly suggests the detection of the bulge emission from M31.
To compare with the uniform disk template used by Ackermann et al. (2017), we also test the uniform disk template. The difference of log(likelihood) between the best-fitted uniform disk template (radius ) and the disk+bulge template is not significant () for 1–300 GeV data. For comparison, Ackermann et al. (2017) declared a uniform disk with radius best fitted the data. We also test the uniform disk model with 0.2–300 GeV data, which has a best-fit radius of and a similar significance. However this might be due to the energy-dependent PSF. We note that compared the uniform disk model, the disk+bulge template is more physically motivated.

| Spatial model | Composition | TS value | log | |||
| () | () | |||||
| (1) | (2) | (3) | (4) | (5) | (6) | (7) |
| disk | IRAS 100m | 2.310.09 | 4.600.56 | 4.00.52 | 107.87 | -501389 |
| bulge | 2.550.11 | 3.010.40 | 2.160.29 | 82.90 | -501400 | |
| disk+bulge | IRAS 100m | 2.22 0.13 | 2.450.24 | 2.480.32 | 33.40 | -501383 |
| bulge | 2.57 0.17 | 1.830.26 | 1.160.14 | 25.70 | - | |
| disk + | IRAS 100m | 2.260.09 | 3.860.59 | 0.55 | 83.63 | -501378 |
| P1 | 2.320.18 | 1.120.41 | 0.970.27 | 23.23 | - | |
| bulge+ | bulge | 2.510.12 | 2.900.54 | 0.30 | 66.77 | -501379 |
| P1 | 2.300.20 | 1.090.45 | 0.970.20 | 23.20 | - | |
| disk + bulge+ P1 | IRAS 100m | 2.180.13 | 2.120.52 | 2.330.56 | 27.86 | -501373 |
| bulge | 2.510.18 | 1.530.46 | 1.010.27 | 17.68 | - | |
| P1 | 2.290.19 | 1.040.40 | 0.940.25 | 22.06 | - |
| spatial model | composition | TS value | log | |||
| () | () | |||||
| (1) | (2) | (3) | (4) | (5) | (6) | (7) |
| disk | IRAS 100m | 2.360.14 | 4.780.75 | 3.880.78 | 62.48 | -213378 |
| bulge | 2.710.17 | 3.610.63 | 2.010.34 | 55.02 | -213374 | |
| disk+bulge | IRAS 100m | 2.06 0.3 | 1.6 0.69 | 2.300.40 | 26.76 | -213371 |
| bulge | 2.76 0.22 | 2.69 0.24 | 1.420.1 | 10.38 | - | |
| disk+P1 | IRAS 100m | 2.26 0.15 | 3.89 0.80 | 3.660.85 | 46.45 | -213366 |
| P1 | 2.52 0.26 | 1.66 0.63 | 1.090.33 | 19.60 | - | |
| bulge+ P1 | bulge | 2.64 0.18 | 2.990.60 | 1.750.34 | 41.92 | -213366 |
| P1 | 2.46 0.26 | 1.48 0.56 | 1.040.32 | 17.77 | - | |
| disk + bulge+ P1 | IRAS 100m | 2.010.20 | 1.440.60 | 2.331.10 | 9.65 | -213363 |
| bulge | 2.680.21 | 2.980.70 | 1.750.36 | 19.12 | - | |
| P1 | 2.470.22 | 1.470.61 | 1.040.34 | 17.86 | - |
2.2.2 Energy dependent analysis
We further divide the full data (pass8) by 3 energy bands: , and GeV. With each sub-band data, we perform the likelihood analysis to study the -ray morphological distribution. The background-subtracted counts maps in the sub-bands are shown in Figure 6. On the GeV and GeV counts maps, there is significant emission from the center of M31.
We employ the three spatial models in the morphological fitting of each sub-band as well. The parameters of each model are listed in Table LABEL:tab:subband. In the GeV sub-band, log values of the disk, bulge, disk+bulge model are very close to each other, although the disk+bulge model is slightly better than the disk or bulge model. In the GeV band, the disk+bulge model has shown significantly better result than the other models do. In the GeV sub-band, the TS value of M31 is effectively zero in all three models, implying that the -ray emission from M31 is insignificant above 20 GeV.
2.2.3 PSF3 analysis
Angular resolution of data is the key to morphological studies. In pass8 data, PSF type (PSF0, PSF1, PSF2, and PSF3) refers to the quality of reconstruction of direction of photons, with PSF3 having the best accuracy. To search for possible substructures of M31 under an improved angular resolution, we carry out likelihood analysis using only type PSF3 data. We select the 0.2–300 GeV data between August 8, 2008 and October 7, 2016, which is the same as before. The data are restricted to the ones with zenith angles 100, and within the time intervals when the satellite rocking angle was less than 52. We also restrict the data to a rectangular region of interest (ROI), with a size of 14 14 centered at M31. Our background model includes the 3FGL catalog sources (95 sources within a radius of 20 from the center of M31), the Galactic diffuse emission (), and the isotropic emission ( ). The adopted instrument response function (IRF) is . The results using only PSF3 data are presented in Table LABEL:tab:psf3. It can be seen that the log of disk+bulge model is higher than the ones of bulge model and disk model, which is consistent with the ones using the full data set. It is not surprising that the TS values of the spatial models using only PSF3 data are less than the ones using the full data (Table LABEL:tab:pass8), as the number of photons is smaller.
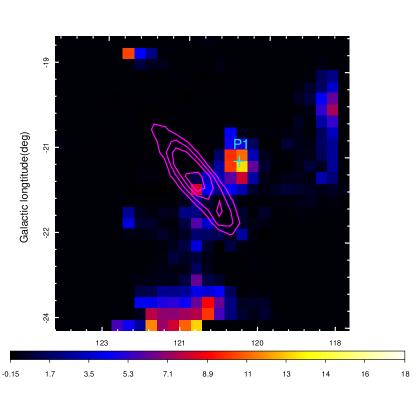
In the residual map generated from the analysis of pass8 PSF3 data (Figure 2), we can identify a point-like source at [RA, DEC] = [00h39m12s, 413936], with a distance of 0.7 to the center of M31 in the northwest. Hereafter we designate this source candidate as P1. Li et al. (2016) find a point-like GeV excess at (00h39m48s, 415200), and Ackermann et al. (2017) find ‘excess2’ (00h40m00s, 420748); both their locations are roughly in accordance with the location of P1. In addition, there is a nearby point source FL8Y J0039.8+4204 in FL8Y catalogue111, however it is not spatially coincident with P1 (Figure 2).
Therefore, we add P1 to the source model file and redo the likelihood analysis, with PSF3 data and new spatial models: disk+P1, bulge+P1, disk+bulge+P1. The corresponding results are shown in the last three rows of Tables LABEL:tab:psf3. The disk+bulge+P1 model has the highest log. Adding P1 has improved the log for all three previous spatial models. We also redo the likelihood analysis on the three new spatial models with pass8 full data set, see Section 3.3, as a higher photon statistics may improve the detection significance of P1.
We noticed that NGC 205 (M110), a satellite dwarf galaxy of M31, [RA, DEC] = [00h40m22.1s, 4141\arcmin07\arcsec], lies close to the position of P1 (offset by 0.3 , see Figure 2 top right). To see if P1 could be the counterpart of this dwarf galaxy NGC 205, we redo the likelihood analysis, with NGC 205 added as a new point source. Firstly, we replace P1 with NGC 205, this reports a TS value of 12.1 for NGC 205, which is much less than the TS value of P1 in previous models. Then we put both P1 and NGC 205 into the model. In this case we have and . The results suggest that NGC 205 may not be responsible for the excess emission.
2.3 Testing the existence of bubble-like feature of M31
Pshirkov et al. (2016) had performed a search for extended -ray halo around M31. They reported a 5.2 significance for two 0.45 circles model, and a 4.7 significance for 0.9 circle model. Li et al. (2016) also applied 0.9 circle and two 0.45 circles as spatial model of excess emission around M31, as well as point source model. But they did not find any significant bubble-like features.
Following the above works, we also tested several bubble-like templates (in addition to the disk emission, see 4): (1) two 0.45 circles templates; (2) a single 0.45 circle template in either side of the M31 disk; (3) a 0.9 circle centered at M31; (4) two point sources, namely C1 and C2, located at the central positions of the 0.45 circles. The spatial models are also displayed in the right panel of Figure 4, and the results are listed in Table LABEL:tab:bubble. We find that when using the two 0.45 circle model and 0.9 model, the TS values and the flux of the M31 disk are too small to be significant, which is unphysical, although these models deliver higher log than the single M31 models do (Table LABEL:tab:pass8). When using single bubble model (i.e., single 0.45 circle template in either side of the M31 disk), the bubble templates have TS value smaller than 20.

Furthermore, we also tested an additional model including the M31 disk, the new source candidate P1, and P2 (as a hypothetical source located at an opposite side and same angular distance from the M31 disk as P1). In this case, P2 is not detected.
3 Discussion
We address the implications of our results in light of the possible diffuse components from M31: the disk, the bulge, and any bubble-like structure.
3.1 Origin of -ray emission from the M31 bulge
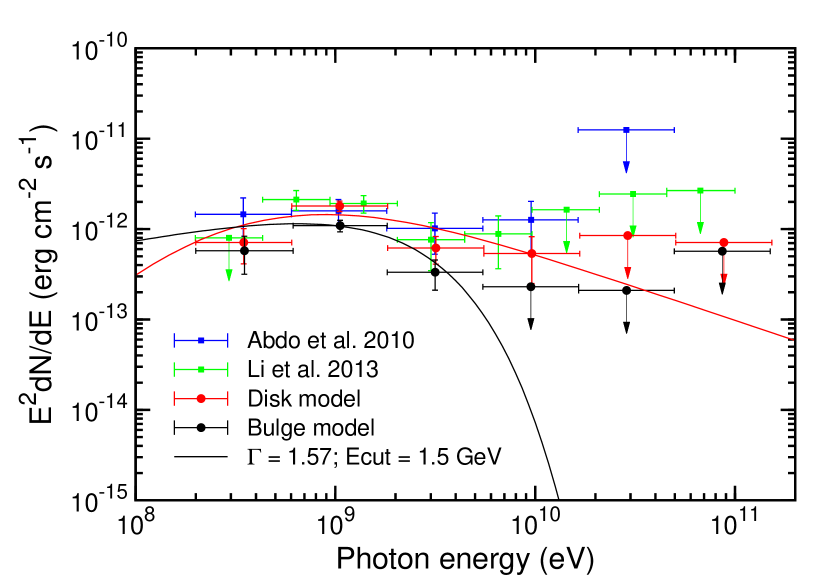
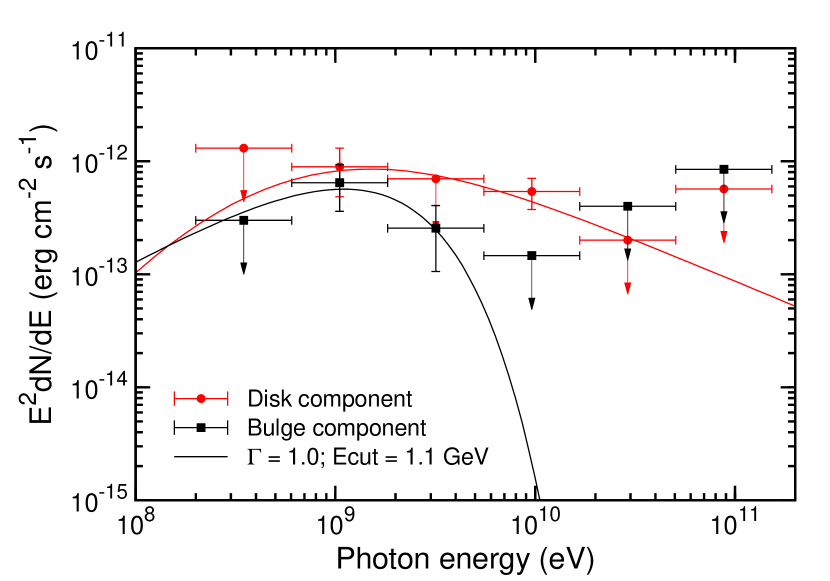
In Section 2.2.1, we have used a disk model, a bulge model, and a composed disk+bulge model as spatial models of M31, respectively. Figure 7 and Figure 8 show the fitting results of the above three spatial models in the spectral energy distribution (SED) representation. In each fit, we divide the data into six logarithmic energy bins, covering the energy range , as in Yuan & Zhang (2014). In Figure 7, we also plot the SEDs of M31 derived by Abdo et al. (2010d) and Li et al. (2016), both of which adopted a IRAS 100m disk model. The SED of the disk model agrees with their SEDs.
In the disk+bulge model, assuming that the -ray emission of the disk component originates from decay, and an injected proton spectrum of = , which is based on the proton spectrum of the Milky Way, we plot the resulted -ray emission in both figures. We further assume that the bulge component of our disk+bulge model originates from MSPs, and plot a power law with exponential cutoff (PLE) spectrum with the parameters = 1.57, Ecut = 1.5 GeV, which is consistent with the typical MSPs in the Milky Way (Abdo et al. 2009). In Figure 8, we again overlay a hadronic spectrum for the disk model and a PLE spectrum (with = 1.0, = 1.1 GeV) for the bulge model.
As referred in 2.2.3, we have detected a bulge component in disk+bulge model, with TS = 25.7, which we suggest as a strong evidence for the presence of the bulge component. We analogy this bulge -ray emission component to the Galactic Center Excess.
We examine the MSPs inside the bugle as the astrophysical origin of the bulge emission. Because M31 and the MW are local group galaxies that are comparable to each other, we can derive the number of MSPs needed for explaining the observed -ray luminosity of the bulge component, based on the luminosity function of Milky Way MSPs (Yuan & Zhang 2014, Cholis et al. 2014),
| (1) |
where = 1.1, = 3.0, = 4 , and k is the normalization factor. We thus have
| (2) |
and
| (3) |
where = , = . is the -ray luminosity of M31 bulge, = (1.160.14). So, the number of the MSPs needed to produce the bulge component emission is .
A more fundamental quantity is the MSP abundance, which is the number of MSPs divided by the underlying stellar mass. The stellar mass in the M31 bulge is estimated to be (2.5–6.6)10 (Widrow et al. 2003, Tamm et al. 2012), resulting in a MSP abundance of (2–6)10-6. For the MW bulge, the stellar mass is (0.5–2.7)10 (Licquia & Newman 2015). Taking the ratio of the -ray luminosity of the MW GeV excess (21037erg s-1 from Bartels et al. 2017) and that of the M31 bulge derived in this work, which is about one-sixth, the number of MSPs in the MW (boxy) bulge is thus 2.5104, close to the value of (1–2)104 derived by Yuan & Zhang (2014). Eckner et al. (2018) estimate -ray emission of MSP population to explain the Galactic Center Excess and signal from center of M31, their conclusions also support our results. This implies a MSP abundance of (1–5)10-6 for the MW bulge. Therefore, the MSP abundance is very similar between the bulges of M31 and MW, i.e., the ratio is close to unity. We note that the ratio estimated here does not rely on the uncertainty of the luminosity function of MSPs, since it affects both estimated numbers of MSPs in the same manner. The major assumption here is that the -ray emission predominantly arises from the MSP population in the bulges of both galaxies.
3.2 Relation of -ray luminosity and IR luminosity of nearby galaxies
Figure 5 shows the correlation between the -ray luminosities and the total infrared (IR) luminosities (8-1000 m) of several nearby galaxies, including local group galaxies, star forming galaxies and AGNs (Abdo et al. 2010a, Tang et al. 2014). However, here we fit this IR- correlation using only star forming galaxies SMC, LMC, NGC 253, M 82, NGC 2146. The best fit is plotted as the black solid line in Figure 5, with a slope of 1.210.11. We exclude NGC 1068, NGC 4945, and Circinus galaxy in the fitting, as their -ray emissions are probably dominated by AGNs. We also exclude Milky Way from the fit, due to the possible underestimation of its total -ray luminosity because of our internal perspective. The total 8-1000 m luminosities of the Circinus galaxy is taken from Hayashida et al. (2013), those of other galaxies are taken from Gao et al. (2004). The -ray luminosity of is taken from Tang et al. (2014). The -ray luminosities of other galaxies are taken from Ackermann et al. 2012a. Two remarkable PSRs have been recognized in LMC recently (Ackermann et al. 2016). PSR J0540-6919 has a and PSR J0537-6910 has a . Their total luminosity L = (1.150.17), accounts for about 24% of the total -ray luminosity of LMC. We subtract the -ray contribution from these two PSRs. This modification of LMC luminosity has tiny influence on the fit of the IR- relation of galaxies.
| Galaxy | distance | Index | TS | ||
|---|---|---|---|---|---|
| (1) | (2) | (3) | (4) | (5) | (6) |
| SMC | 0.06 | 2.220.02 | 136.6 | 0.11 0.03 | 0.0070.001 |
| LMC | 0.05 | 2.020.02 | 1122 | 0.470.05 | 0.070.01 |
| LMC* | 0.05 | 2.020.02 | 1122 | 0.350.05 | 0.070.01 |
| M33 | 0.85 | 2.480.06 | 13.65 | 3.5 | 0.120.02 |
| M31 | 0.78 | 2.310.09 | 107.87 | 5.150.5 | 0.24 0.04 |
| 0.78 | 2.22 0.13 | 33.4 | 3.840.03 | 0.24 0.04 | |
| Milky Way | – | 2.20.1 | – | 8.22.4 | 1.4 0.7 |
| NGC 253 | 2.5 | 2.20.1 | 109.4 | 6020 | 2.10.32 |
| NGC 4945 | 3.7 | 2.10.2 | 33.2 | 12040 | 2.60.39 |
| M82 | 3.4 | 2.20.1 | 180.1 | 15030 | 4.60.69 |
| NGC 2146 | 15.2 | 2.20.1 | 30.8 | 400210 | 101.5 |
| NGC 1068 | 16.7 | 2.20.2 | 38.1 | 1540610 | 28.3 4.25 |
| Circinus | 4.2 | 2.190.12 | 58 | 29050 | 1.56 0.23 |
(1) Galaxy name; (2) Distance, in units of Mpc; (3) Photon-index of -ray emission; (4) TS values; (5) GeV luminosity, in units of ; (6) Total IR (8–1000 m) luminosity, in units of . “M31” refers to M31 disk model, while “” refers to the disk component of disk+bulge model. The Circinus galaxy is taken from Hayashida et al. (2013). For other galaxies, the total IR luminosities are taken from Gao et al. (2004) and the -ray luminosities are taken from Ackermann et al. (2012a). The -ray luminosity of NGC 2146 is from Tang et al. (2014).
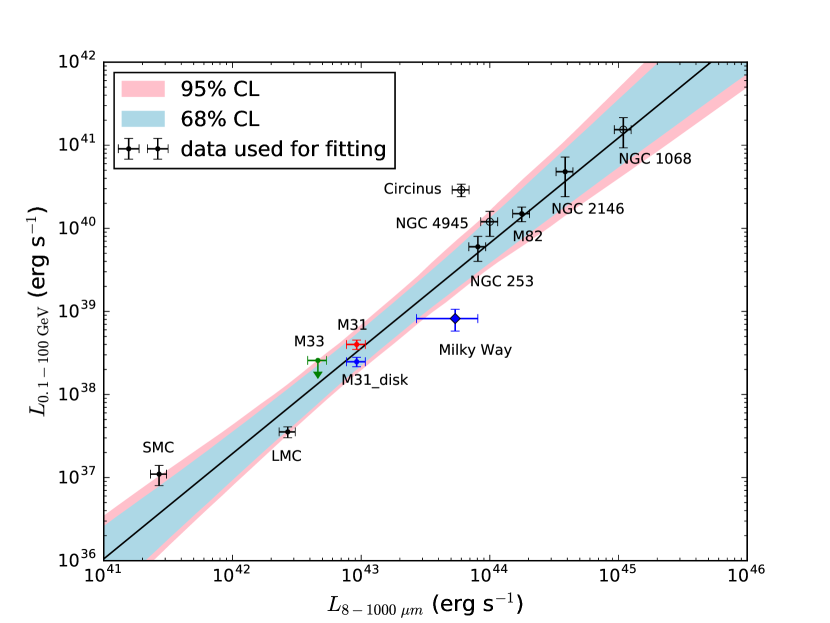
From Figure 8, we find that most of the galaxies in our sample lie within the 95 confidence level of the best fit line. This is consistent with Abdo et al. (2010d). According to Figure 5, the -ray luminosity of the disk (disk component) agree with the IR- correlation well in both the disk and the disk+bulge model. The relationship of and holds for different galaxies including star forming galaxies and star burst galaxies, which may indicate the dominating effects of acceleration of protons by star forming regions, and/or related to the nature of CR electron calorimetry (Murphy et al. 2006).
3.3 Non-detection of bubble-like features of M31
We tested several bubble-like templates as mentioned in previous works Pshirkov et al. (2016) and Li et al. (2016). We did not find any significant emission like those claimed in Pshirkov et al. (2016) and we confirm the non-detection of such structures as in Li et al. (2016).
As mentioned in Section 2.2.3, we found a source candidate P1 40 arcmin northwest to M31. We then add P1 into the spatial models. A point source and a power-law are used as the spatial model and the spectral model of P1, respectively. We redo the likelihood analysis with the full pass8 data (Table LABEL:tab:pass8) and the PSF3 data (Table LABEL:tab:psf3), separately. The TS values of P1 in the analysis with the full data are just below the detection threshold 25. We suggest it is a new source candidate. After P1 is added to the spatial models, the log values of the models are improved. P1 could be a background source, or a source connected to M31. If the latter one is the case, it will be very interesting. This emission could be related to the past activities of the nucleus of M31. To test this assumption, we place a hypothetical source located at an opposite side and same angular distance of the M31 disk as P1 (which we call P2). P2 is not detected in our analysis, thus P1 lacks a symmetric geometrical counterpart which could strengthen P1 as a Fermi bubble-like feature.
The two Fermi bubbles of the Milky Way have a luminosity with a spectral index 2 (Su et al. 2010), which is about 5% of the total Galactic -ray luminosity of 0.1-100 GeV (Strong et al. 2010). We obtain the luminosity of the residual point source P1 in the same energy range = (5.4 2.1), assuming P1 is associated with M31 at a distance 780 kpc. The total -ray luminosity of M31 is (4.0 0.5) (for disc model), and the P1 source is about 5 – 21% of the total luminosity. P1 is located at a distance 10.5 kpc to the M31 disk, which is comparable to the distance 4 kpc from the center of the Fermi bubbles to the Galactic disk. We plot the spectrum of P1 in Figure 4. The spectral index of P1 2.31 is slightly softer than the one of the Fermi bubble by Su et al (2010).
4 Summary
In this work we study the -ray emission of M31 by using more than 8 years of Fermi-LAT data, which includes the full pass8 data and the PSF3 only data in the energy range from 200 MeV to 300 GeV. We have used the disk model, bulge model and disk+bulge model to represent the spatial distribution of M31, where the disk component in these models are based on IRAS 100 m image. Our findings are summarized below:
-
1.
We find that disk+bulge model provides the highest log, that means it is the best among the tested models. In this case = 33.4, while = 25.7, suggesting a strong evidence for the detection of both the central bulge component and the disk component of M31.
-
2.
Assuming a major fraction of the bulge-like -ray emission is originated from MSPs, we calculate the number of MSPs needed to explain the luminosity of the bulge component in the disk+bulge model is . The thus derived MSP abundance of the M31 bulge, , is close to the value of for the MW bulge, provided that the -ray luminosity of the latter is also dominated by MSPs.
-
3.
M31 disk model and M31 disk component of the disk+bulge model both satisfy the relation between the -ray luminosity ( GeV) and total IR luminosity (8-1000 m) for star-forming galaxies.
-
4.
We analysed pass8 PSF3 data, which are preselected data sets with the best angular resolution. We found a source candidate P1 located about northwest to M31, with a significance 4.7 in the full-data set analysis. There is no source coincident with P1 in FL8Y catalogue.
-
5.
We did not find any significant bubble-like features in the region of M31. If we compare P1 to Fermi bubble, the total luminosity of P1 in GeV is similar to that of the Fermi bubble. Both of them have shown similar fractions of the total luminosities of their host galaxies, which is . We didn’t find counterpart of P1 on the southeast side of M31.
Acknowledgments
We thank Xian Hou, Yudong Cui and Xiang-Dong Li for valuable comments. This work uses data and software provided by Fermi Science Support Center. This work was supported by the 973 Program under grants 2017YFA0402600 and 2015CB857100 and the National Natural Science Foundation of China under grants 11473010, 11133001, 11773014, 11633007 and 11851305.
References
- Abdo et al. (2009) Abdo, A. A., Ackermann, M., Ajello, A. A., et al., 2009, Science, 325, 848
- Abdo et al. (2010a) Abdo, A. A., Ackermann, M., Ajello, A. A., et al., 2010a, A&A, 523, 46
- Abdo et al. (2010b) Abdo, A. A., Ackermann, M., Ajello, A. A., et al., 2010b, A&A, 512, 7
- Abdo et al. (2010c) Abdo, A. A., Ackermann, M., Ajello, A. A., et al., 2010c, ApJ, 709, L152
- Abdo et al. (2010d) Abdo, A. A., Ackermann, M., Ajello, A. A., et al., 2010d, A&A, 523, L2
- Ackermann et al. (2012a) Ackermann, M., Ajello, M., Allafort, A., et al., 2012a, ApJ, 755,164
- Ackermann et al. (2012b) Ackermann, R., Ajello, M., Allafort, A., et al., 2012b, APJ, 747, 104
- Ackermann et al. (2013) Ackermann, R., Ajello, M., Allafort, A., et al., 2013, ApJS, 209, 34
- Ackermann et al. (2016) Ackermann, M., Albert, A., Atwood, W. B., et al., 2016, A&A, 586, 71
- Ackermann et al. (2017) Ackermann, M., Ajello, M., Albert, A., et al., 2017, ApJ, 836, 208
- Ajello et al. (2016) Ajello, M., Albert, A., Albert, A., et al., 2016, ApJ, 819, 44
- Atwood et al. (2009) Atwood, W. B., Abdo, A. A., Ackermann,M., et al., 2009, ApJ, 697, 1071
- Bartels et al. (2017) Bartels, R., Storm, E., Wenig, C., Calore, F., 2018, Nature Astronomy, tmp, 110B
- Bird et al. (2015) Bird, R., et al., 2015, ICRC, 34, 851B
- Brandt et al. (2015) Brandt, T. D., Kocsis, B., 2015, ApJ, 812, 15
- Calore et al. (2015) Calore, F., Cholis, I., et al., 2015, ICRC, 34, 915
- Cholis et al. (2014) Cholis, I., Hooper, D., Linden,T., 2014, arXiv:1407.5583
- Cholis et al. (2015) Cholis, I., Evoli, C., Calore, F., et al., 2015, JCAP, 12, 5C
- Daylan et al. (2016) Daylan, T., Finkbeiner, D. P., Hooper, D., et al., 2016, Phys. Dark Univ., 12, 1
- Dong et al. (2015) Dong, H., Li, Z. Y., Wang, Q. D., et al., 2015, MNRAS, 451, 4126
- Eckner et al. (2018) Eckner, C., Hou, X., Serpico, P. D., et al., 2018, ApJ, 862, 79
- Gao et al. (2004) Gao, Y., Solomon, P. M., 2015, ApJ, 606, 271
- Goodenough et al. (2009) Goodenough, L., Hooper, D., 2011, PhLB, 697, 412
- Gordon et al. (2014) Gordon, C., Macias, O., 2014, PhRvD., 89f, 3515M
- Haggard et al. (2017) Haggard, D., Heinke, C., Hooper, D., Linden, T., 2017, Jcap, 05, 056
- Hooper et al. (2013) Hooper, D., Cholis, I., Linden, T., Siegal-Gaskins, J. M., & Slatyer, T. R. 2013, PRD, 88, 083009
- Hooper & Linden (2016) Hooper, D., & Linden, T., 2016, JCAP, 8, 018
- Hayashida et al. (2013) Hayashida, M., Stawarz, L., Cheung, C. C., et al., 2013, ApJ, 779, 131
- Kelner et al. (2006) Kelner, S. R., Aharonian, F. A., Bugayov, V. V., 2006, PhRvD, 74, 4018
- Li et al. (2011) Li, Z. Y., Garcia, M. R., Forman, W. R., et al., 2011, ApJ, 728, 10
- Li et al. (2016) Li, Z. W., Huang, X., Yuan, Q., Xu, Y., 2016, JCAP, 12, 028
- Licquia & Newman (2015) Licquia, T. C., Newman, J. A., 2015, ApJ, 806, 96
- Macias et al. (2018) Macias, O., Gordon, C., Crocker, R. M., et al., 2018, Nature Astronomy, 2, 387
- Murphy et al. (2006) Murphy, E. J., Helou, G., Braun, R., et al., 2006, ApJ, 651, 111
- Peng et al. (2016) Peng, F.-K., Wang, X.-Y., Liu, R.-Y., Tang, Q.-W., Wang, J.-F. 2016, ApJ, 821, L20
- Pshirkov et al. (2016) Pshirkov, M. S., Vasiliev, V. V., Postnov, K. A., 2016, MNRAS, 459,76
- Stanek & Garnavich (1998) Stanek, K. Z.,& Garnavich, P. M., 1998, apjl, 503, L131
- Strong et al. (2010) Strong, A. W., Porter, T. A., Digel, S.W., Johannesson, G., Martin, P.,et al., 2010, ApJ, 722, L58
- Su et al. (2010) Su, M., Slatyer, T. R., Finkbeiner, D. P., 2010, ApJ , 724, 1044
- Tamm et al. (2012) Tamm, A., Tempel, E., Tenjes, P., Tihhonova, O., Tuvikene, T., 2012, A&A, 546, A4
- Tang et al. (2014) Tang, Q. W., Wang, X. Y., Tam, P. T., 2014, ApJ, 794, 26
- Widrow et al. (2003) Widrow, L. M., Perrett, K. M., Suyu, S. H., 2003, ApJ, 588, 311
- Yang et al. (2016) Yang, R. Z., Aharonian, F., 2016, A&A, 589, A117
- Yuan & Zhang (2014) Yuan, Q., Zhang, B., 2014, JHEAp, 3, 1Y
- Zhou et al. (2015) Zhou, B., Liang, Y.-F., Huang, X. Y., et al., 2014, PhRvD, 91, 123010
| Energy Band | RA | DEC | Error | |
| (degree) | (degree) | (degree) | ||
| (1) | (2) | (3) | (4) | |
| 0.2-300 GeV (this work) | 10.7806 | 41.2742 | 0.0894 | |
| 1-300 GeV (this work) | 10.8466 | 41.2223 | 0.0769 | |
| 1-100 GeV | 10.81 | 41.19 | 0.07 (in RA) | |
| (Ackermann et al. 2017) | 0.05 (in DEC) | |||
| optical | 10.6847 | 41.2687 |
| Energy band | spatial model | composition | TS | log | ||||
|---|---|---|---|---|---|---|---|---|
| () | () | |||||||
| (1) | (2) | (3) | (4) | (5) | (6) | (7) | (8) | |
| 0.2-1 GeV | disk | IRAS 100m | 1.390.34 | 2.50.50 | 1.32 0.22 | 41.44 | -614007.8 | |
| bulge | 1.700.44 | 1.81 0.50 | 0.890.12 | 28.0 | -614008.9 | |||
| disk+bulge | IRAS 100m | 1.31 0.56 | 1.710.56 | 0.920.24 | 19.86 | -614007.6 | ||
| bulge | 1.85 0.97 | 0.690.46 | 0.330.19 | 3.41 | - | |||
| 1-20 GeV | disk | IRAS 100m | 2.750.16 | 0.600.09 | 1.310.20 | 53.45 | -180236 | |
| bulge | 3.420.18 | 0.360.06 | 0.70.14 | 52.08 | -180233 | |||
| disk+bulge | IRAS 100m | 2.15 0.33 | 0.240.08 | 0.810.30 | 9.56 | -180231 | ||
| bulge | 3.66 0.63 | 0.270.06 | 0.490.14 | 26.25 | - |
| spatial model | composition | TS value | log | ||||
| () | () | ||||||
| (1) | (2) | (3) | (4) | (5) | (6) | (7) | |
| disk+two 0.45\degrcircles | IRAS 100m | 2.160.22 | 1.341.06 | 1.530.93 | 11.64 | -501376 | |
| two 0.45\degrcircles | 2.290.10 | 3.530.90 | 3.190.77 | 64.0 | - | ||
| disk+0.45\degrcircle1 | IRAS 100m | 2.250.12 | 3.050.83 | 2.960.66 | 52.0 | -501382 | |
| 0.45\degrcircle1 | 2.340.19 | 1.670.68 | 1.400.46 | 18.54 | - | ||
| disk+0.45\degrcircle2 | IRAS 100m | 2.30.12 | 3.480.55 | 3.060.51 | 60.42 | -501383 | |
| 0.45\degrcircle2 | 2.190.18 | 1.170.41 | 1.270.44 | 12.53 | - | ||
| disk+0.9\degrcircle | IRAS 100m | 2.220.27 | 0.840.49 | 0.860.49 | 3.95 | -501378 | |
| 0.9\degrcircle | 2.210.09 | 4.350.56 | 4.510.68 | 87.48 | - | ||
| disk+P1+P2 | IRAS 100m | 2.250.12 | 3.660.4 | 3.530.56 | 76.87 | -501376 | |
| P1 | 2.320.18 | 1.140.26 | 0.970.3 | 23.52 | - | ||
| P2 | 2.330.17 | 0.30.02 | 0.250.03 | 1.46 | - | ||
| disk+C1+C2 | IRAS 100m | 2.20.13 | 2.850.37 | 3.050.57 | 51.18 | -501382 | |
| C1 | 2.700.15 | 1.340.4 | 0.740.2 | 10.24 | - | ||
| C2 | 2.350.11 | 0.640.03 | 0.520.03 | 5.32 | - |