iint \restoresymbolTXFiint
Thorium in solar twins: implications for habitability in rocky planets
Abstract
We have investigated the thorium (Th) abundance in a sample of 53 thin disc solar twins covering a wide range of ages. These data provide constrains on the mantle energy budget of terrestrial planets that can be formed over the evolution of the Galaxy’s thin disc. We have estimated Th abundances with an average precision of 0.025 dex (in both [Th/H] and [Th/Fe]) through comprehensive spectral synthesis of a Th II line present at 4019.1290 Å, using very high resolution (R = 115,000) high quality HARPS spectra obtained at the ESO La Silla Observatory. We have confirmed that there is a large energy budget from Th decay for maintaining mantle convection inside potential rocky planets around solar twins, from the Galactic thin disc formation until now, because the pristine [Th/H]ZAMS is super-solar on average under a uniform dispersion of 0.056 dex (varying from +0.037 up to +0.138 dex based on linear fits against isochrone stellar age). Comparing to neodymium (Nd) and europium (Eu), two others neutron-capture elements, the stellar pristine abundance of Th follows Eu along the Galactic thin disc evolution, but it does not follow Nd, probably because neodymium has a significant contribution from the -process (about 60 per cent).
keywords:
stars: solar-type – stars: abundances – stars: fundamental parameters – planets and satellites: terrestrial planets – Galaxy: disc – (Galaxy:) solar neighbourhood1 Introduction
The structure of a terrestrial planet is driven by the formation process itself based on the collision and accretion of planetesimals with differential mineralogical settling and also by the internal heat budget. As the prototype geologically dynamic planet, Earth has a partially-crystalized metallic dynamo core, and a silicate liquid mantle, whose convection maintains plate tectonics of a rocky crust. The major internal heat sources of Earth comes from the secular cooling of core and mantle, and the radioactive decay of Th, U and K isotopes in the mantle (Huang et al., 2013). The mantle thickness and convection inside telluric planets are directly linked to the abundances of these isotopes in the mantle (basically 232Th, 235U and 238U) (McDonough, 2003). The volcanic activity generated by the plate tectonics recycles gases such as carbon dioxide between the atmosphere and the mantle, contributing to habitability by keeping the planet surface at moderate temperatures (Walker et al., 1981). A geologically active planet could even play a role for the origin of life and its long-term maintenance (e.g. Misra et al. (2015) and references therein).
Unterborn et al. (2015) were the first to speculate about the potential energy budget of terrestrial planets directly connected to the stellar photospheric abundance of thorium (Th). They measured log (Th)111log (X) = log ((X)/(H)) + 12, where is number density. varying from 59 up to 251 per cent of the solar value in a sample of 13 solar twins and analogues, indicating that possible terrestrial planets formed around these stars have sufficient internal energy budget to sustain a convective mantle in a dynamic planet and, consequently, increases the probability of having a habitable surface. They also found that the Sun is depleted in Th in comparison with 13 solar twins/analogues. They argued that a large variation in Th abundance could be explained by differences in stellar age within their sample, besides other main possible factors such as the continuum normalization of the analysed blend Fe-Ni-Mn-Th-Co-CN-Ce-CH at 4019 Å (covering 4018.9–4019.2 Å) and the difference in spectral resolution between two data sets (R = 48,000 and R = 115,000). Specifically, they did not report any deep analysis of the Th abundance as a function of stellar age (taken from Baumann et al. (2010)). They concluded that the observed large Th abundance variation is likely due to primordial chemical inhomogeneity among the stars.
Thorium is a -process element synthesized in core-collapse supernovae, neutron star mergers and neutron star - black hole mergers in the Galaxy (-process elements are those built up by rapid capture of neutrons into nuclei, i.e. over energetic processes in which the neutrons flux is high enough to become negligible the effect of the free neutrons decay). The half time of its most abundant radioactive isotope 232Th (14.05 Gyr) is as high as the age of Universe (Cayrel et al., 2001). Previous works have found a large variation in the abundance of -process elements (Th included) covering both metal-poor old halo stars and the younger more metal-rich disc stars (del Peloso et al., 2005a, b; Honda et al., 2004; Johnson & Bolte, 2001). Butcher (1987) was the pioneer in estimating the age of the Galaxy by measuring Th abundance in G-dwarfs, taking the advantage of its sizable decay during the lifetime of the Galaxy. How the abundance of Th has evolved during the Galactic disc’s life is still an open question – more specifically in the thin disc at the Sun’s galactocentric distance. Nearby solar twins spanning a range of ages can provide clues about this question because their photospheric abundances reflect the composition of the interstellar medium at the time they formed. As planets and stars are likely formed from the same natal cloud, potential terrestrial planets should have a Th abundance related to the Th abundance of its host star.
We have homogeneously measured Th abundances in a sample of nearby solar twins (including two planet-host stars) of the Galactic thin disc, covering a broad range of stellar ages, in order to provide constrains about the mantle energy budget of terrestrial planets during the evolution of the thin disc. A Th II line present in a multi-species blend at 4019 Å has been carefully analysed for this purpose, through comprehensive spectral synthesis differentially to the Sun. Section 2 presents the sample of solar twins, their main parameters, and the spectroscopic data. In Section 3 we describe the spectral synthesis approach employed for measuring Th abundance in a multi-species blend. Section 4 covers the analysis of resulting Th abundance ratios (current and primordial) against metallicity and stellar age. Finally, we show the concluding remarks in Section 5.
2 Sample of solar twins and observational data
The sample is composed of 67 solar twins (stars with effective temperature, surface gravity and metallicity around the solar values within 100 K in and within 0.1 dex in log and [Fe/H]), which were recently analysed by Spina et al. (2018) and Bedell et al. (2018). Their spectroscopic data and main parameters adopted are described in this section.
Spina et al. (2018) derived their photospheric parameters (and abundance of 12 neutron-capture, -capture, elements) by applying a line-by-line differential spectroscopic analysis relative to the Sun through equivalent width (EW) measurements of Fe I and Fe II lines. The estimated typical errors in , log , [Fe/H] and (micro-turbulence velocity) are, respectively, 4 K, 0.012, 0.004 dex and 0.011 km s-1. We have also adopted the stellar masses and isochrone ages as derived by Spina et al. (2018), which are represented by the more probable values (i.e. that corresponds to the peak of a probability distribution) by applying the isochrone method with the code of Ramírez et al. (2014a, b). Only for the two very young stars HIP 3203 and HIP 4909, whose more probable age values are null, the ages are better represented by the average values, as also adopted by our previous works (Spina et al., 2018; Bedell et al., 2018). The typical age uncertainty is 0.4 Gyr, which is derived from the probability distribution itself. Besides the 12 -capture elements (Sr, Y, Zr, Ba, La, Ce, Pr, Nd, Sm, Eu, Gd and Dy), we have also considered the abundances of 17 additional elements analysed by Bedell et al. (2018) (C, O, Na, Mg, Al, Si, S, Ca, Sc, Ti, V, Cr, Mn, Co, Ni, Cu and Zn). The aforementioned works measured elemental abundances by a strict line-by-line EW analysis relative to the Sun.
HARPS (High Accuracy Radial velocity Planet Searcher) spectra are used in this work to extract Th abundances. HARPS is an ultra-stable echelle spectrograph installed on the 3.6m telescope of the European Southern Observatory (ESO) at La Silla Observatory in Chile (Mayor et al., 2003). The HARPS spectra covers 3780–6910 Å under a resolving power R = 115,000. The spectra adopted in the current work are those analysed by Spina et al. (2018); Bedell et al. (2018). Each one-dimensional spectrum comes from more than 50 stacked spectra that are previously Doppler-corrected and carefully continuum normalized. The majority of spectra were collected for a large ESO observing program on HARPS, which aims at hunting for planets around solar twins (Bedell et al., 2015; Meléndez et al., 2017, 2015), complemented with HARPS spectra from other programs extracted from the online ESO Science Archive Facility. The spectral signal-to-noise ratio SNR, measured at 6000 Å, has an average value of about 800 per pixel, varying from 300 up to 1800 per pixel. The solar reference spectrum is a combined spectrum of the reflected light by the asteroid Vesta. Its flux is continuum normalized in the same way as the spectra of the solar twins, and it has SNR = 1300 per pixel at 6000 Å. Further details about the analysed HARPS spectra are given in Spina et al. (2018). Table 1 shows the main parameters of sample solar twins, covering 58 stars as described at the end of the next section.
| Star ID | log | [Fe/H] | .sin() | age | [Si/H] | [Nd/H] | [Eu/H] | |||
|---|---|---|---|---|---|---|---|---|---|---|
| (K) | (dex) | (km s-1) | (km s | (km s-1) | (Gyr) | (dex) | (dex) | (dex) | ||
| Sun | 5777 | 4.440 | 0.000 | 1.00 | 3.20 | 2.04 | 4.56 | 0.000 | 0.000 | 0.000 |
| HIP 003203 | 58689 | 4.5400.016 | -0.0500.007 | 1.160.02 | 3.27 | 3.82 | 0.500.30 | -0.1120.009 | 0.1600.017 | 0.0570.014 |
| HIP 004909 | 58617 | 4.5000.016 | 0.0480.006 | 1.110.01 | 3.33 | 4.01 | 0.600.40 | -0.0470.012 | 0.2190.012 | 0.0990.013 |
| HIP 007585 | 58223 | 4.4450.008 | 0.0830.003 | 1.010.01 | 3.37 | 1.90 | 3.500.40 | 0.0580.008 | 0.1380.009 | 0.1240.015 |
| HIP 008507 | 57173 | 4.4600.011 | -0.0990.003 | 0.960.01 | 2.88 | 0.77 | 4.900.45 | -0.1270.028 | 0.0440.012 | -0.0190.022 |
| – | – | – | – | – | – | – | – | – | – | – |
| HIP 118115 | 57984 | 4.2750.011 | -0.0360.003 | 1.100.01 | 3.55 | 0.89 | 8.000.30 | -0.0290.012 | 0.0230.006 | 0.0690.007 |
3 Homogeneous thorium abundances
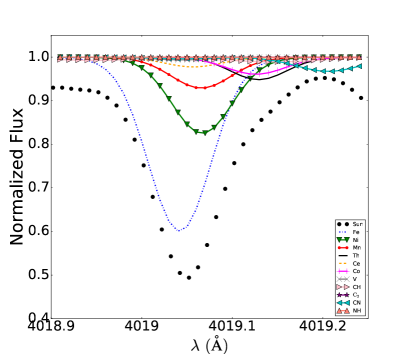
The abundance of Th has been measured from a complex blend at 4019 Å, which has been quite employed for this purpose, both in the study of Galactic disc stars (e.g., Unterborn et al. (2015), del Peloso et al. (2005b), Morell et al. (1992)) and Galactic halo stars (e.g., Roederer et al. (2009), Johnson & Bolte (2001), Cowan et al. (1997)). The analysis of this multi-species blend requires a careful spectral synthesis at very high-resolution and high SNR. The Th II 4019.1290-Å line together with the Co I 4019.1260-Å, CH 4019.1390-Å and CN 4019.2060-Å lines make the blend asymmetric at the red wing. The very weak CH line is from the (3,2) vibrational band of the A-X electronic system (12C1H), and the relatively weak CN line is from the (4,5) vibrational band of the B-X electronic system (12C14N). In the case of solar-type stars, the major atomic contributor of this blend is the Fe I 4019.0420-Å line followed by the Ni I 4019.0667-Å and Mn I 4019.0658-Å lines. A minor contribution comes from the Ce II 4019.0569-Å line. We refer the reader to Fig. 1 to see the different contributions to the blend, based on our calibration through spectral synthesis of the solar spectrum, as detailed in this section.
There is no mensurable line of uranium in the HARPS spectral coverage. However there is another Th II line in the HARPS range (at 4086.5210 Å), but it is 4.5 times weaker than the Th II 4019.1290-Å line. Uranium is another -process radioactive element that also contributes for the energy budget of terrestrial planets (mantle convection/thickness).
The spectral synthesis has been performed in the region 4000–4030 Å using the 2014 version of the MOOG code (Sneden, 1973) that solves the photospheric radiative transfer with line formation in FGK stars under the LTE (local thermodynamic equilibrium) approximation. The spectral synthesis based on MOOG has been handled through our own automated procedure developed under the Python language (version 2.7), which covers several steps from the solar calibration to the derivation of the Th abundance with its uncertainty, as explained in this section. We have also adopted the same stellar parameters and model atmospheres as our previous analyses of the sample stars (Spina et al., 2018; Bedell et al., 2018) to be self-consistent with them, i.e. interpolated models in the grid of Castelli & Kurucz (2004) (ATLAS9) assuming solar abundance ratios. Throughout our differential analysis we have also adopted the standard parameters for the Sun: = 5777 K, log = 4.44, [Fe/H] = 0.00 dex and = 1.00 km s-1 (e.g. (Cox, 2000)). The solar chemical composition by Asplund et al. (2009), and by Grevesse et al. (2015) specifically for the heavy elements Cu to Th, have been adopted as reference, such that the adopted Sun’s Th abundance is log(Th)=0.03 dex. The wavelength step of synthetic spectra has been fixed to 0.01 Å.
The atomic line list has been compiled from the VALD database (Kupka et al., 2000), and we have added the following molecular lines from the Kurucz database (Kurucz, 2017): 12C1H and 13C1H lines of the A-X system, 12C1H and 13C1H lines of the B-X system, 12C12C lines of the d-a system, 12C14N lines of the B-X system, and 14N1H lines of the A-X system. In the case of solar-like stars, only lines of the A-X system of 12CH, B-X system of 12CH, d-a system of 12C12C and B-X system of 12C14N, actually produce detectable absorptions in the studied region at our SNR ( 800). The other molecular lines (the main isotopes of carbon and nitrogen) are included in the line list to make more realistic the reproduction of the stellar continuum, because they are supposed to be within the spectral noise for SNR 1000 (13CH B-X system), or even 10,000 (13CH A-X system, 14NH A-X system). We have fixed solar isotopic ratios for 12C/13C and 14N/15N that are, respectively, 89.4 and 435 (Asplund et al., 2009). We have also confirmed that the lines of CH A-X and CN B-X in the investigated 30 Å-wide region are all insensitive to variation of C and N isotopic ratios. There are very few lines of CH B-X that are somehow sensitive to the 12C/13C ratio, but none affects the analysed Fe-Ni-Mn-Th-Co-CN-Ce-CH blended feature at 4018.9–4019.2 Å. The adopted dissociative energies of CH, C2, CN and NH are those by Barklem & Collet (2006). We tested somewhat different values of the dissociation constants, and found no changes in the results within about 0.01 dex. Table 2 presents the list of atomic and molecular lines covering 2 Å around the Th II feature, whose values have been calibrated to the cited solar spectrum, as explained below.
| wavelength | species code | species | ||
|---|---|---|---|---|
| (Å) | (eV) | |||
| 4018.5080 | 106.00113 | 1.391 | 0.276E-05 | CH |
| 4018.5090 | 607.0 | 3.754 | 0.154E+00 | CN |
| 4018.5360 | 607.0 | 3.193 | 0.424E-04 | CN |
| 4018.5620 | 107.0 | 2.440 | 0.433E-02 | NH |
| 4018.5703 | 25.0 | 5.087 | 0.195E+00 | Mn I |
| — | — | — | — | — |
| 4020.4940 | 106.00113 | 0.595 | 0.162E-04 | CH |
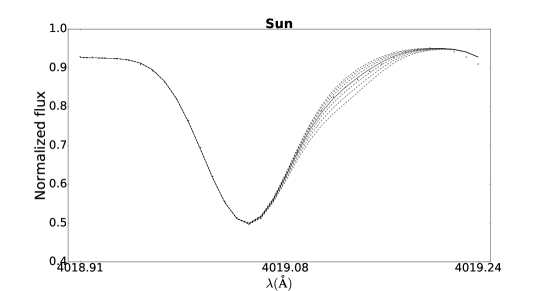
The first step for the differential chemical analysis relatively to the Sun using spectral synthesis is the calibration of -values for reproducing the line profiles, adopting a solar spectrum obtained with the same instrument and resolution. We have performed the calibration of -values of all lines in the region 4000–4030 Å through an automatic procedure under a line-by-line basis, using the flux at the core of each individual line. Specifically for a very narrow region around the 4019-Å blend (about 1Å wide), we have refined the calibration focusing on the contribution lines of the blend itself paying a special attention to the continuum adjustment between the observed and synthetic spectra. Due to the very close proximity between the cores of the Th II and Co I lines under the HARPS spectral sampling (respectively 4019.1290 and 4019.1260 Å), we have fixed the -values for both lines, adopting accurate known experimental values (0.5920.018 for the Th II line by Nilsson et al. (2002) and 0.5370.049E-02 for the Co I line by Lawler et al. (1990)). Whilst the -value of the Co I line has been actually fixed, the -value of the Th II line has been slightly refined to reproduce the spectral blend against the solar spectrum, ensuring a confident differential analysis to the Sun (the fine tuning of the Th II line has been just 1.9 per cent greater than the experimental measurement that has a relative error of 3 per cent). We have got [Th/H] = [Th/Fe] = 0.005 dex over this calibration step relatively to the Sun. Figure 1 illustrates the spectral synthesis calibration of the Fe-Ni-Mn-Th-Co-CN-Ce-CH blend at 4019 Å to the solar spectrum. We have been also able to confirm the relative intensity between the Th II and Co I lines as semi-theoretically predicted by Grevesse et al. (2015). The ratio EW(Th II 4019.1290-Å line)/EW(Co I 4019.1260-Å line) agrees within 1 sigma deviation taking into account the 20 per cent estimated uncertainty for the EW(Th II 4019.1290-Å line) made by them. To finely reproduce the line broadening, we have adopted the line-of-sight rotational velocity .sin() and macro-turbulence velocity that were respectively measured and computed by dos Santos et al. (2016) for our sample solar twins (the later one parametrically as a function of and log ). A limb darkening linear law for solar-type stars has been employed (limb darkening parameter = 0.60 adopted, to be consistent with dos Santos et al. (2016)). Based on our calibration to the HARPS solar spectrum we estimate that the CH 4019.1390-Å and CN 4019.2060-Å lines are 81 and 28 per cent weaker than the Th II line, respectively. We have computed their EW in each individual synthetic spectrum. Note that the cores of CH and CN lines are, respectively, 0.010 and 0.077 Å far away from the core of Th II line (see Fig. 1).
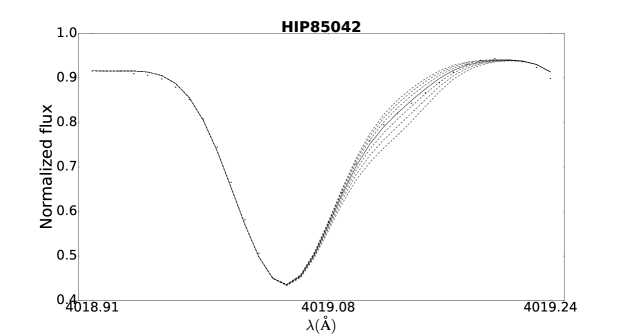
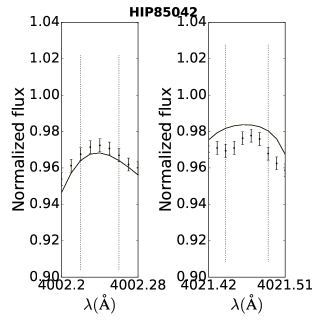
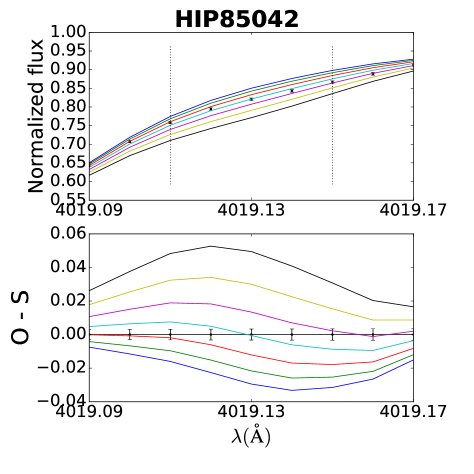
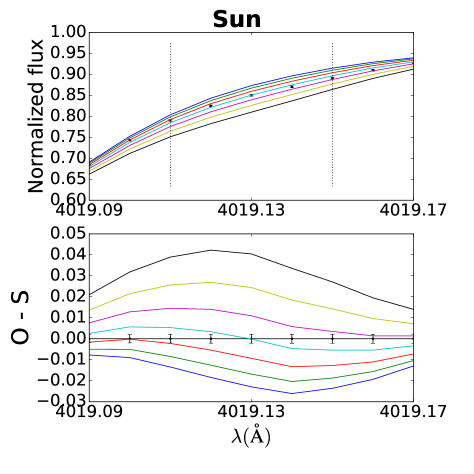
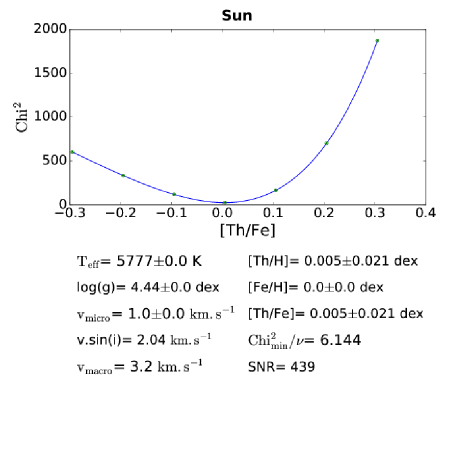
An automatic procedure based on the minimization has been used for performing the spectral synthesis fit in order to extract the Th abundance from the blended feature ( = /, where is the flux of the observed spectrum, is the flux of the synthetic spectrum, is the error in the observed flux, and represents the wavelength point). The wavelength window to compute is centered at the core of Th II line, as the spectral sampling (i.e. 4019.13 Å), and it covers a region in which the line absorption flux is stronger than or comparable to the other lines taking the solar spectrum as reference (see Fig. 1). The window is 4019.11–4019.15 Å, ranging over five pixels. The error in observed flux is estimated as a function of the continuum SNR, such that = /SNRcontinuum. The continuum SNR in the blend region has been measured as a simple average over five small continuum windows (centered at 4002.24 Å, 4009.35 Å, 4019.67 Å, 4020.67 Å and 4021.47 Å). The local SNR ranges from 147 (HIP 8507) up to 993 (HIP 54582), having an average value of 379 ((SNR) = 152). For the Sun’s spectrum, we have SNR = 439. The normalization of flux scale is fine tuned for the absorption line blend by applying a multiplicative correction factor taking as reference the continuum points at 4002.24 Å and/or 4021.47 Å.
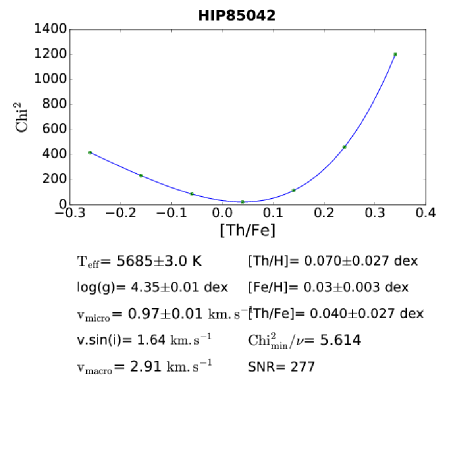
The procedure is particularly useful to directly estimate the error in Th abundance due to the spectral synthesis fitting itself, such that the error in [Th/Fe] is derived when increases in freedom degree unities from the minimum value along the polynomial fitting curve vs. [Th/Fe]. In this case, the freedom degree is equal to 4, because the window covers 5 pixels and there is a single free parameter that is the Th abundance itself (i.e. = npixels - nparameters). The thorium abundance uncertainties due to the propagation of the errors of photospheric parameters have been added in quadrature to the error of the spectral synthesis. Figure 2 illustrates the spectral synthesis procedure of the Th II line in the case of HIP 85042.
We have also verified the influence of errors in the abundances of carbon and cobalt in the Th abundance error due to the close proximity of those lines of Co I, CH and CN to the core of the Th II line. Taking the case of HIP 85042 as representative for the sample stars, the uncertainties in [Co/H] and [C/H] (Bedell et al., 2018) make changes in [Th/Fe] correspondent respectively to 0.003 and 0.002 dex, which are many times smaller than the other involved errors. Therefore the impact of Co and C abundance errors in the Th abundance analysis is negligible, and the final error in [Th/Fe] is basically fixed by the spectral synthesis error itself. The average error in [Th/Fe] is 0.025 dex considering 53 stars in total, after removing objects whose derived Th abundances are not acceptable, as justified in the following paragraph. Finally, the error in [Th/H] is computed in quadrature taking into account the error in [Fe/H], and it coincides with that one in [Th/Fe].
The final step for measuring the Th abundance is to check the quality of spectral synthesis of the whole analysed absorption blend on a star-by-star basis (sample of 67 stars). First of all, the fit is very unsatisfactory in the cases of HIP 65708 and HIP 83276 (the later certainly due to an unidentified problem in the data reduction). Results are not acceptable due to the low spectral SNR at the studied 30 Å-wide region for HIP 6407, HIP 81746 and HIP 89650 (roughly for SNR 130 and/or [Th/Fe] 0.070 dex). The blend has not been reproduced well for others 4 stars: HIP 10303, HIP 14501, HIP 30037, and HIP 115577 (two of them are alpha-rich old solar twins and there is nothing special related to the two others). Three out of these 9 eliminated stars (HIP 14501, HIP 65708, and HIP 115577) were also excluded from the fits made in the chemical evolution study of Bedell et al. (2018) because they were supposed to belong to the thick disc (ages above 8 Gyr and a visible enhancement in -elements).
For fifteen cases (HIP 3203, HIP 7585, HIP 18844, HIP 22263, HIP 25670, HIP 28066, HIP 30476, HIP 34511, HIP 40133, HIP 42333, HIP 73241, HIP 74432, HIP 79672, HIP 101905 and HIP 104045), we have improved the automated spectral synthesis fit by slightly changing the continuum level. We have also revised the spectral synthesis fit of the Th II blended feature for a few very young stars of our sample (4 stars in total) by modifying the rotational velocity in order to better globally reproduce the feature (decrease by about 8-20 per cent in .sin()). They are HIP 3203, HIP 4909, HIP 38072, and HIP 101905, having respectively a decrease of 8, 10, 20 and 13 per cent in .sin(). Despite of few cases, for which the rotational broadening had to be modified, we can state that the Th abundance is more sensitive to the continuum level than the rotational broadening.
We have investigated for several cases the impact of changing the abundance of Fe in order to get a better spectral synthesis fit since the blended feature is dominated by a Fe line, specially at the blue wing. We conclude that the derived Th abundance is just slightly modified within its error, even when the log (Fe) increases or decreases up to 5-10 times its error. The same conclusion is reached by changing the abundances of Ni, Mn and/or Ce, whose lines shape the blended red wing. Consequently, their derived Th abundances are not updated upon the effects of changing the Fe, Ni and Mn individual abundances.
In order to be consistent with the work of Bedell et al. (2018), we have decided to exclude from our analysis HIP 28066, HIP 30476, HIP 73241, HIP 74432 because they are -rich old solar twins, as well as HIP 64150 because it exhibits anomalous -process element abundances likely due to a past contamination from a close binary companion (Bedell et al., 2018; Spina et al., 2018; dos Santos et al., 2017).
In total we have measured and make available Th abundance for 58 solar twins. However, just 53 thin disc solar twins are adopted in our analysis of correlations of the Th abundance as function of [Fe/H] and isochrone stellar age (1 chemically anomalous in -elements and 4 -rich old stars are excluded). The Sun is not included in the analysis too. Table 3 shows the derived Th abundances in 58 solar twin stars.
| Star ID | [Th/H] | error | [Th/Fe] | error | SNR | |
|---|---|---|---|---|---|---|
| (dex) | (dex) | (dex) | (dex) | |||
| Sun | +0.005 | 0.021 | +0.005 | 0.021 | 439 | 6.144 |
| HIP 003203 | +0.120 | 0.034 | +0.170 | 0.033 | 319 | 0.041 |
| HIP 004909 | +0.180 | 0.023 | +0.132 | 0.022 | 534 | 10.978 |
| HIP 006407 | +0.004 | 0.081 | +0.062 | 0.081 | 121 | 1.901 |
| HIP 007585 | +0.193 | 0.018 | +0.110 | 0.018 | 454 | 3.796 |
| – | – | – | – | – | – | – |
| HIP 118115 | +0.009 | 0.026 | +0.045 | 0.026 | 295 | 0.071 |
4 Thorium abundance ratios versus metallicity and stellar age
We have analysed the derived Th abundances for 53 thin disc solar twins as a function of both metallicity and isochrone age. In this section we compile our results.
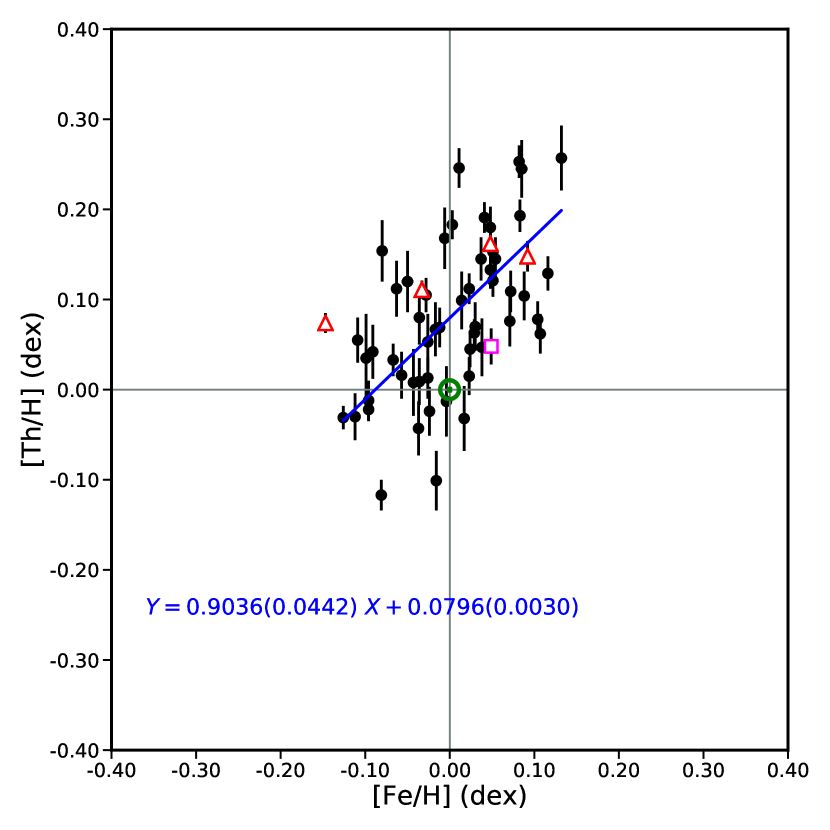
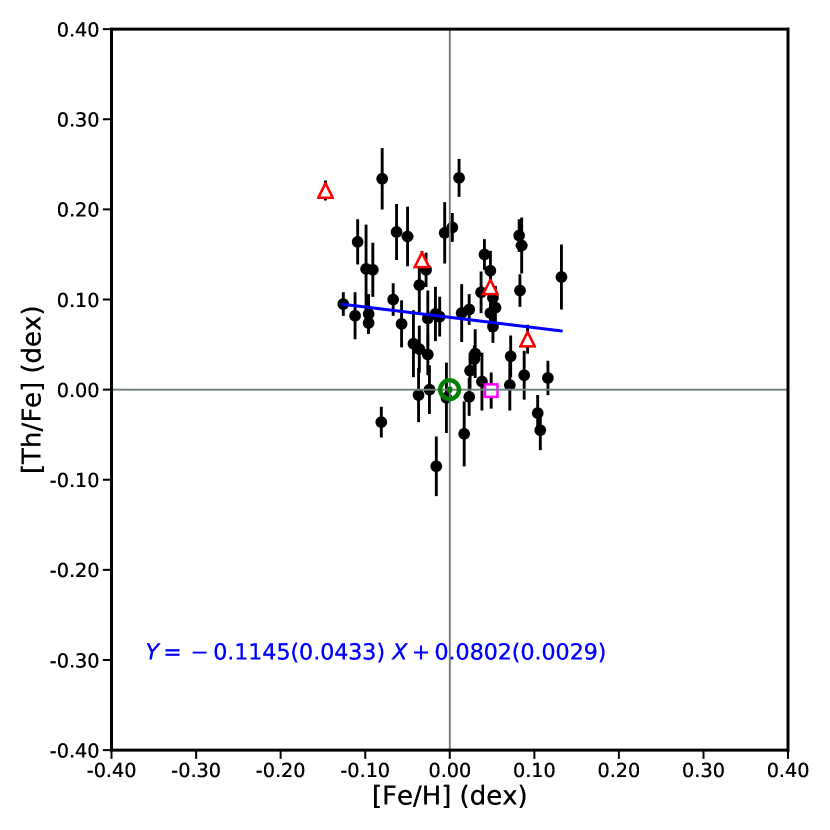
We have verified that the current (observed) Th abundance [Th/H] in solar-twin stars follows the Fe abundance over the very restricted metallicity interval of them. There is no (anti-)correlation between the observed values of [Th/Fe] and [Fe/H]. Figure 3 shows the observed [Th/H] and [Th/Fe] as a function of [Fe/H], in which linear fitting curves are drawn for illustration purposes only. The fitting procedure is further described in this section.
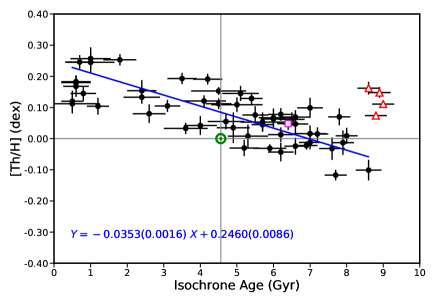
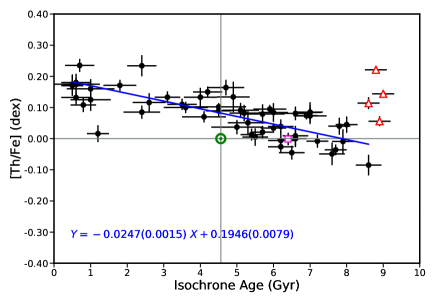
The observed strong anti-correlations [Th/H]-Age and [Th/Fe]-Age (current [Th/H] and [Th/Fe] ratios) are partially explained by the radioactive decay of Th, because after correcting the Th abundances by this effect, the anti-correlation [Th/H]-Age keeps existing rather than being erased. Figure 4 shows the observed [Th/H] and [Th/Fe] as a function of the isochrone stellar age, in which linear fitting curves are drawn for illustration purposes only.
The correction we have applied to transform the current values of [Th/H], [Th/Fe], [Th/Nd], [Th/Eu] and [Th/Si] into the pristine values on the zero age main sequence (ZAMS) are those given in Frebel et al. (2007) and Cayrel et al. (2001) adopting 14.05 Gyr as half life time of 232Th ((Th)), i.e. [Th/X]ZAMS = [Th/X]now + (ln(2).log(e)/(Th)).( - ), where [Th/X]ZAMS is the corrected abundance ratio relative to the Sun, [Th/X]now means the observed current [Th/X], X is a stable element, is the star isochrone age in Gyr, and = 4.56 Gyr. We have estimated the uncertainties in [Th/X]ZAMS through the propagation of the errors in [Th/X]now and isochrone age as well.
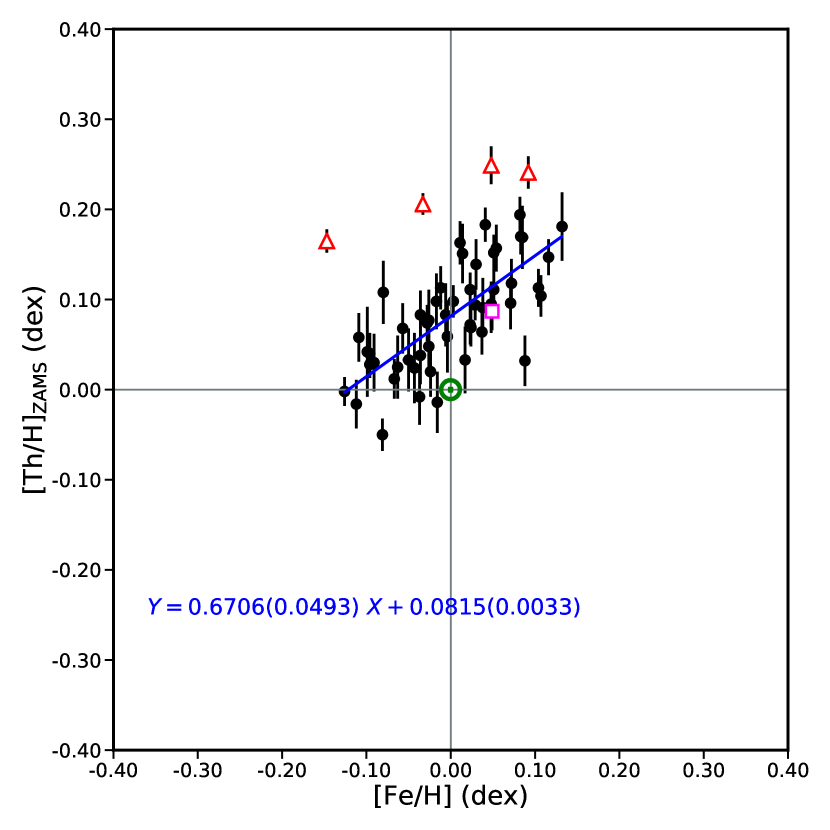
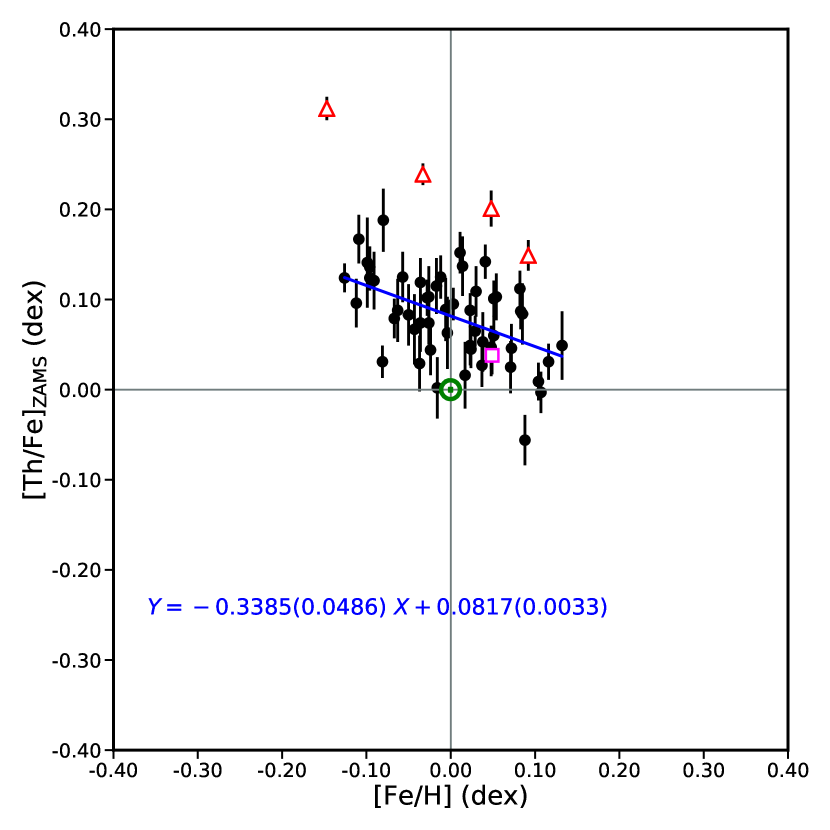
The pristine (corrected) [Th/H]ZAMS correlates well with [Fe/H] along the short metallicity scale of solar twins, making [Th/Fe]ZAMS not correlated with [Fe/H] (see Fig.5, in which we plot both [Th/H]ZAMS and [Th/Fe]ZAMS as a function of [Fe/H]).
We have fitted [Th/X] as a function of [Fe/H] (observed and ZAMS values for H and Fe) and also [Th/X] as a function of isochrone stellar age (observed and ZAMS values for H and Fe, and ZAMS values only for Nd, Eu and Si) through a linear fitting approach that minimizes the orthogonal distance of the data points to the fitting curve thats accounts for the uncertainties in both variables (it is an orthogonal distance linear regression with variance weighting in both and ). All fits to the data have been performed using the Kapteyn kmpfit package 222https://www.astro.rug.nl/software/kapteyn/index.html.
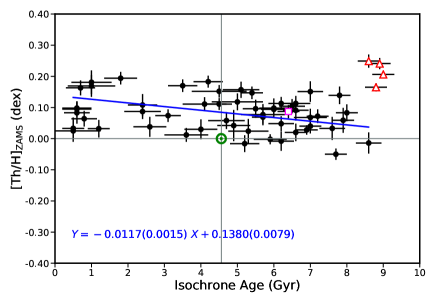
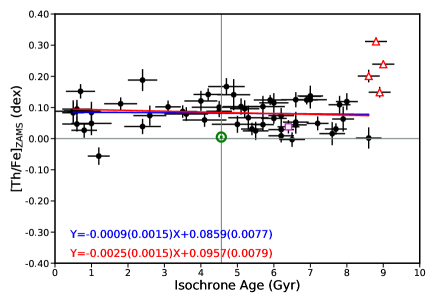
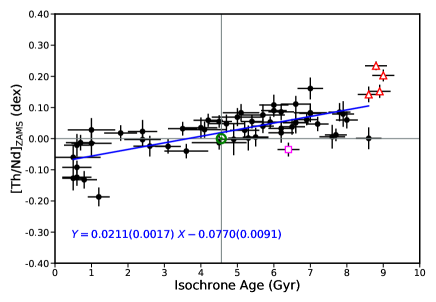
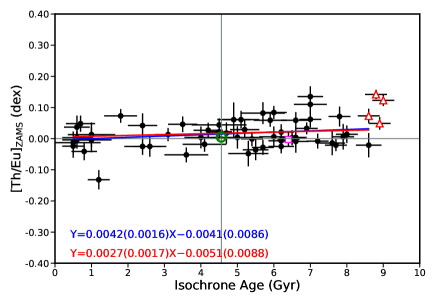
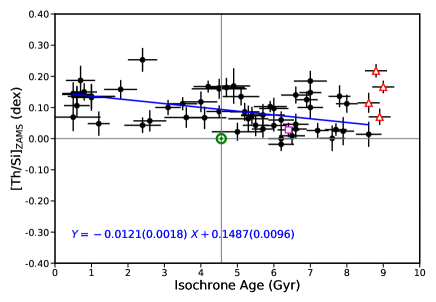
Figure 6 shows plots of [Th/X]ZAMS versus isochrone age (X: H, Fe, Nd, Eu and Si). Table 4 presents the results of the statistically robust linear fits of [Th/X]observed and [Th/X]ZAMS as a function of both [Fe/H] (where X: H and Fe only) and isochrone age (i.e. [Th/X]ZAMS = .[Fe/H] + and [Th/X]ZAMS = . + ).
The four main results about [Th/H]ZAMS and [Th/Fe]ZAMS in solar twins as a function of [Fe/H] and isochrone age are as follows.
(i) [Th/H]ZAMS correlates very well with [Fe/H] and the slope of this correlation is smaller than the unity (+0.6710.049). It is not surprise that [Th/Fe]ZAMS decreases with [Fe/H] over the restrict metallicity range of solar twins. Note that the relative uncertainty of the slope makes the linear correlations [Th/H]ZAMS-[Fe/H] and [Th/Fe]ZAMS-[Fe/H] statistically significant (about 14 and 7 of significance, respectively). See Fig. 6 and Tab. 4. This suggests that the abundance of Th in the interstellar medium keeps growing in some way during the Galactic thin disc evolution, despite the natural radioactive decay of Th and the iron production driven by the contribution from SNIa relatively to SN-II. We refer the reader to the temporal increase of abundance ratios relative to iron of stable -process elements such as Nd, Sm, Eu, Gd and Dy, as reported by Spina et al. (2018) (see Fig. 5 in their paper).
(ii) The pristine Th abundance in the sample solar twins seems to have been super-solar on average during the evolution of Galactic thin disc and it has certainly become super-solar since the epoch of the Sun formation. There are no stars with [Th/H]ZAMS < 0 dex with ages smaller than the solar one. We have obtained for the entire sample an average of [Th/H]ZAMS = +0.080 dex with a standard deviation of 0.058 dex. It ranges from -0.117 up to +0.257 dex (from 76 to 181 per cent of the ZAMS solar value), showing a linear temporal increase from +0.037 dex 8.6 Gyr ago up to +0.138 dex now (8.6 Gyr is the isochrone age of the oldest star in our analised sample). Note that the uncertainty of the slope of the relation [Th/H]ZAMS-Age corresponds to only 13 per cent of its value (about 8 of significance). See Fig. 6 and Tab. 4. The Sun at ZAMS seems to be somehow deficient in Th when compared against twin stars, specially for stars younger than itself. It is also interesting to note that all four -rich stars are richer in Th on average than the other Galactic thin disc stars of similar ages; exactly as found for Nd, Sm and Eu in Spina et al. (2018).
(iii) [Th/Fe]ZAMS shows no correlation with the isochrone age. Note that the relative error of the slope is greater than 100 per cent. [Th/Fe]ZAMS has likely kept super-solar during the Galactic thin disc evolution, showing an average of +0.0860.008 dex ( = 0.047 dex). Super-solar Th/Fe ratios for youngest stars could be due to an increased production of Th relatively to Fe, perhaps due to neutron star mergers. Spina et al. (2018) also found that the slope of [X/Fe]-Age for stable -capture elements (in dex.Gyr-1 unity) seems to be anti-correlated with the solar -process contribution percentage taken from Bisterzo et al. (2014) (see Fig. 6 in Spina et al. (2018)), such that the -process elements Eu, Gd, Dy and Sm (showing -process contributions smaller than about 35 per cent) have the smallest slopes in modulus like Th, which exhibits a statistically null slope even after removing one borderline 3 threshold outlier (HIP 101905 that is a young star relatively poor in Th for its metalllicity). The slope of [Th/Fe]-Age becomes -0.00250.0015 without HIP 101905, which is not significantly different from zero (presenting a confidence level of about 1.7). See Fig. 6 and Tab. 4.
(iv) There are uniform real dispersions of [Th/H]ZAMS and [Th/Fe]ZAMS over the whole isochrone age scale on average ( close to 0.056 and 0.047 dex, respectively).
| ||/ | |||||||
| [Th/X] vs. [Fe/H] | |||||||
| (dex) | (dex) | (dex) | |||||
| [Th/H]obs | +0.904 | 0.044 | +0.080 | 0.003 | 0.071 | 8.8 | 20.5 |
| [Th/Fe]obs | -0.114 | 0.043 | +0.080 | 0.003 | 0.071 | 9.2 | 2.6 |
| [Th/H]ZAMS | +0.671 | 0.049 | +0.081 | 0.003 | 0.040 | 2.6 | 13.7 |
| [Th/Fe]ZAMS | -0.338 | 0.049 | +0.082 | 0.003 | 0.040 | 2.6 | 6.9 |
| [Th/X] vs. | |||||||
| (dex.Gyr-1) | (dex.Gyr-1) | (dex) | (dex) | (dex) | |||
| [Th/H]obs | -0.0353 | 0.0016 | +0.246 | 0.009 | 0.058 | 4.5 | 22.1 |
| [Th/Fe]obs | -0.0247 | 0.0015 | +0.195 | 0.008 | 0.048 | 3.5 | 16.5 |
| [Th/H]ZAMS | -0.0117 | 0.0015 | +0.138 | 0.008 | 0.056 | 5.2 | 7.8 |
| [Th/Fe]ZAMS | -0.0009 | 0.0015 | +0.086 | 0.008 | 0.047 | 3.6 | 0.6 |
| *[Th/Fe]ZAMS | -0.0025 | 0.0015 | +0.096 | 0.008 | 0.043 | 3.2 | 1.7 |
| [Th/Nd]ZAMS | +0.0211 | 0.0017 | -0.077 | 0.009 | 0.046 | 2.4 | 12.4 |
| [Th/Eu]ZAMS | +0.0042 | 0.0016 | -0.004 | 0.009 | 0.043 | 2.4 | 2.6 |
| *[Th/Eu]ZAMS | +0.0027 | 0.0017 | -0.005 | 0.009 | 0.039 | 2.1 | 1.6 |
| [Th/Si]ZAMS | -0.0121 | 0.0018 | +0.149 | 0.010 | 0.053 | 3.1 | 6.7 |
By comparing Th against neodymium (Nd) and europium (Eu), two others -capture elements that are otherwise stable nuclei indeed, we have noticed that [Th/Nd]ZAMS decreases with the stellar age, but [Th/Eu]ZAMS has kept constant around solar ratio over the Galactic thin disc evolution. Whilst [Th/Nd]ZAMS has a linear decrease from +0.104 dex 8.6 Gyr ago up to -0.077 dex now on average (fitting = 0.046 dex), the average of [Th/Eu]ZAMS oscillates around +0.014 dex with a standard deviation of 0.045 dex. The slope of the relation [Th/Nd]ZAMS-Age has a 12.4 of significance, and the relation [Th/Eu]ZAMS-Age has just 2.4 of significance. In case of removing one borderline outlier slightly beyond 3 (HIP 101905 that is a young star relatively poor in Th for its metalllicity), the slope of [Th/Eu]-Age is even more compatible with zero (1.6 of significance). See Fig. 6 and Tab. 4. These results confirm that Th follows Eu during the Galaxy’s thin disc evolution. However, it does not follow Nd. In fact, the contribution of -process for the abundance Nd in the Solar System is estimated to be 57.54.1 per cent, while for Eu it is 6.00.4 per cent (Bisterzo et al., 2014; Spina et al., 2018). The decrease of [Th/Nd]ZAMS with time may be explained by an increasing contribution from the -process due to low-mass AGB stars in the Galactic thin disc as discussed by Spina et al. (2018). Therefore, our observations are in line with Nd not being a pure -process element, but likely having an important -process contribution, as already suggested by Bisterzo et al. (2014).
On the other hand [Th/Si]ZAMS has likely had a temporal increasing evolution from +0.045 dex 8.6 Gyr ago up to +0.149 dex now on average (over the super-solar regime). The anti-correlation [Th/Si]ZAMS-Age has a slope with a relative uncertainty of 15 per cent only or about 7 of significance (under a = 0.053 dex; see Fig. 6 and Tab. 4). Silicon (Si) is one of the most abundant refractory elements in a terrestrial planet and its planetary abundance is closely related to the mantle mass (McDonough, 2003). Thus the abundance ratio Th/Si provides comparison of the Th abundance among telluric planets with different silicate mantle thickness (Unterborn et al., 2015). A higher [Th/Si]ZAMS can indirectly indicate a higher probability of having a convective mantle in a terrestrial planet due to a higher radioactive energy budget from the Th decay.
Thus our results suggest that most solar twins in the Galactic thin disc have the same capability as the Sun to have rocky planets with convective mantles, and perhaps suitable for life.
5 Conclusions
We have confirmed that there is a large energy budget from the Th decay for keeping the mantle convection and thickness of potential rocky planets around Sun-like stars, since the Galactic thin disc formation until now, because we have measured [Th/H]ZAMS as super-solar on average during the Galactic thin disc life. Whilst the observed [Th/H] varies from -0.117 up to +0.257 dex (from 76 up to 181 per cent of the current observed solar value), [Th/H]ZAMS seems to have linearly changed on average from +0.037 dex 8.6 Gyr ago up to +0.138 dex now (from 109 up to 137 per cent of the ZAMS solar value), showing a uniform dispersion of about 0.056 dex (linear fitting ), such that [Th/H]ZAMS seems to have certainly become super-solar for all analysed solar twin stars since the epoch of Solar System formation. [Th/Fe]ZAMS has kept nearly constant and super-solar as well during the Galactic thin disc evolution (around +0.0860.008 dex under a linear fitting equal to 0.047 dex). The Sun at ZAMS actually seems to be deficient in Th when specifically compared against younger solar twins. Whilst the observed [Th/Fe]obs is linearly well anti-correlated with isochrone age, [Th/Fe]ZAMS shows no relation with age. They both actually seem to have been super-solar on average during practically the entire Galactic thin disc evolution. [Th/Nd]ZAMS has linearly decreased from +0.104 dex 8.6 Gyr ago up to -0.077 dex now on average. [Th/Eu]ZAMS has likely kept constant around solar ratio during the Galactic thin disc evolution, exhibiting a moderate dispersion of about 0.04 dex. This implies that Th follows Eu during the Galaxy’s thin disc evolution, but it does not Nd. The decrease of [Th/Nd]ZAMS with time may be explained by a crescent contribution from the -process in low-mass AGB stars, indicating that Nd is not exactly a pure -process element. In fact, it has an estimated -process production close to 60 per cent in the Solar System (Bisterzo et al., 2014). [Th/Si]ZAMS has probably had a real increase from +0.045 dex 8.6 Gyr ago up to +0.149 dex now on average.
Our results suggest that solar twin stars in the Galactic thin disc are as probable as the Sun to host rocky planets with convective mantles, and perhaps with suitable geological conditions for habitability.
Acknowledgements
RB acknowledges the CAPES grant (093.875.006-24). AM acknowledges the CNPq grant (309562/2015-5). JM thanks FAPESP (2012/24392-2). The research by MA has been supported by the Australian Research Council (grants FL110100012 and DP150100250). We all are grateful for the anonymous referee by his valuable revision to improve the paper.
References
- Asplund et al. (2009) Asplund M., Grevesse N., Sauval A. J., Scott P. 2009, ARA&A, 47, 481
- Barklem & Collet (2006) Barklem P. S., Collet R. 2016, A&A, 588A, 96B
- Baumann et al. (2010) Baumann P., Ramírez I., Meléndez J., Asplund M., Lind K. 2010, A&A, 519, A87
- Bedell et al. (2018) Bedell M., Bean J. L., Meléndez J., Spina L., et al. 2018, ApJ, in press,
- Bedell et al. (2015) Bedell M., Meléndez J., Bean J. L., Ramírez I., Asplund M., Alves-Brito A., Casagrande L., Dreizler S., Monroe T., Spina L., Tucci Maia M. 2015, A&A, 581, 34
- Bisterzo et al. (2014) Bisterzo S., Travaglio C., Gallino R., Wiescher M., Kappeler F. 2014, ApJ, 787, 10
- Butcher (1987) Butcher H. R. 1987, Nature, 328, 127
- Castelli & Kurucz (2004) Castelli F., Kurucz R. L. 2004, ArXiv Astrophysics e-prints, astro-ph/0405087
- Cayrel et al. (2001) Cayrel R. et al. 2001, Nature, 409, 691
- Cox (2000) Cox A. N. 2000, Introduction. p. 1
- Cowan et al. (1997) Cowan J. J., McWilliam A., Sneden C., Burris D. L. 1997, ApJ, 480, 246
- Dehnen & Binney (1998) Dehnen W., Binney J. J. 1998, MNRAS, 298, 387
- del Peloso et al. (2005a) del Peloso E. F., da Silva L., Arany-Prado L. I. 2005a, A&A, 434, 301
- del Peloso et al. (2005b) del Peloso E. F., da Silva L., Porto de Mello G. F., Arany-Prado L. I. 2005b, A&A, 440, 1153
- dos Santos et al. (2016) dos Santos L. A., Meléndez J., do Nascimento, J-D., Bedell M., Ramírez I., Bean J. L., Asplund M., Spina L., Dreizler S., Alves-Brito A., Casagrande L. 2016, A&A, 592, 156
- dos Santos et al. (2017) dos Santos L. A., Meléndez J., Bedell M. et al. 2017, MNRAS, 472, 3425
- Frebel et al. (2007) Frebel A., Christlieb R., Norris, J. H., Thom C., Beers T. C., Rhee J. 2007, ApJ, 660, L117
- Grevesse et al. (2015) Grevesse N., Scott P., Asplund M., Sauval A. J. 2015, A&A, 573, A27
- Johnson & Bolte (2001) Johnson J. A., Bolte M. 2001, ApJ, 554, 888
- Johnson & Soderblom (1987) Johnson D. R. H, Soderblom D. R. 1987, AJ, 93, 864
- Kupka et al. (2000) Kupka F. G., Ryabchikova T. A., Piskunov N. E., Stempels H. C., Weiss W. W. 2000, BaltA, 9, 590
- Kurucz (2017) Kurucz R. L. 2017, CaJPh, 95, 825
- Honda et al. (2004) Honda S., Aoki W., Kajino T., et al. 2004, ApJ, 607, 474
- Huang et al. (2013) Huang Y., Chubakov V., Mantovani F., Rudnick R. L., McDonough W. F. 2013, GGG, 14,
- Lawler et al. (1990) Lawler J. E., Whaling W., Grevesse N. 1990, Nature, 346, 635
- Mayor et al. (2003) Mayor M., Pepe F., Queloz D., et al. 2003, The Messenger, 114, 20
- McDonough (2003) McDonough W. F. 2003, Compositional Model for the Earth’s Core - Amsterdam: Elsevier, ,
- Meléndez et al. (2015) Meléndez J., Bean J. L., Bedell M., et al. 2015, The Messenger, 161, 28
- Meléndez et al. (2017) Meléndez J., Bedell M., Bean J. L., Ramírez I., Asplund M., Dreizler S., Yan H-L., Shi J-R., Lind K., Ferraz-Mello S., Galarza J. Y., dos Santos L., Spina L., Maia M. T., Alves-Brito A., Monroe T., Casagrande L. 2017, A&A, 597, A34
- Misra et al. (2015) Misra A., Krissansen-Totton J., Koehler M. C., Sholes S. 2015, AsBio, 15, 462
- Morell et al. (1992) Morell O., Kallander D., Butcher H. R. 1992, A&A, 259, 543
- Nilsson et al. (2002) Nilsson H., Zhang Z. G., Lundberg H., Johansson S., Nordström B. 2002, A&A, 382, 368
- Ramírez et al. (2014a) Ramírez I., Meléndez J., Asplund M. 2014a, A&A, 561, A7
- Ramírez et al. (2014b) Ramírez I., et al. 2014b, A&A, 572, A48
- Reddy et al. (2006) Reddy B. E., Lambert D. L., Allende Prieto C. 2006, MNRAS, 367, 1329
- Roederer et al. (2009) Roederer I. U., Kratz K-L., Frebel A., Christlieb N., Pfeiffer B., Cowan J. J., Sneden C. 2009, ApJ, 698, 1963
- Sneden (1973) Sneden C. A. 1973, PhD thesis, THE UNIVERSITY OF TEXAS AT AUSTIN.
- Spina et al. (2018) Spina L., Meléndez J., Karakas A. I., et al. 2018, MNRAS, 474, 2580
- Unterborn et al. (2015) Unterborn C. T., Johnson J. A., Panero W. R. 2015, ApJ, 806, 139
- Walker et al. (1981) Walker J. C. G., Hays P. B., Kasting J. F. 1981, JGR, 86, 9776