The Curious Case of Swift J1753.5-0127: A Black Hole Low-mass X-ray Binary Analogue to Z Cam Type Dwarf Novae
Abstract
Swift J1753.5-0127 (J1753) is a candidate black hole low-mass X-ray binary (BH-LMXB) that was discovered in outburst in May 2005. It remained in outburst for years, exhibiting a wide range of variability on various timescales, before entering quiescence after two short-lived, low-luminosity “mini-outbursts” in April 2017. The unusually long outburst duration in such a short-period ( hrs) source, and complex variability observed during this outburst period, challenges the predictions of the widely accepted disc-instability model, which has been shown to broadly reproduce the behaviour of LMXB systems well. The long-term behaviour observed in J1753 is reminiscent of the Z Cam class of dwarf novae, whereby variable mass transfer from the companion star drives unusual outbursts, characterized by stalled decays and abrupt changes in luminosity. Using sophisticated modelling of the multi-wavelength light curves and spectra of J1753, during the years the source was active, we investigate the hypothesis that periods of enhanced mass transfer from the companion star may have driven this unusually long outburst. Our modelling suggests that J1753 is in fact a BH-LMXB analogue to Z Cam systems, where the variable mass transfer from the companion star is driven by the changing irradiation properties of the system, affecting both the disc and companion star.
keywords:
accretion — accretion discs — black hole physics — stars: black holes — X-rays: binaries — stars: individual (Swift J1753.5-0127)1 Introduction
Low-mass X-ray binaries (LMXBs) are binary systems consisting of a compact object (black hole or neutron star) accreting matter from a low-mass () main sequence companion. Most LMXBs exhibit transient behaviour, characterized by long periods of quiescence (years to decades), followed by bright outbursts in which the X-ray and optical luminosity increases by several orders of magnitude (Chen et al., 1997; Tetarenko et al., 2016).
The mechanism behind LMXB outbursts can broadly be explained with the disc-instability model (DIM; Osaki, 1974; Meyer & Meyer-Hofmeister, 1981; Smak, 1983, 1984; Cannizzo et al., 1985; Cannizzo, 1993; Huang & Wheeler, 1989). Originally developed to explain outbursts in dwarf novae, the DIM explains transient behaviour in the context of the accretion disc cycling between a hot, ionized outburst state and a cool, neutral, quiescent state. This limit-cycle is triggered by the accumulation of matter in the disc, eventually heating the disc until a substantial portion is ionized. In this hot, ionized state, the viscosity (i.e. ability to move angular momentum outwards) of the disc dramatically increases, ultimately resulting in matter rapidly falling onto the compact object, triggering a bright outburst.
The DIM has been shown to reproduce the global behaviour of a number of transient and persistent LMXBs (e.g. Coriat et al., 2012; Tetarenko et al., 2016). However, to do so it must be modified to include irradiation heating from the inner accretion disc (Dubus et al., 1999, 2001). Most of the ultraviolet, optical and infrared light emitted by LMXB accretion discs is the result of reprocessed X-rays from the inner regions of the accretion flow heating the outer disc111Note that there exists alternative models attributing the dominant source of optical/UV emission (during LMXB outbursts) to self-produced synchrotron emission from a hot corona flow, rather than the irradiated disc itself. See Veledina et al. (2017) and references therein for details. (van Paradijs, 1983; van Paradijs & McClintock, 1994; van Paradijs, 1996). This X-ray irradiation is the dominant factor determining the temperature over the majority of the accretion disc during outburst. However, despite decades of theoretical work, the actual fraction of the central X-ray flux that is intercepted and reprocessed in the outer disc regions of LMXBs remains largely uncertain.
Outburst durations in LMXBs harbouring stellar-mass black holes (BH-LMXBs) are typically consistent with the viscous timescale of accretion discs (months, see e.g. Tetarenko et al., 2016). Therefore, studying these binary systems during outburst allows us to probe the fundamental physics of accreting X-ray irradiated discs on accessible timescales. Recently, Tetarenko et al. (2018b) developed an analytical methodology to describe the outburst light curves of the Galactic BH-LMXB population in the context of the irradiated DIM. With this methodology, Tetarenko et al. (2018b) were able to quantify both angular-momentum and mass transport (via the -viscosity parameter; Shakura & Sunyaev 1973) within these discs, and the physical properties of their X-ray irradiation heating.
In another recent study, Tetarenko et al. (2018a) demonstrated how the extremely diverse light curve morphology observed across the BH-LMXB population provides evidence for a likely temporally and spatially varying irradiation source heating the discs in these systems. In this paper, we build on their progress, presenting an alternative method to tackle this complex, multi-scale problem using the unusual BH-LMXB Swift J1753.5-0127 as a case study.
Swift J1753.5-0127 (hereafter J1753) was discovered by the Burst Alert Telescope (BAT; Barthelmy et al., 2005) on board the Neil Gehrels Swift Observatory (Swift) in 2005 (Palmer et al., 2005). The source luminosity peaked within a week, at a flux of 200 mCrab, as observed by the Rossi X-Ray Timing Explorer’s (RXTE) All-Sky Monitor (Cadolle Bel et al., 2007). Identification of a optical counterpart (Halpern, 2005), magnitudes brighter than the limit of the Digitized Sky Survey, established J1753 as a new LMXB.
Although the mass of the primary has not yet been dynamically measured, J1753 is classified as a BH candidate (BHC). RXTE observations revealed a 0.6 Hz quasi-periodic oscillation (QPO) with characteristics typical of BHCs (Morgan et al., 2005). In addition, the hard X-ray spectrum was found to exhibit a hard power-law tail up to keV, very typical of a BHC in a hard accretion state (Cadolle Bel et al., 2007). By investigating the double-peaked hydrogen recombination lines in the optical spectrum, Shaw et al. (2016b) calculated a conservative lower limit to the mass of the primary, , strongly favouring a BH nature for the compact object in J1753. The orbital period of J1753 is known to be h222This photometric period is likely a superhump period, slightly larger than the orbital period, due to an extreme mass ratio between the primary and the secondary from periodic variability in its optical light curves observed during outburst (Zurita et al., 2008). The high amplitude variations in the -band orbital light curve suggest that the inclination, , is high. However, the source is not dipping nor eclipsing, and a measurement of remains elusive (see Shaw et al., 2016b), so previous studies have adopted values of (e.g. Neustroev et al., 2014; Tomsick et al., 2015). The distance, , to J1753 is also an unknown, with no measurement from radio parallax, and a poorly constrained optical parallax from Gaia (Gandhi et al., 2018). However, Zurita et al. (2008) estimate kpc based on the relationship between and the observed peak -band magnitude (Shahbaz & Kuulkers, 1998). Froning et al. (2014), on the other hand, derive kpc from modelling the UV spectrum. Gandhi et al. (2018), using prior knowledge of the density of LMXBs in the bulge, disc, and sphere of the Milky Way Galaxy and Bayesian statistical techniques, estimate a posterior distribution on distance of kpc. We make use of this distance estimate in this paper.
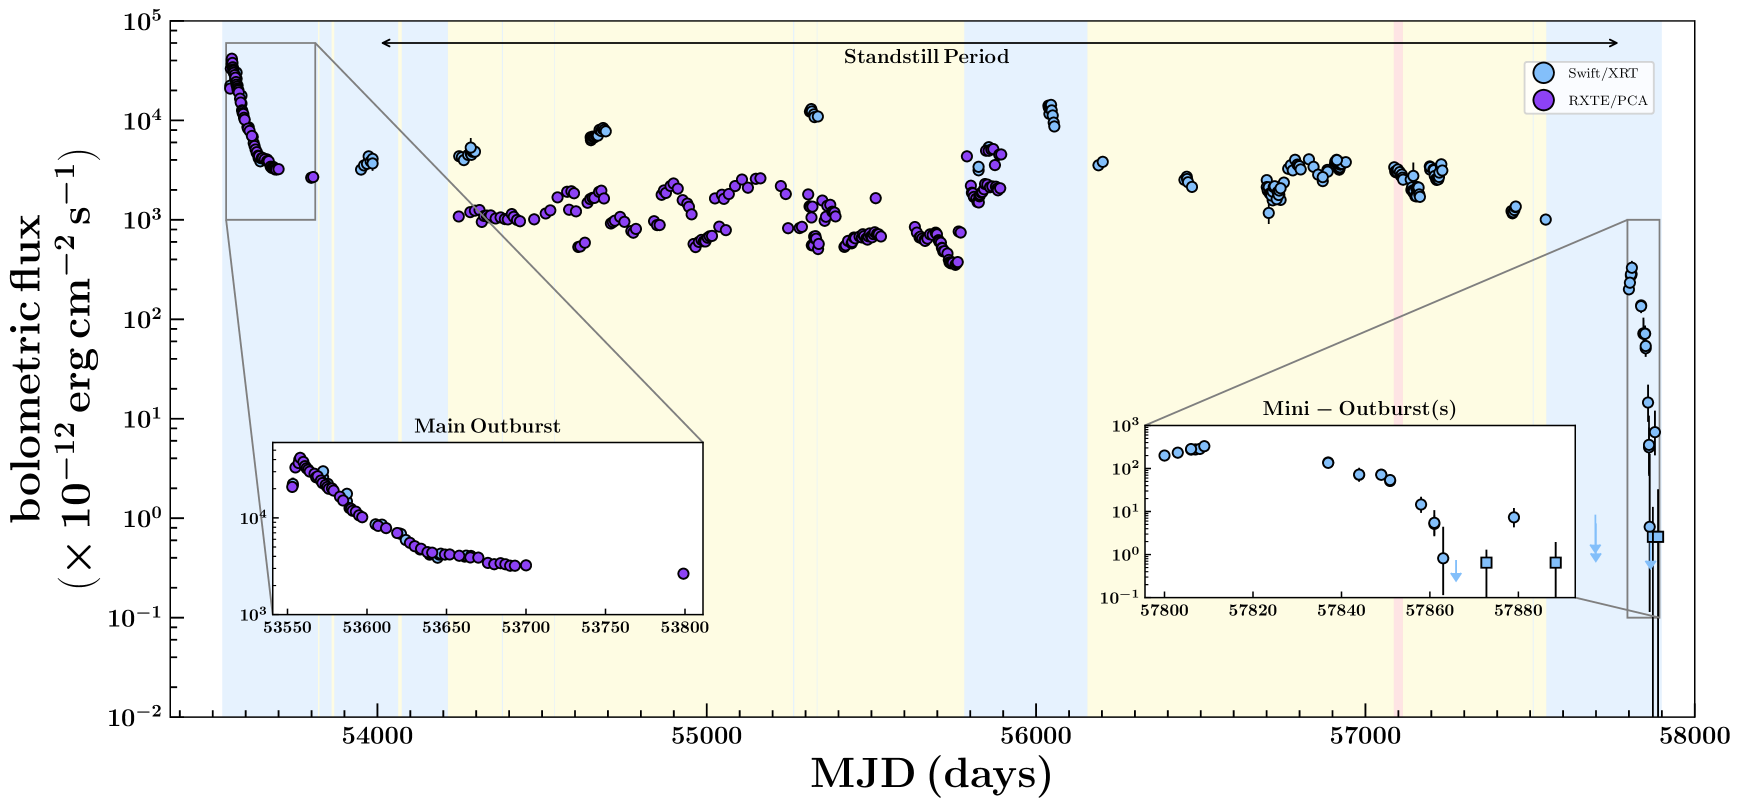
Almost immediately after its peak, the flux of J1753 began to decline exponentially, as is typical with similar BH-LMXBs. However, instead of returning to quiescence the decay stalled, remaining at roughly constant flux at approximately mCrab for over 6 months (Cadolle Bel et al., 2007) before appearing to increase in flux once more (see e.g. Shaw et al., 2013). For the following years, the source continued to be active, exhibiting significant long term variability (see e.g. Soleri et al., 2013; Shaw et al., 2013). J1753 remained a persistent LMXB in a hard accretion state for the majority of this prolonged period of activity, aside from a brief excursion to a low-luminosity soft, disc-dominated accretion state in 2015 (Shaw et al., 2016a; Rushton et al., 2016).
In November 2016, observations of J1753 with the Faulkes Telescope North indicated a fading optical flux (Russell et al., 2016; Al Qasim et al., 2016). Shaw et al. (2016d) confirmed the decay with a non-detection by both the Swift X-ray Telescope (XRT; Burrows et al., 2005) and Ultra-Violet/Optical Telescope (UVOT; Roming et al., 2005). Unfortunately due to the source becoming Sun constrained soon after the decay to quiescence was noted, follow-up opportunities were limited (Neustroev et al., 2016; Plotkin et al., 2016). Upon emerging from the Sun constraint, J1753 was found to be active once more, having undergone a mini-outburst (Al Qasim et al., 2017; Bright et al., 2017; Tomsick et al., 2017)333We choose the nomenclature ‘mini-outburst’ to remain consistent with Plotkin et al. (2017), who note that the flux during this period was at similar levels prior to quiescence. Following Chen et al. (1997), such behaviour is referred to as a ‘mini-outburst.’ See discussion in Zhang et al. (2018, submitted). which lasted from late January 2017 until April 2017, when the flux appeared to return to quiescent levels (Shaw et al., 2017). However, in late April 2017, J1753 underwent another, shorter duration mini-outburst (Bernardini et al., 2017), before finally entering a seemingly more permanent quiescent state in July of the same year (Zhang et al., 2017).
In this paper, we initially focus on the first mini-outburst of J1753 during its descent into quiescence. We utilize near-simultaneous near-infrared (NIR), optical, ultraviolet (UV) and X-ray data in an attempt to model and constrain how the physical properties of the X-ray irradiation source heating an accretion disc varies over time during outburst. To achieve this we have developed a Bayesian algorithm to fit the observed UV, optical and NIR (UVOIR) spectral energy distribution (SEDs) with an irradiated disc model. We then compare the mini-outburst with the main outburst of J1753 in an attempt to investigate the nature of its long-term behaviour.
The paper format is as follows: Section 2 describes in detail the irradiated disc model and the Bayesian algorithm used to fit such a model to observed SEDs. Section 3 describes the observations we have utilized in this work. Section 4 presents the results from fitting the X-ray spectra, UVOIR SEDs, X-ray light curves, and UVOIR-X-ray correlations during the 12 yrs that J1753 was active. Section 5 discusses the nature of the unusual long-term behaviour displayed by J1753 over the past 12 years, drawing a parallel with Z Cam type dwarf novae. Lastly, Section 6 provides a summary of this work.
2 Modelling X-ray Irradiated Accretion Discs
2.1 The Irradiated Disc Model
Simultaneous, multi-wavelength data sets can constrain the evolution and X-ray irradiation and heating of the accretion disc through LMXB outbursts. By modelling the observed UVOIR SED of a LMXB system, at different times throughout an outburst, one can effectively track the evolution of the physical properties of the X-ray irradiation source heating the disc in the system (e.g. Hynes 2005, Russell et al. 2006, Meshcheryakov et al. 2018).
Starting with a power-law temperature distribution of the form,
| (1) |
and assuming a local blackbody spectrum in a particular disc annulus at radius , we can describe the integrated SED of the disc in terms of 3 parameters: the inner disc temperature (), temperature of the outer disc (), and the disc normalization (). The resulting SED takes the form,
| (2) |
where is Planck’s law integrated over the disc, using the general substitution , and must be evaluated numerically. The normalization takes the form
| (3) |
To model the X-ray irradiation heating LMXB accretion discs, we use the prescription presented in Dubus et al. (2001),
| (4) |
where the irradiating flux drops off with the inverse square of the disc radius. Here is a constant representing the fraction of the X-ray luminosity intercepted and reprocessed by the disc.
We consider temperature profiles (Eq. 1) with the power-law index equal to (i.e., standard irradiated disc) or (i.e., a maximally-irradiated, isothermal disc). In addition to these irradiated cases, we also consider the model, appropriate for a non-irradiated disc. See Hynes et al. (2002) and Hynes (2005) for detailed discussions of the various temperature profile options to fit UVOIR SEDs of LMXBs.
In addition to reprocessed X-rays, OIR emission may also be produced by relativistic jets, as seen to dominate during the hard accretion states of some BH-LMXBs (e.g., see Homan et al. 2005; Russell et al. 2006). These jets produce a spectrum consisting of a flat, optically thick component and a steep, optically thin component that can extend from the radio to OIR wavelengths (Fender, 2001; Corbel & Fender, 2002; Homan et al., 2005; Russell et al., 2006; Chaty et al., 2011; Rahoui et al., 2015). In the UVOIR wavelength range, we model only the optically thin part of the jet spectrum, as the jet break in BH-LMXBs is usually at lower frequencies (see e.g. Gandhi et al., 2011). Thus, when required, we add a single power-law function to the disc model described above. The power law takes form , where is the power-law normalization and is the power-law index.
2.2 Markov-Chain Monte Carlo (MCMC) Algorithm
We use a Bayesian algorithm to estimate the three to five parameters required to describe the observed UVOIR SEDs of a BH-LMXB in outburst: the (i) inner disc temperature (), (ii) temperature of the outer disc (), (iii) disc normalisation (), (iv) power-law normalisation () and (v) power-law index (). Specifically, we make use of the emcee python package (Foreman-Mackey et al., 2013), an implementation of Goodman & Weare’s Affine Invariant MCMC Ensemble Sampler (Goodman & Weare, 2010), to fit the observed UVOIR SEDs with the models described in Section 2.1.
emcee works by using a modified version of the Metropolis-Hastings Algorithm, where an ensemble of “walkers” simultaneously explores the parameter space. We use a number of walkers equal to 10 times the model dimensions to fit our SEDs. For the initial inspection of our parameter space, we use a harmony search global optimization algorithm called pyHarmonySearch (Geem et al., 2001) for all parameters except for . The “best guess” provided by pyHarmonySearch acts as a starting point for the MCMC walkers.
The prior distribution and initialization for is set using the constraints from the X-ray spectral fits. As no disc component is observed in the keV band XRT spectra, we use a uniform distribution () as the prior for . The prior distributions for the remaining four parameters (, , , ) are chosen to be Gaussians, with means set using the pyHarmonySearch harmony search global optimization algorithm.
After initialization, the MCMC is run on each SED, starting with a “burn-in” phase where an ensemble of “walkers” are evolved over a series of 500 steps. Following the burn-in phase, the MCMC is run again, until convergence. The MCMC algorithm outputs the converged solution in the form of posterior distributions of each parameter. We take the median and 1 (68%) confidence interval of each posterior distribution as the best-fit result for each parameter.
3 Observations and Data Reduction
3.1 X-ray
3.1.1 Swift/XRT
We utilised 17 Swift/XRT observations of J1753 during the two observed mini-outbursts (ObsIDs 00030090116 – 00030090137), from 2017 Feb 16 to May 15. XRT observed in auto exposure mode for the majority of this time, adjusting the CCD readout mode between windowed timing (WT) and photon counting (PC) modes depending on the source count rate.
Data were reprocessed using the heasoft v6.23 task xrtpipeline. WT mode observations were extracted from a 20 pixel () radius circular aperture centered on the source. Background spectra in WT mode were extracted from an annulus centered on the source with inner and outer radii of 80 and 120 pixels, respectively.444http://www.swift.ac.uk/analysis/xrt/backscal.php PC mode observations are more susceptible to photon pile-up than WT mode observations. Thus, PC mode source spectra were initially extracted from a circular region of the same radius as in WT mode, and the average count rate was then calculated in order to determine if photon pile-up was significant. Observations with count rates higher than count s-1 were re-extracted using an annular region with an outer radius of 20 pixels and the central portion of the point spread function excluded. The radius of the excluded region was determined by NASA’s ximage package555http://www.swift.ac.uk/analysis/xrt/pileup.php and ranged from pixels. PC mode background spectra were extracted from an annulus centered on the source with inner and outer radii of 50 and 70 pixels, respectively.
Source and background spectra were extracted using the heasoft tool xrtproducts and were grouped such that each energy bin contained a minimum of one count. Ancillary response files were generated with xrtmkarf and the relevant canned response matrix files were obtained from the High Energy Astrophysics Science Archive Research Center (HEASARC) calibration database (CALDB). All X-ray spectral fits were performed in xspec v.12.10.0 (Arnaud, 1996), using Cash statistics for background subtracted spectra (W-statistic; Cash, 1979). Interstellar absorption was accounted for with the tbabs model with Wilms et al. (2000) abundances and Verner et al. (1996) photoionisation cross-sections. Unabsorbed 2–10 keV fluxes were calculated using the cflux model. All uncertainties on parameters derived from the X-ray spectral fits are at the 90% confidence level, unless otherwise stated.
For observations where the source was not detected by Swift/XRT, we derived 90% confidence upper limits on the 2–10 keV flux using the methods described by Gehrels (1986). We assumed a power-law model with index (e.g. Shaw et al., 2016c) and a hydrogen column density cm-2 (Froning et al., 2014). For observations where a source was clearly detected (at % confidence), but at a low count rate such that X-ray spectral fitting was not possible, we followed the procedure of Plotkin et al. (2017). Fluxes in this case were derived assuming the same model as above and we derived uncertainties using 90% confidence intervals from Kraft et al. (1991), factoring in a photon index that was allowed vary from .
3.1.2 Long-term X-ray Light Curves
We built a long-term X-ray light curve for J1753 using data from the (i) RXTE/Proportional Counter Array (PCA) and (ii) Swift/XRT.
We collected all the RXTE/PCA data from the WATCHDOG project (Tetarenko et al., 2016). These datasets include (i) good pointed PCA observations (i.e. no scans or slews) available in the HEASARC archive over the entire RXTE mission. We collected all available Swift/XRT data (including WT and PC mode pointed observations) between May 2005 and April 2017 using the Swift/XRT online product builder666http://www.swift.ac.uk/user_objects/index.php(Evans et al., 2009).
All light curves were collected in the 2–10 keV band. Individual instrument count rates were converted into flux using Crabs as a baseline unit and calculating approximate count rate equivalences. See Tetarenko et al. (2016) for details on this method.
3.2 UVOIR
For constructing and fitting the SEDs, the UVOIR photometry described in the following sections is corrected for interstellar extinction according to Fitzpatrick & Massa (1999). To deredden the data we use the specutils package in python, and (Froning et al., 2014).
3.2.1 Swift/UVOT
Swift/UVOT is a 30cm diameter telescope which operates simultaneously with the XRT. When possible, we obtained observations in each of the six filters available for UVOT, from the UV () to optical (). As a result, we have 17 UVOT observations simultaneous with the XRT exposures described in Section 3.1.1.
Aperture photometry was performed on the images with the heasoft tool uvotsource, using a radius circular region centered on the source. The background was measured using a radius circular aperture centred on a source free region. All reported magnitudes are in the Vega system and have been converted into flux densities using the known flux zero-points for each filter. Uncertainties include the statistical error and a systematic uncertainty that accounts for the uncertainty in the shape of the UVOT point spread function (PSF).
3.2.2 SMARTS
Upon the discovery of the first mini-outburst, we commenced optical and NIR monitoring of J1753 with A Novel Dual Imaging CAMera (ANDICAM; DePoy et al., 2003) on the 1.3m Small & Moderate Aperture Research Telescope System (SMARTS; Subasavage et al., 2010) at Cerro Tololo, Chile. An observing sequence consisted of observations in and bands777The -band images were of poor quality due to the rapidly changing sky background at longer wavelengths, so we choose not to include them in this work. with exposure times of 360 s in the optical filters and 30 s in each of 8 to 10 dithered images in the NIR filters. Images were reduced using the Image Reduction and Analysis Facility (IRAF; Tody, 1986, 1993), following the standard procedures described by Buxton et al. (2012). Point-spread function photometry was performed on all images. The magnitudes were calibrated to the Vega system with respect to nearby stars in the field, with absolute calibration performed on clear nights using Landolt (1992) standards and the 2 Micron All-Sky Survey (2MASS) catalogue (Skrutskie et al., 2006) in the optical and NIR, respectively.
3.3 2014 observations
We also utilise multi-wavelength data from 2014 Apr 2 – 5 observations of J1753, taken with an array of instruments. In UVOIR, we utilise observations performed in all six Swift/UVOT filters, in the and bands using the Lulin 41cm Super-Light Telescope (SLT), located in Taiwan and in the and bands using the HONIR instrument on the 1.5m Kanata telescope at the Higashi-Hiroshima Observatory, Japan. We also utilise a single 2.4ks Swift/XRT observation performed on 2014 Apr 5 (ObsID 00080730001). The data reduction of all of the 2014 data is described by Tomsick et al. (2015).
3.4 The Bolometric Correction
To convert the 2–10 keV unabsorbed flux from Swift/XRT and RXTE/PCA, to a bolometric flux, we use a combination of the (i) bolometric corrections estimated for each accretion state by Migliari & Fender (2006), (ii) WATCHDOG project’s online Accretion-State-By-Day tool888http://astro.physics.ualberta.ca/WATCHDOG, which provides accretion state information on daily timescales during outbursts of BH-LMXBs, and (iii) Shaw et al. (2016a), who quantify J1753’s brief excursion to the soft state in 2015.
We note that using this method assumes that the bolometric conversion factor remains constant when the source is in each individual accretion state. This may not always be the case. Specifically for J1753, the high-energy cutoff in the X-ray spectrum has been observed to vary between keV throughout its 12 years of activity, where it mostly remained in a hard accretion state (see e.g., Cadolle Bel et al. 2007; Kajava et al. 2016). Without any continuous X-ray monitoring at 100 keV we have no way of quantifying whether (or how) this correction may change throughout the main outburst, standstill period, or mini-outbursts. Thus, we assume that the bolometric correction remains constant and acknowledge that if this is not the case, some uncertainty will be introduced into our calculation of bolometric flux.
4 Results
4.1 X-ray Spectral Fitting
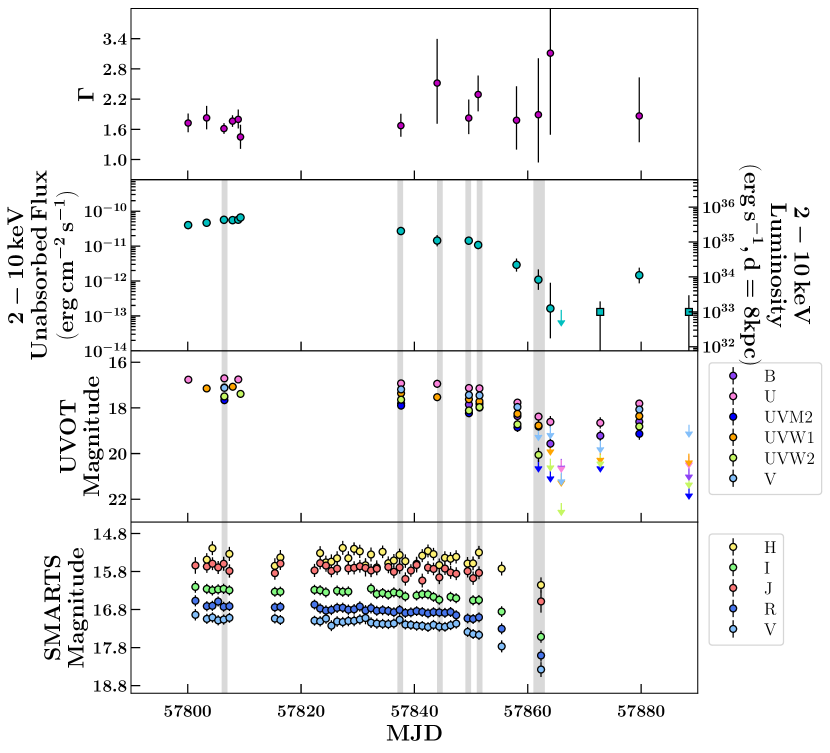
All X-ray spectra are adequately fit with an absorbed power-law model (tbabs*powerlaw in xspec syntax), with no model fit improved by the addition of a diskbb model. The best-fit power-law indices () and unabsorbed 2–10 keV fluxes at each Swift epoch are plotted in Fig. 1. For the duration of the two mini-outbursts shown in Fig. 1, remains roughly constant at , a value consistent with that typically expected of an LMXB in a hard accretion state. However, whilst remains roughly constant, the flux does not, first rising and then decaying as the first mini-outburst progresses. We also note the onset of the second mini-outburst at MJD , which was investigated by Plotkin et al. (2017).
| Epoch | Date | Function | b | c | d | |||||
|---|---|---|---|---|---|---|---|---|---|---|
| (MJD) | Type | (keV) | ( K) | () | () | |||||
| Standard Irradiated Disc () | ||||||||||
| 1 | 57806-57807 | disc+pl | ||||||||
| 2 | 57837-57838 | disc+pl | ||||||||
| 3 | 57844 | disc | ||||||||
| 4 | 57849 | disc | ||||||||
| 5 | 57851 | disc+pl | ||||||||
| 6 | 57861-57862 | disc+pl | ||||||||
| * | 56752 | disc | ||||||||
| Fully Irradiated Disc () | ||||||||||
| 1 | 57806-57807 | disc+pl | ||||||||
| 2 | 57837-57838 | disc+pl | ||||||||
| 3 | 57844 | disc | ||||||||
| 4 | 57849 | disc | ||||||||
| 5 | 57851 | disc+pl | ||||||||
| 6 | 57861-57862 | disc+pl | ||||||||
| * | 56752 | disc | ||||||||
| Non-Irradiated Disc () | ||||||||||
| 1 | 57806-57807 | disc+pl | ||||||||
| 2 | 57837-57838 | disc+pl | ||||||||
| 3 | 57844 | disc | ||||||||
| 4 | 57849 | disc | ||||||||
| 5 | 57851 | disc+pl | ||||||||
| 6 | 57861-57862 | disc+pl | ||||||||
| * | 56752 | disc | ||||||||
| a . | ||||||||||
| bThe disc normalization : (), (), and (). | ||||||||||
| cThe PL normalization : ( and ) and (). Upper limits on are found using the disc flux in the H-band and assuming the of the closest available observation. | ||||||||||
| dCalculated for an assumed distance of kpc and inclination . | ||||||||||
| ∗Best fit to data taken during the main outburst (Tomsick et al., 2015). See Sections 3.3 and 5 for details. | ||||||||||
4.2 UVOIR SED Fitting
We fit the UVOIR SEDs from six individual epochs during the J1753 mini-outburst (see Fig. 1 and Table 1) with the disc+power-law model described in Section 2.1. Each epoch has strictly simultaneous or quasi-simultaneous (within 1 day) UV through IR data from Swift/UVOT and SMARTS (see Sections 3.2.1 and 3.2.2).
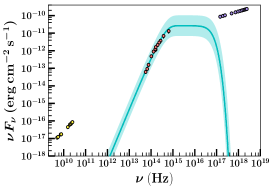
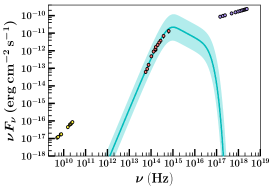
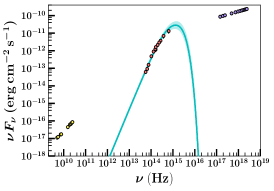
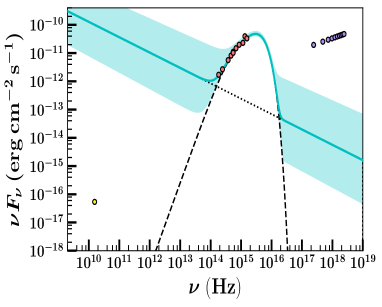
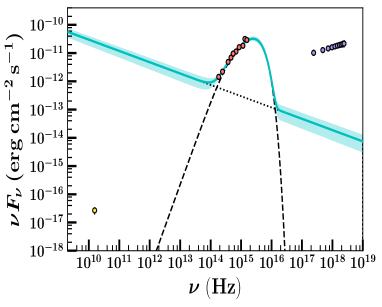
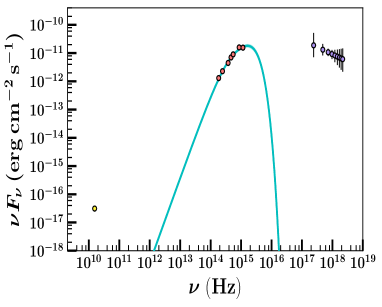
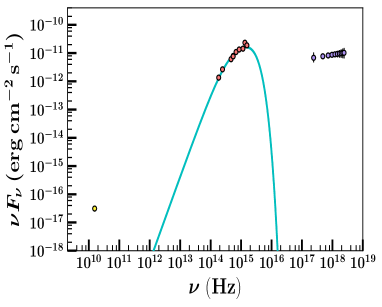
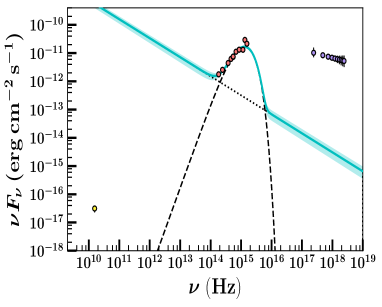
All broadband SEDs during each of our six epochs are presented in Fig. 9. Each SED has been plotted in frequency space with the (dereddened) data colour-coded by wavelength: UVOIR (UVOT and SMARTS; red), X-ray (XRT: keV; purple), and Radio (VLA: 9.8 GHz and AMI: 15.5 GHz from Plotkin et al. 2017; yellow). Note that only the UVOIR data are fit with our MCMC algorithm. X-ray and radio data show the multi-wavelength behaviour of the source999To derive the X-ray fluxes plotted in Fig. 9, we fit the X-ray data with the pegpwrlw model, where the model normalization is the flux density in at a specified energy. We derive this normalization at discrete energies in the range 1–10 keV and plot them in Fig. 9.. All X-ray and radio data plotted are either simultaneous or quasi-simultaneous (within 1 day) with the UVOIR data, with the exception of Epoch 1, in which the closest available radio data were taken three days prior to the UVOIR data. Epochs 1,2,5, and 6 required the addition of a power-law component (indicative of the presence of emission from a jet) to the disc component to sufficiently match the UVOIR behaviour, while Epochs 3 and 4 were well fit with a pure disc model.
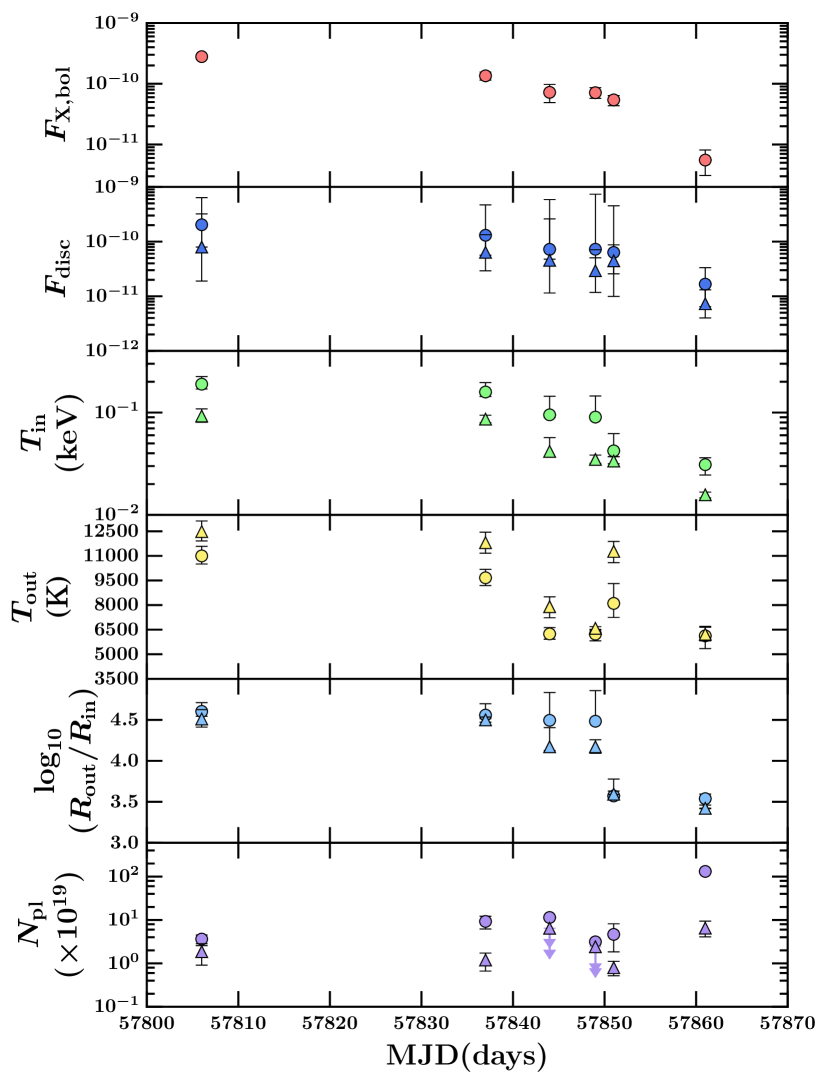
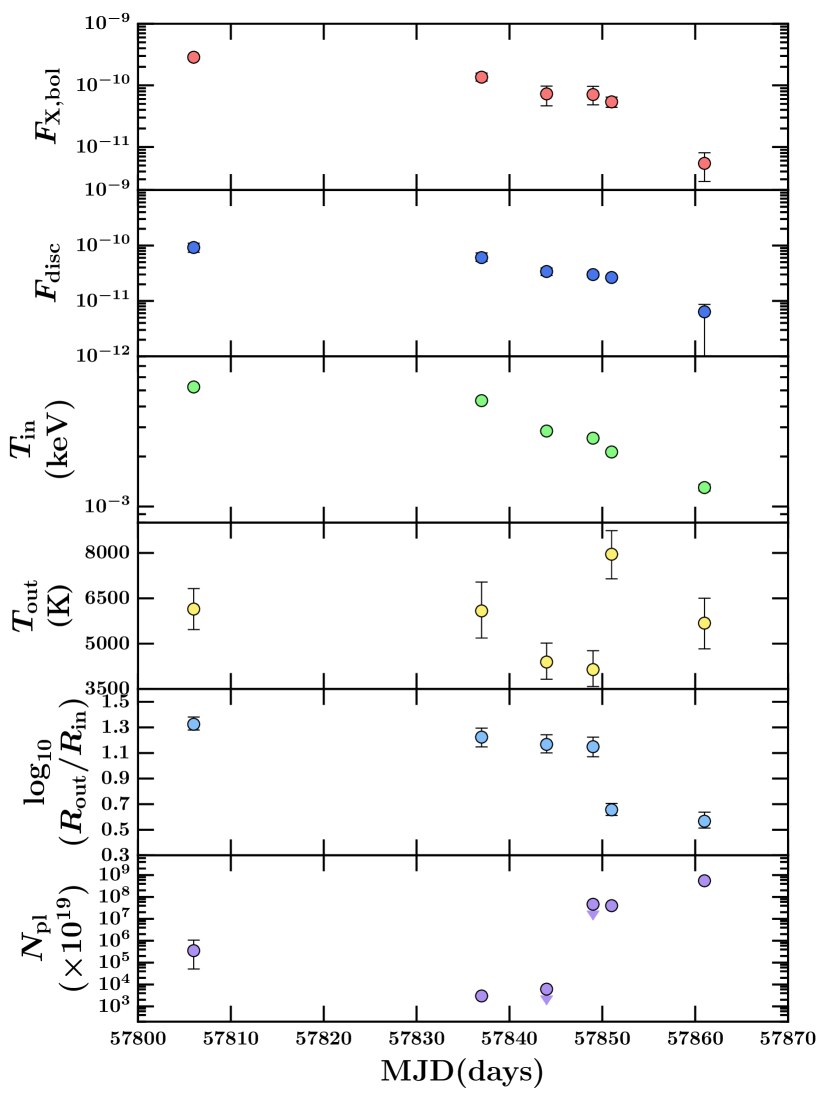
From our SED fitting, we are able to derive the time-series evolution of , , and over the course of the mini-outburst, for the irradiated disc model with two different temperature distributions (Fig. 2), and the non-irradiated disc model (Fig. 3). We note the resulting posterior distributions of each parameter, in all epochs, are close to Gaussian in shape. We find our six SEDs are well fit with an inner disc temperature that varies between keV and keV, for the irradiated and models, respectively. This is consistent with the range of keV, found in previous X-ray spectral studies during the main (12 yr long) outburst of J1753, when the source was in the hard spectral state (Miller et al., 2006; Hiemstra et al., 2009; Chiang et al., 2010; Reynolds et al., 2010; Cassatella et al., 2012; Kolehmainen et al., 2014; Tomsick et al., 2015). However, we note that the is not well constrained by our data in the irradiated models (see Section 5.3). For the non-irradiated () case, we find the six SEDs are fit with an inner disc temperature that varies between keV ( K), significantly smaller than the irradiated cases.
For the irradiated cases, our SED fits show the temperature in the outer disc decreases from K and K for the and models, respectively, as the source evolves from outburst maximum towards quiescence, with the exception of Epoch 5. Interestingly, we observe an increase in during Epoch 5 for both irradiated disc models, the same epoch that shows the largest excess emission in the UV bands. The decrease in as the X-ray flux decreases during outburst decay is consistent with the predictions of the DIM+irradiation (Dubus et al., 1999, 2001).
4.3 The X-ray Lightcurve
The X-ray light curves of recurring transient outbursts in LMXBs can be used as a powerful diagnostic to probe the physical mechanisms driving mass inflow/outflow in these systems (Tetarenko et al., 2018b). To this end, we have applied the Bayesian methodology developed by Tetarenko et al. (2018b) to the X-ray light curve of the J1753 mini-outburst, fitting their analytical irradiated disc-instability model to our data (see Fig. 4). The DIM+irradiation predicts a multi-stage decay profile, starting with an exponential-shaped portion attributed to a viscously-accreting fully-irradiated disc, followed by a linear-shaped portion, occuring as a result of a cooling front propagating inward through the disc, at a rate set by the amount of irradiation heating (see King & Ritter 1998; Dubus et al. 2001).
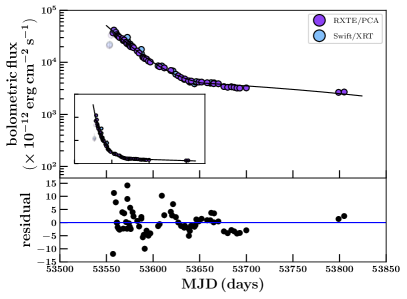
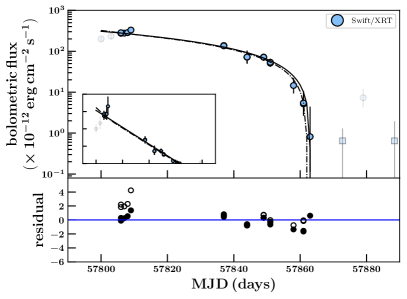
We find that the J1753 mini-outburst can be well fit by a pure linear-shaped decay on a timescale of days, and does not require the exponential+linear decay profile as in many Galactic BH-LMXB outbursts (Tetarenko et al., 2018a). A pure linear profile allows us to calculate an upper limit on by assuming , the flux level at which the transition occurs between the viscous (exponential-shaped) and irradiation-controlled (linear-shaped) decay stages in the light curve, is the maximum observed flux (Tetarenko et al., 2018a). We find (for an assumed kpc).
Since an exponential decay stage could have occurred in the gap in our data around MJD , we also tested an exponential+linear decay profile. The best fit gives an exponential (viscous) timescale of days, a linear decay timescale of days, and a transition (between exponential and linear stages) occurring at time and flux level . This exponential+linear profile allows us to calculate a from , the flux level at which the transition occurs between the viscous (exponential) and irradiation-controlled (linear) decay stages in the light curve, of (for an assumed kpc).
| Wave | Central | ||
|---|---|---|---|
| Band | () | ||
| 0.1928 | |||
| 0.2246 | |||
| 0.2600 | |||
| 0.3465 | |||
| 0.4392 | |||
| 0.5468 | |||
| 0.641 | |||
| 0.798 | |||
| 1.22 | |||
| 1.63 | |||
| NOTE. – A linear fit was performed in log-space, where and are the slope and intercept, respectively. | |||
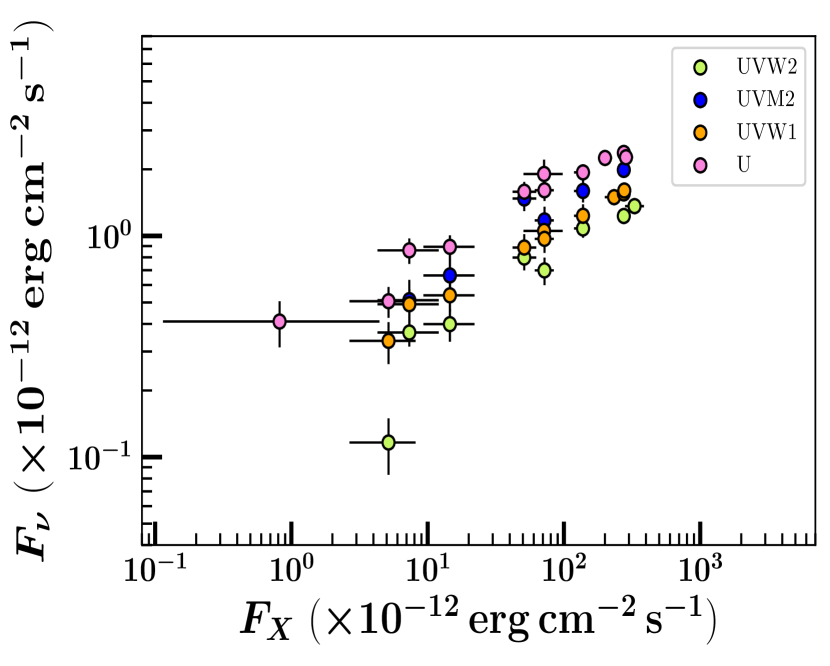
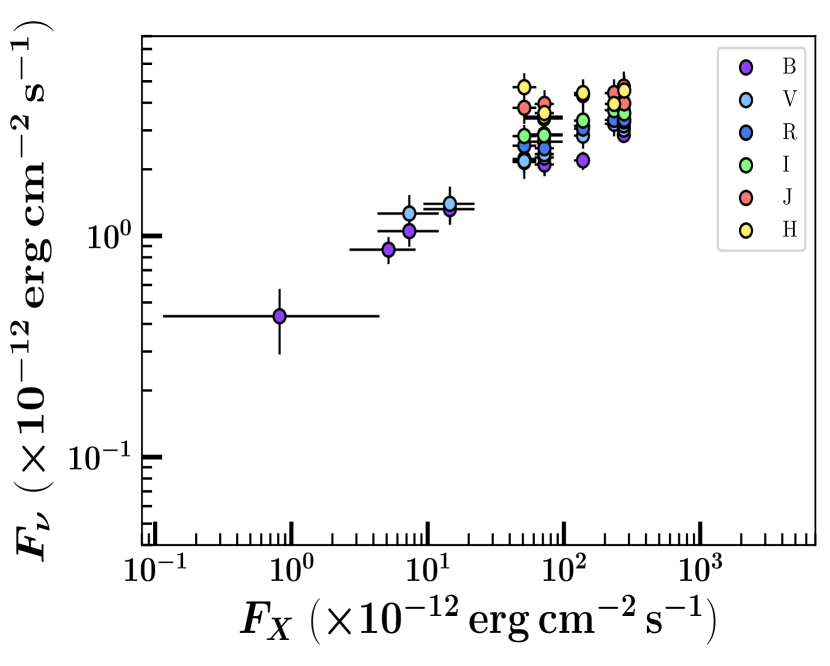
4.4 UVOIR–X-ray Correlations
In addition to light curves and spectra, another way to quantify the contributions of different emission processes during an LMXB outburst is through the power-law correlations that exist between the flux at UVOIR wavelengths and the X-ray flux (Russell et al. 2006 and references therein). In Figs. 5 and 6, we plot and versus for all simultaneous UV through X-ray data taken during the J1753 mini-outburst. We fit the correlations between the 10 individual UVOIR bands during the mini-outburst and the keV X-ray flux (see Table 2) to determine the dominant emission processes in each waveband.
We performed a linear fit in log-space to each dataset with our Bayesian MCMC algorithm (see Section 2.2), and estimated the slope () and intercept () for each individual correlation. As the standard linear formulation (i.e., ) is ill-suited for problems involving two-dimensional uncertainties, we use an alternative method, which parametrizes the slope in terms of the parameter , defined as the angle that the linear function makes with the x-axis (Hog et al., 2010). After likelihood maximization is performed for and the y-intercept , PDFs of and are obtained by taking the tangent of the resulting PDFs for and .
We find that as the selected wavelength decreases, the slope of the correlation, , increases. This trend has been found in outbursts of other short-period LMXBs containing both BHs and neutron stars (e.g., Swift J1357.2-0933, SAX J1808.4-3658; Armas Padilla et al. 2013; Beri, A. et al. 2018, submitted; Patruno et al. 2016). This trend is expected for thermal emission.
5 Discussion - The Nature of the Long-term Behaviour in J1753
The standard DIM+irradiation model cannot adequately describe the abnormal behaviour, characterized by outbursts of varying amplitude and duration, observed in the short-period BH-LMXB J1753. The division between transient and persistently accreting sources, predicted to occur by the DIM+irradiation in the plane, is based on whether an accretion disc is in the stable or unstable regime (Dubus et al., 1999). An annulus within the disc can remain in the hot, stable state if the local accretion rate is greater than the critical accretion rate of the hot state , which increases with radius. Thus, for the entire disc to remain in a stable hot equilibrium (i.e., present as a persistent source), the mass-transfer rate from the companion star () must be larger than the critical mass-transfer rate in the outer disc, . If , the disc will be in an unstable regime, undergo outbursts, and thus, be transient.
The critical accretion rate for an irradiated disc is parameterized as
| (5) |
(Lasota et al., 2008) where is the compact object mass in , is the disc radius in units of cm, is the -viscosity (a term parametrizing the efficiency of angular-momentum transport in the disc; Shakura & Sunyaev 1973), and is the irradiation constant (a parameter used to describe the fraction of the central X-ray luminosity that is intercepted and reprocessed by the disc; Dubus et al. 1999, 2001).
In Fig. 7, we plot the long-term mass-transfer rate () as a function of for the Galactic BH-LMXB source sample, computed in the time-period 1996 January 6 – 2015 May 14, from the WATCHDOG project (Tetarenko et al., 2016). Overlaid on the plane, we plot the (i) critical accretion rate for an irradiated disc, parametrized with four different choices of , around a BH, and (ii) the average mass-transfer rate of J1753 during each of the three accretion regimes it traversed between May 2005 and April 2017 (dotted horizontal lines); see below for details).
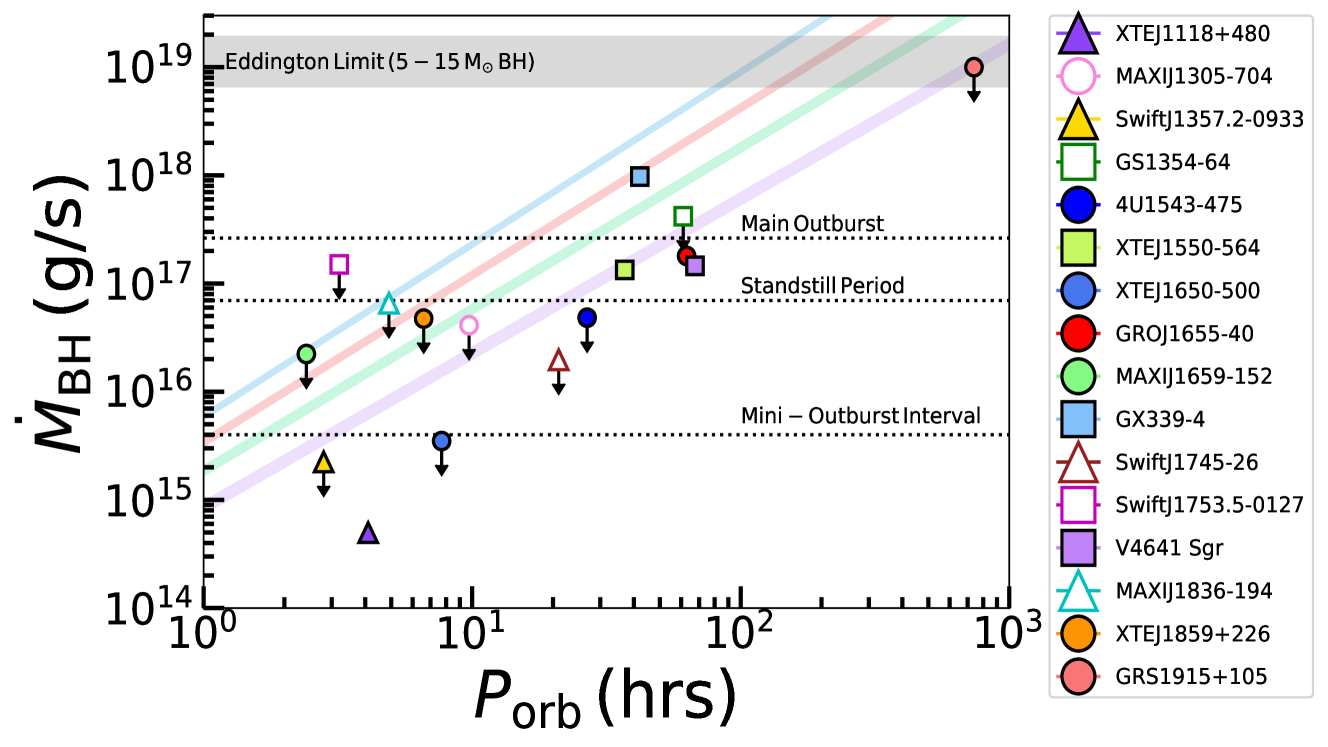
The of J1753, averaged over a year period, places it in the stable (persistent) region of the diagram. The nature of J1753’s position in the plot has been discussed by multiple authors (see e.g., Coriat et al. 2012; Tetarenko et al. 2016). As suggested by Coriat et al. (2012), for such a small disc ( hrs or cm) one of the most feasible ways to explain how J1753 stayed bright for so long, and in turn the sheer amount of material accreted during such an outburst is via a variable . An increase in from its average value can keep the disc in a hot, stable state. We note that, there have been alternative explanations put forth to explain J1753, using the addition of tidal effects to the DIM (the tidal instability; Zurita et al. 2008; Maccarone & Patruno 2013), similar to what has been used to explain SU UMa stars (Osaki & Kato, 2013). However, we do not focus on them in this paper.
This behaviour is reminiscent of what is observed in Z Cam stars (Simonsen, 2011; Szkody et al., 2013)101010Neutron star LMXBs have also been shown to exhibit Z Cam type behaviour. See Haswell & King 2001.. A subclass of dwarf novae, Z Cam stars are characterized by what is referred to as the “standstill” phenomenon (see e.g., Buat-Ménard et al. 2001). In these systems, the decay from outburst maximum to quiescence is interrupted. Following the interruption, the luminosity of the system increases and then settles at an intermediate level, corresponding to some fraction of the original peak outburst luminosity.
This standstill, which can last anywhere from days to years at a time, ends when the system finally declines to the typical quiescent state once again. In the framework of the DIM, the standstill behaviour was originally interpreted as a stable phase of accretion (Osaki, 1974), as a result of a mass-transfer rate from the companion star that fluctuates (either intrinsically or due to irradiation) about the critical mass-transfer rate, above which the disc is stable (Meyer & Meyer-Hofmeister, 1983; Lin et al., 1985). This conclusion was supported by various authors (see Buat-Ménard et al. 2001; Hameury & Lasota 2014), who were able to successfully model and reproduce the observed light curves of Z Cam systems by including a variable mass-transfer rate in their numerical DIM codes.
We test the hypothesis that J1753 is the BH-LMXB analog to Z Cam systems using the (i) available long-term X-ray light curves from RXTE/PCA and Swift/XRT. (see Fig. 4 and Section 3.1.2) and (ii) (quasi) simultaneous UVOIR and X-ray data from discrete intervals, during the time period of May 2005 to April 2017. To do so, we split the 12 years of outburst activity into three accretion regimes: the main outburst (A), standstill period (B), and mini-outburst interval (C).
5.1 Regime A: The Main Outburst
Regime A can be attributed to a typical transient outburst, predicted by the irradiated DIM, in which the accumulation of matter in the disc triggers the thermal-viscous instability and subsequent cycling of the disc into a hot, ionised outburst state over a viscous timescale.
5.1.1 X-ray Light Curve Fitting
As the disc dissipates through viscous accretion of matter at this point, we expect to see an exponential-shaped decay profile in the X-ray light curve. As described in Section 4.3 for the mini-outbursts, we model the observed bolometric X-ray light curve of the main outburst using the analytical version of the DIM+irradiation (Dubus et al., 2001) built by Tetarenko et al. (2018b). The light curve (Fig. 4) is well fit with an exponential+linear shaped decay profile.The exponential timescale is days111111Using the methodology developed by Tetarenko et al. 2018b and this viscous timescale, we find the light curve profile corresponds to an -viscosity parameter of . Interestingly, this is consistent with the inferred in dwarf novae (Kotko & Lasota, 2012)., and the estimated mass-transfer rate from the companion is g/s, significantly higher than the critical mass-transfer rate in the outer disc of J1753, g/s (calculated for a standard ).
The standard DIM+irradiation interpretation (Dubus et al., 2001) attributes the linear-shaped (irradiation-controlled) portion of the decay profile to a cooling front propagating inward through the disc, where the speed at which this front propagates is controlled by the decaying X-ray irradiating flux. In this interpretation, the transition from the exponential (viscous) to the linear (irradiation-controlled) stage of the decay occurs when the irradiation temperature at the outer radius drops below K, the temperature at which hydrogen starts to recombine. Tetarenko et al. (2018b) find the flux level of this transition in short-period ( hr) BH-LMXB systems to vary between . From our light curve modelling, we find (i) this transition to occur at time and flux level , and (ii) a linear decay timescale of days.
Here, we postulate a scenario, similar to what is described in Hameury & Lasota (2014) for Z Cam stars, whereby the decreases, allowing to drop below K, triggering the development of an inward propagating cooling front in the outer disc. If remained low, and the inward movement of the cooling front (and thus observed X-ray decline) was purely controlled by the decaying X-ray irradiating flux, we would expect the source to drop into quiescence at . However, J1753 did not follow this predicted pattern.
5.2 Regime B: The Standstill Period
After several months spent in a linear decay stage (at near constant flux level), the flux began gradually increasing, until MJD, where a sudden increase in flux was observed (see Soleri et al. 2013; Shaw et al. 2013 for details). J1753 then spent years at an intermediate flux level, before dropping into quiescence at MJD (Shaw et al., 2016d). We connect this standstill period, regime B, to the standstill phenomenon observed in Z Cam stars (see Hameury & Lasota 2014). We postulate that, at some point, increased, before the cooling front had a chance to reach the inner edge of the disc. At this point, an outburst beginning in the outer disc (an “outside-in” outburst) began, as a result of the enhanced mass transfer, before the disc had a chance to reach quiescence.
5.2.1 Quantifying Mass Transfer
To determine if this scenario is plausible, we have first computed an average mass-transfer rate during the standstill period (which we approximate as ). Using the algorithm presented in Tetarenko et al. (2016), we estimate an average mass-transfer rate by computing the time-averaged bolometric luminosity using the X-ray light curve data for this time period available from RXTE/PCA and Swift/XRT (see Fig. 4 and Section 3.1.2 for details), assuming kpc and a fixed accretion efficiency . We find g/s, which is greater than in the outer disc, supporting the standstill phenomenon scenario.
5.2.2 UVOIR SED Fitting
In addition, we have also fit the UVOIR SED, made up of simultaneous data obtained during one epoch of this standstill period (April 2014; Tomsick et al. 2015), with our disc models. See Table 1 for best-fit results and Fig. 8.
Overall, we find that the 2014 SED is consistent with a cool disc, as reported by Tomsick et al. (2015), with no evidence of a jet in the NIR. Despite the much higher bolometric flux in comparison to the mini-outburst period, , in the irradiated cases, is consistent with values during the decay of the first mini-outburst (see Section 5.3 below). In addition, we find a similar pattern for and in the 2014 observations, compared to the mini-outbursts, in both irradiated cases.
From the SED fit, we also derive an integrated disc flux of and for the irradiated and models, respectively. Combining knowledge of with the simultaneous X-ray data allows for an estimate of the irradiation constant , defined as the fraction of the X-ray luminosity intercepted and reprocessed by the disc. We find and for the and models, respectively. Both estimates are significantly larger121212It is worth noting that a large fraction of intercepted X-rays () has been found to be consistent with observations in multiple other BH-LMXBs as well (e.g. Gandhi et al., 2010; Tetarenko et al., 2018a). than the standard value typically assumed in LMXBs (; Dubus et al. 2001), suggesting it is possible that strong X-ray irradiation of the companion star could be the cause of this period of enhanced in the system.
The changes in observed spectral properties of J1753, from the main outburst regime through the standstill phase, are also consistent with the scenario implied by our UVOIR SED fitting, whereby the disc truncates and recedes from the BH as the outburst evolves. Kajava et al. (2016) find that the evolution of spectral changes, observed in J1753 from the main outburst through the standstill phase, are consistent with being driven by the truncation of the disc and subsequent formation of a large hot inner corona inside it, causing the dominant source of X-ray emission (i.e., seed photons for Comptonization) to switch from the disc (via up-scattering) to self-produced synchrotron emission (via syncrotron self-Compton) in the hot corona.
Finally, we note that the 2014 data can also be fit well with a non-irradiated disc model. In this case, the scenario would be a thin viscous disc, truncated at a high inner radius, with presumably a hot radiatively inefficient flow inside producing the hard X-ray emission. However, from the SED fit with the model, the derived integrated disc flux of , corresponds to a mass-accretion rate g/s (for an assumed kpc and an inclination degrees), far too large to be consistent with the truncated thin disc scenario. Thus, we consider the non-irradiated disc model to be unphysical.
5.3 Regime C: The Mini-Outburst Interval
Finally, after a standstill period, J1753 returned to a quiescent state on 2016 November 6 (57698). However, it would not remain in quiescence for long. days later (), J1753 was observed to undergo two low-luminosity mini-outbursts before returning to a quiescent state for the second time. We attribute the mini-outburst interval, regime C, to remaining low enough (i.e., below ), putting the disc in the instability zone, and allowing for a series of transient outbursts to occur.
5.3.1 Quantifying Mass Transfer
To determine if this scenario is plausible, we have first computed an average mass-transfer rate (with the same method described in Section 5.2 above), during the period ranging from when J1753 first returned to a quiescent state () until the end of the two mini-outbursts (). We find g/s, which lies below in the outer disc of J1753, with the upper error bar on par with .
5.3.2 X-ray Light Curve Fitting
As described in Section 4.3, we model the observed bolometric X-ray light curve of the first-mini-outburst using the analytical version of the DIM+irradiation built by Tetarenko et al. (2018b). As there is a gap in the data between MJD , during which time an exponential (viscous) decay may have taken place prior to the linear decay, we attempt to fit the data (see Fig. 4) with both a pure linear-shaped decay profile and an exponential+linear shaped decay profile.
In the context of the DIM+irradiation, if the decay is truly only linear, this would imply that the heating front never reached the outer disc. In the standard DIM, an “inside-out” heating front can stall somewhat easily (Dubus et al., 2001), leading to short, low-amplitude outbursts that take place in the innermost regions of the disc. This is because the critical density needed to raise a ring of accreting matter to the hot, ionized state increases with radius. So, if the outward moving heating front is unable to raise the density above this critical value, the outburst stalls and a cooling front will develop. In the DIM+irradiation, irradiation heating will reduce the critical density, allowing the heating front to reach larger radii. However, this assumes that the irradiating flux is seen by the entire disc, i.e. there is no self-screening of the central X-ray source by the inner disc (Dubus et al., 2001).
This assumption is unlikely to be true in J1753. The estimates of (pure linear decay) and (exponential+linear decay), from the X-ray light curves fitting, are a factor higher than the standard value of , yet still compatible with the stability limits between transient and persistent LMXBs (Coriat et al., 2012). If the irradiation source in J1753 is large, causing X-rays to encroach on the disc vertically (e.g. via a hot, inner corona flow), this could result in an intercepted fraction that is high. This, combined with the low peak flux and short duration of the mini-outburst, leads us to favour the exponential+linear shaped decay in the X-ray light curve, which supports the scenario, implied by the UVOIR SED behaviour (see Section 5.3.3 below), of a fully-irradiated, truncated disc, heated by a source of irradiating X-rays produced in a corona above the disc.
5.3.3 UVOIR SED Fitting
We have also fit the UVOIR SEDs, made up of simultaneous/quasi-simultaneous data obtained during six individual epochs of the first mini-outburst. See Fig. 9 and Table 1. Figs 2 and 3 show the evolution of in the outer disc throughout the course of the mini-outburst for the irradiated and non-irradiated cases, respectively.
In the irradiated cases, our UVOIR SED fits imply that, overall, the outer disc cools as the source heads toward quiescence (prior to the second mini-outburst). According to the predictions of the DIM+irradiation, when K, the temperature at which hydrogen ionizes, a cooling front propagates through the disc, resulting in the source flux declining towards quiescence. This behaviour is echoed in Fig. 2. In conjunction with this cooling, we also note an upward trend in (and by extension ; Table 1), indicating that the inner disc recedes from the BH as the mini-outburst progresses. The simultaneous decrease of is consistent with this recession, indicating that the inner edge of the disc cools as it moves further away from the BH.
Interestingly, we observe a strong increase in in the last two epochs, indicating that there must also be a strong increase in (see Table 1). Working under the assumption that doesn’t change much over the mini-outburst, this observation is compatible with the decrease observed in , and suggests that increased by a factor 4-8 (depending upon the choice of , see Table 1) in days. This large change seems to coincide with the drop in optical magnitude prior to the second mini outburst (see Fig. 1).
Although the overall trend is one of a cooling disc as J1753 heads toward quiescence, in epoch 5 there is an apparent increase in with respect to epoch 4. In epoch 6, returns to a level consistent with epoch 4, as the cooling continues. Interestingly, the SED of J1753 at epoch 5 (Fig. 9) shows evidence of a significant excess (with respect to the best-fit model) in the UV bands. In various dwarf novae, a similar UV excess is observed (see e.g., Smak 1999, 2000; Hameury et al. 2000). This excess is attributed to brightening of the hot spot, where the mass transfer stream interacts with the outer disc, as a result of mass transfer variations from the companion. This is unlikely to be the case in J1753, as the irradiated disc would likely dominate over hot spot emission in the UV bands.
From the SED fits, we derive an integrated irradiated disc flux of in all epochs, implying an unphysical . While this suggests that the data are not consistent with an irradiated disc, it is more likely that we are just overestimating , as we discuss below.
In the irradiated disc fits, the parameter is not well constrained. The break between the flat power law and the Wien exponential cutoff in the spectrum is set by . Looking at the fitted irradiated disc SEDs (see Fig. 9), it is clear that a disc truncated at a larger , which would effectively change the higher end of the spectrum without changing the lower end, could also fit the data. A smaller parameter (and thus a disc truncated at a larger ) would lead to a lower . The (i) X-ray spectrum throughout the mini-outburst, fit well with a power law and no viscous disc-blackbody needed, and (ii) the large parameter estimated from the X-ray light curve fitting, implying an irradiation source in a hot, inner corona flow, both support this truncated irradiated disc scenario.
The other possibility to explain the large estimates is that only a part of the disc was hot during the mini-outbursts. The SED model explicitly assumes that is measured at the outer radius of the full disc, . If the heating front never reached the outer edge of the disc during the mini-outburst, the temperature we measure would refer to the maximum radius of the hot disc , and the true value of would be smaller. However, we note that this scenario is at odds with the large we estimate from the light curves.
Similar to the 2014 data, we note that the mini-outburst can also be fit well with a non-irradiated disc model. However, the derived integrated disc fluxes in all epochs correspond to mass-accretion rates g/s (for an assumed kpc and an inclination degrees). As discussed in 5.2.2 regarding the 2014 data, these mass-accretion rates are far too large to be consistent with the truncated thin disc scenario. Thus, we consider the non-irradiated disc model to not be a viable option to describe the mini-outburst data.
5.3.4 UVOIR–X-ray correlation
In a study of 33 LMXBs, Russell et al. (2006) found a global correlation with a slope for for BH-LMXBs in a hard accretion state. This correlation, which extends to the UV regime (e.g. Rykoff et al., 2007), is instrumental in our understanding of the emission processes in the accretion disc. The value of can vary significantly, depending on the dominant emission mechanism. van Paradijs & McClintock (1994) find that is expected for emission dominated by X-ray reprocessing in the disc, whereas implies the presence of an optically thick synchrotron jet (Russell et al., 2006). For a viscously heated disc, we expect in the range in the NIR to UV bands (Russell et al., 2006).
Figs. 5 and 6 show the UVOIR fluxes plotted against their corresponding X-ray flux (in the 2–10 keV band) during the first mini-outburst. The results of a linear fit (in log-space) to the data in each UVOIR band are presented in Table 2. As discussed in Section 4.4 we find a decreasing slope as we move to redder filters. A dependency of on wavelength is predicted by theory (Frank et al., 2002), and has been observed in the short period BH-LMXB Swift J1357.2-0933 (Armas Padilla et al., 2013). However, unlike Swift J1357.2-0933, in which the slope was consistent with a viscous disc in all Swift/UVOT filters, we see an apparent switch from a viscous disc to reprocessed emission in the band.
The fact that we see from the UVOIR-X-ray correlations, that only the flux is consistent with reprocessing, could suggest that the entire disc is not being irradiated and thus, there is a screening process preventing the irradiating flux from reaching the outer radii of the disc. In this case, irradiation alone would not bring the entire disc into a hot, ionized state. As a result, the heating front would never reach the outer edge of the disc during the mini-outburst, resulting in an outburst from only a portion of the disc.
However, this scenario is inconsistent with the large estimates from the X-ray light curve fits, which imply a large source of X-ray irradiation (possibly via the hot, inner corona flow). We also note that the best-fit value for in the band appears to be driven by one data point at a low flux, highlighted by the relatively large uncertainties compared to those in the other filters. If the low-flux point is removed, then the -X-ray correlation would be consistent with the viscous disc scenario implied by other filters. We therefore are cautious to interpret the emission as being a result of X-ray reprocessing alone.
The likely reality is that there are a number of emission processes contributing to the optical and UV flux of J1753 during the mini-outburst. In addition to supporting the scenario where both the disc geometry and the source of X-ray emission change as J1753 evolves from the main outburst through the standstill phase, the evolution of the timing properties of the source have also been shown to be consistent with the existence of multiple sources of optical/UV emission. Recently, Veledina et al. (2017) attributed the dramatic changes in the shape of the optical/X-ray cross-correlation functions (CCFs), as J1753 evolved from the main outburst to the standstill phase, as the source of optical/UV emission switching from purely reprocessed X-ray photons in the outer regions of the disc (during the initial stages of the main outburst), to a combination of emission from the irradiated disc and synchrotron emission from the hot inner corona (following the drop in X-ray flux and the subsequent change in the source of seed photons producing the comptonized X-ray emission in the standstill phase).
The shallower (than expected for emission from a pure irradiated disc) optical/UV-X-ray correlations we observe during the mini-outburst are consistent with this scenario, whereby the optical/UV emission is a combination of X-ray reprocessing in the outer disc and a (likely significant) contribution of (optical/UV) synchrotron emission from the corona, effectively reducing the slope we observe and fit.
In the NIR and bands, the slope is consistent with 0, implying that there is no NIR response to the changing X-ray flux. We find that a jet component is required to describe the NIR emission in four of the six SEDs (Fig. 9), indicating that the jet may be contaminating the NIR-X-ray correlations. This is similar to the BH-LMXB XTE J1550-564, which underwent a mini-outburst in 2003 and exhibited evidence of a compact jet in the NIR portion of the SED (Chaty et al., 2011), and has also been seen in J1753 previously (Rahoui et al., 2015).
The spectral index of the PL component found to fit the NIR emission in our SEDs is steeper than typically seen in optically thin radio jets ( e.g. Russell et al., 2010) but not unphysical (see e.g., discussion in Tetarenko et al. 2017). We must note that the best-fit value of is only driven by one or two NIR data points, so is likely less constrained than the MCMC derived uncertainties suggest. Therefore we suggest that the contribution from the jet is likely contaminating the NIR-X-ray correlation.
6 Summary and Conclusions
We have presented here a comprehensive study of the BH-LMXB Swift J1753.5-0127, focusing in particular on multi-wavelength data obtained during a mini-outburst toward the end of its year long outburst. By modelling the observed UVOIR SED at six epochs during the mini-outburst with an irradiated accretion disc we were able to track the evolution of some important physical properties of the disc. Additionally, we modelled the profile of the X-ray light curve during the mini-outburst, enabling us to probe the mechanisms of mass transport in the disc as well as the X-ray irradiation properties. Finally, we utilised our wealth of (near-) simultaneous multi-wavelength data to investigate the correlation between the observed X-ray and UVOIR fluxes. These correlations allowed us to investigate the emission mechanisms present during the mini-outburst.
Ultimately, we conclude that the evolution of the mini-outburst is consistent with a scenario involving a fully irradiated disc, truncated at a large radius, with a hot, radiatively inefficient, accretion flow inside it, within which the source of irradiating X-rays (likely produced mainly by the synchrotron self-Compton process), and a significant portion of the optical/UV (via synchrotron photons) emission, are produced.
This scenario is supported by the observed (i) light curve profile, displaying the classic exponential+linear shape predicted by the DIM+irradiation (Dubus et al., 1999, 2001) for the outburst of an irradiated disc, (ii) high fraction of reprocessed X-rays () derived from the X-ray light curve, implying the presence of a large source of irradiating X-rays impinging on the disc, (iii) evolution of the UVOIR SEDs throughout the mini-outburst, consistent with a truncated irradiated disc cooling and receding further from the BH, and (iv) power-law correlations between optical/UV and X-ray emission, showing only the far-UV emission to be consistent with pure reprocessed X-ray irradiation and evidence for multiple sources of optical and (near and middle) UV emission present.
We have also presented an investigation of the long-term behaviour of J1753, which, prior to the mini-outbursts, had remained in outburst since its discovery in 2005 (see e.g. Soleri et al., 2013; Shaw et al., 2013; Tomsick et al., 2015). Fitting the X-ray light curve of the initial outburst, we find the classic BH-LMXB outburst and decay profile (i.e. an exponential followed by a linear decay). However, instead of returning to quiescence the source underwent a standstill phase. We attribute this to a variable mass-transfer rate from the companion star (see also Coriat et al., 2012), in which, during this phase, allowing the disc to remain in a hot, ionzied stable state.
From the long-term X-ray light curve (Fig. 4), we calculated the time-averaged to be greater than the critical value during the standstill phase, supporting our hypothesis. The UVOIR SED (obtained during this phase) is well fit with an irradiated disc truncated at large radii, and implies a large fraction of X-rays being reprocessed in the outer disc (), consistent with the source of irradiating X-rays being produced in a corona existing inside and above the disc. Previous spectral (e.g., Kajava et al. 2016) and timing (e.g., Veledina et al. 2017) studies during the standstill phase of this source have been found to also support this scenario. Given the available evidence, we suggest that a period of strong X-ray irradiation may have driven the enhanced mass transfer of the standstill phase.
The long-term behaviour observed in J1753 is reminiscent of Z Cam stars, whereby variable mass transfer from the companion drives unusual outbursts, characterized by stalled decays and abrupt changes in luminosity (Buat-Ménard et al., 2001; Hameury & Lasota, 2014). Thus, we suggest that J1753 is in fact a BH-LMXB analogue to Z Cam type dwarf novae.
Acknowledgements
We thank the anonymous referee for useful comments which helped to improve the manuscript. AWS and BET would like to thank P.A. Charles, C.O. Heinke, and G.R. Sivakoff, for useful discussions. AWS and BET are supported by NSERC Discovery Grants and AWS is also supported by a Discovery Accelerator Supplement. GD acknowledges support from the Centre National d’Études Spatiales (CNES). RMP acknowledges support from Curtin University through the Peter Curran Memorial Fellowship. This research has made use of data, software, and/or web tools obtained from the High Energy Astrophysics Science Archive Research Center (HEASARC), a service of the Astrophysics Science Division at NASA Goddard Space Flight Center (GSFC) and of the Smithsonian Astrophysical Observatory’s High Energy Astrophysics Division, and data supplied by the UK Swift Science Data Centre at the University of Leicester. This work has also made extensive use of NASA’s Astrophysics Data System (ADS).
References
- Al Qasim et al. (2016) Al Qasim A., AlMannaei A., Russell D. M., Lewis F., 2016, The Astronomer’s Telegram, 9739
- Al Qasim et al. (2017) Al Qasim A., AlMannaei A., Russell D. M., Lewis F., Zhang G., Gelfand J. D., 2017, The Astronomer’s Telegram, 10075
- Armas Padilla et al. (2013) Armas Padilla M., Degenaar N., Russell D. M., Wijnands R., 2013, MNRAS, 428, 3083
- Arnaud (1996) Arnaud K. A., 1996, in Jacoby G. H., Barnes J., eds, Astronomical Society of the Pacific Conference Series Vol. 101, Astronomical Data Analysis Software and Systems V. p. 17
- Barthelmy et al. (2005) Barthelmy S. D., et al., 2005, Space Sci. Rev., 120, 143
- Bernardini et al. (2017) Bernardini F., et al., 2017, The Astronomer’s Telegram, 10325
- Bright et al. (2017) Bright J., Staley T., Fender R., Motta S., Cantwell T., 2017, The Astronomer’s Telegram, 10110
- Buat-Ménard et al. (2001) Buat-Ménard V., Hameury J.-M., Lasota J.-P., 2001, A&A, 369, 925
- Burrows et al. (2005) Burrows D. N., et al., 2005, Space Sci. Rev., 120, 165
- Buxton et al. (2012) Buxton M. M., Bailyn C. D., Capelo H. L., Chatterjee R., Dinçer T., Kalemci E., Tomsick J. A., 2012, AJ, 143, 130
- Cadolle Bel et al. (2007) Cadolle Bel M., et al., 2007, ApJ, 659, 549
- Cannizzo (1993) Cannizzo J. K., 1993, in Wheeler J. C., ed., , Accretion Disks in Compact Stellar Systems. World Scientific Publishing Co, pp 6–40, doi:10.1142/9789814350976_0002
- Cannizzo et al. (1985) Cannizzo J. K., Wheeler J. C., Ghosh P., 1985, in Lamb D., Patterson J., eds, Proceedings of the Seventh North American Workshop Vol. 113, Cataclysmic variables and low-mass X-ray binaries. Dordrecht, D. Reidel Publishing, Cambridge, MA, pp 307–313
- Cash (1979) Cash W., 1979, ApJ, 228, 939
- Cassatella et al. (2012) Cassatella P., Uttley P., Maccarone T. J., 2012, MNRAS, 427, 2985
- Chaty et al. (2011) Chaty S., Dubus G., Raichoor A., 2011, A&A, 529, A3
- Chen et al. (1997) Chen W., Shrader C. R., Livio M., 1997, ApJ, 491, 312
- Chiang et al. (2010) Chiang C. Y., Done C., Still M., Godet O., 2010, MNRAS, 403, 1102
- Corbel & Fender (2002) Corbel S., Fender R. P., 2002, ApJL, 573, L35
- Coriat et al. (2012) Coriat M., Fender R. P., Dubus G., 2012, MNRAS, 424, 1991
- DePoy et al. (2003) DePoy D. L., et al., 2003, in Iye M., Moorwood A. F. M., eds, Proc. SPIEVol. 4841, Instrument Design and Performance for Optical/Infrared Ground-based Telescopes. pp 827–838, doi:10.1117/12.459907
- Dubus et al. (1999) Dubus G., Lasota J.-P., Hameury J.-M., Charles P., 1999, MNRAS, 303, 139
- Dubus et al. (2001) Dubus G., Hameury J.-M., Lasota J.-P., 2001, A&A, 373, 251
- Evans et al. (2009) Evans P. A., et al., 2009, Mon. Not. R. Astron. Soc., 397, 1177
- Fender (2001) Fender R. P., 2001, MNRAS, 322, 31
- Fitzpatrick & Massa (1999) Fitzpatrick E. L., Massa D., 1999, ApJ, 525, 1011
- Foreman-Mackey et al. (2013) Foreman-Mackey D., Hogg D. W., Lang D., Goodman J., 2013, Pub. Astron. Soc. Japan, 125, 306
- Frank et al. (2002) Frank F., King A., Raine D., 2002, Accretion Power in Astrophysics, 3 edn. Cambridge Univ. Press
- Froning et al. (2014) Froning C. S., Maccarone T. J., France K., Winter L., Robinson E. L., Hynes R. I., Lewis F., 2014, ApJ, 780, 48
- Gandhi et al. (2010) Gandhi P., et al., 2010, MNRAS, 407, 2166
- Gandhi et al. (2011) Gandhi P., et al., 2011, ApJ, 740, L13
- Gandhi et al. (2018) Gandhi P., Rao A., Johnson M. A. C., Paice J. A., Maccarone T. J., 2018, preprint, (arXiv:1804.11349)
- Geem et al. (2001) Geem Z., Kim J., Loganathan G., 2001, Simulation, 76, 60
- Gehrels (1986) Gehrels N., 1986, ApJ, 303, 336
- Goodman & Weare (2010) Goodman J., Weare J., 2010, Comm. App. Math. Comp. Sci., 5, 65
- Halpern (2005) Halpern J. P., 2005, ATel, 549, 1
- Hameury & Lasota (2014) Hameury J.-M., Lasota J.-P., 2014, A&A, 569, A48
- Hameury et al. (2000) Hameury J.-M., Lasota J.-P., Warner B., 2000, A&A, 353, 244
- Haswell & King (2001) Haswell C. A., King A. R., 2001, X-ray Astronomy: Stellar Endpoints, AGN, and the Diffuse X-ray Background, 599, 642
- Hiemstra et al. (2009) Hiemstra B., Soleri P., Méndez M., Belloni T., Mostafa R., Wijnands R., 2009, MNRAS, 394, 2080
- Hog et al. (2010) Hog D., Bovy J., Lang D., 2010, arXiv:1008.4686v1
- Homan et al. (2005) Homan J., Buxton M., Markoff S., Bailyn C. D., Nespoli E., Belloni T., 2005, ApJ, 624, 295
- Huang & Wheeler (1989) Huang M., Wheeler J., 1989, Astrophys. J., 343, 229
- Hynes (2005) Hynes R. I., 2005, ApJ, 623, 1026
- Hynes et al. (2002) Hynes R. I., Haswell C. A., Chaty S., Shrader C. R., Cui W., 2002, MNRAS, 331, 169
- Kajava et al. (2016) Kajava J. J. E., Veledina A., Tsygankov S., Neustroev V., 2016, A&A, 591, A66
- King & Ritter (1998) King A. R., Ritter H., 1998, MNRAS, 293, L42
- Kolehmainen et al. (2014) Kolehmainen M., Done C., Díaz Trigo M., 2014, MNRAS, 437, 316
- Kotko & Lasota (2012) Kotko I., Lasota J.-P., 2012, A&A, 545, A115
- Kraft et al. (1991) Kraft R. P., Burrows D. N., Nousek J. A., 1991, ApJ, 374, 344
- Landolt (1992) Landolt A. U., 1992, AJ, 104, 340
- Lasota et al. (2008) Lasota J.-P., Dubus G., Kruk K., 2008, A&A, 486, 523
- Lin et al. (1985) Lin D. N. C., Papaloizou J., Faulkner J., 1985, MNRAS, 212, 105
- Maccarone & Patruno (2013) Maccarone T. J., Patruno A., 2013, MNRAS, 428, 1335
- Meshcheryakov et al. (2018) Meshcheryakov A. V., Tsygankov S. S., Khamitov I. M., Shakura N. I., Bikmaev I. F., Eselevich M. V., Vlasyuk V. V., Pavlinsky M. N., 2018, MNRAS, 473, 3987
- Meyer & Meyer-Hofmeister (1981) Meyer F., Meyer-Hofmeister E., 1981, Astron. Astrophys., 104, 10
- Meyer & Meyer-Hofmeister (1983) Meyer F., Meyer-Hofmeister E., 1983, A&A, 121, 29
- Migliari & Fender (2006) Migliari S., Fender R., 2006, Mon. Not. R. Astron. Soc., 366, 79
- Miller et al. (2006) Miller J. M., Homan J., Miniutti G., 2006, ApJL, 652, L113
- Morgan et al. (2005) Morgan E., Swank J., Markwardt C., Gehrels N., 2005, ATel, 550, 1
- Neustroev et al. (2014) Neustroev V. V., Veledina A., Poutanen J., Zharikov S. V., Tsygankov S. S., Sjoberg G., Kajava J. J. E., 2014, MNRAS, 445, 2424
- Neustroev et al. (2016) Neustroev V. V., Gafton E., Haanpaa V.-J., Harmanen J., Kangas T., Kauppinen L., Sjoberg G., Venhola A., 2016, The Astronomer’s Telegram, 9741
- Osaki (1974) Osaki Y., 1974, PASJ, 26, 429
- Osaki & Kato (2013) Osaki Y., Kato T., 2013, PASJ, 65, 50
- Palmer et al. (2005) Palmer D. M., Barthelmey S. D., Cummings J. R., Gehrels N., Krimm H. A., Markwardt C. B., Sakamoto T., Tueller J., 2005, ATel, 546, 1
- Patruno et al. (2016) Patruno A., Maitra D., Curran P. A., D’Angelo C., Fridriksson J. K., Russell D. M., Middleton M., Wijnands R., 2016, ApJ, 817, 100
- Plotkin et al. (2016) Plotkin R. M., Miller-Jones J. C. A., Jonker P. G., Homan J., Russell D. M., Tomsick J. A., 2016, The Astronomer’s Telegram, 9765
- Plotkin et al. (2017) Plotkin R. M., et al., 2017, ApJ, 848, 92
- Rahoui et al. (2015) Rahoui F., et al., 2015, ApJ, 810, 161
- Reynolds et al. (2010) Reynolds M. T., Miller J. M., Homan J., Miniutti G., 2010, ApJ, 709, 358
- Roming et al. (2005) Roming P. W. A., et al., 2005, Space Sci. Rev., 120, 95
- Rushton et al. (2016) Rushton A. P., et al., 2016, MNRAS, 463, 628
- Russell et al. (2006) Russell D. M., Fender R. P., Hynes R. I., Brocksopp C., Homan J., Jonker P. G., Buxton M. M., 2006, MNRAS, 371, 1334
- Russell et al. (2010) Russell D. M., Maitra D., Dunn R. J. H., Markoff S., 2010, MNRAS, 405, 1759
- Russell et al. (2016) Russell D. M., AlMannaei A., Qasim A. A., Shaw A. W., Charles P. A., Lewis F., 2016, The Astronomer’s Telegram, 9708
- Rykoff et al. (2007) Rykoff E. S., Miller J. M., Steeghs D., Torres M. A. P., 2007, ApJ, 666, 1129
- Shahbaz & Kuulkers (1998) Shahbaz T., Kuulkers E., 1998, MNRAS, 295, L1
- Shakura & Sunyaev (1973) Shakura N., Sunyaev R. A., 1973, A&A, 24, 337
- Shaw et al. (2013) Shaw A. W., et al., 2013, MNRAS, 433, 740
- Shaw et al. (2016a) Shaw A. W., et al., 2016a, MNRAS, 458, 1636
- Shaw et al. (2016b) Shaw A. W., Charles P. A., Casares J., Hernández Santisteban J. V., 2016b, MNRAS, 463, 1314
- Shaw et al. (2016c) Shaw A. W., et al., 2016c, The Astronomer’s Telegram, 8782
- Shaw et al. (2016d) Shaw A. W., Tomsick J. A., Bahramian A., Gandhi P., Russell D. M., Charles P. A., 2016d, The Astronomer’s Telegram, 9735
- Shaw et al. (2017) Shaw A. W., Tomsick J. A., Zhang G., Russell D. M., Plotkin R. M., Miller-Jones J. C. A., Lewis F., 2017, The Astronomer’s Telegram, 10288
- Simonsen (2011) Simonsen M., 2011, Journal of the American Association of Variable Star Observers (JAAVSO), 39, 66
- Skrutskie et al. (2006) Skrutskie M. F., et al., 2006, AJ, 131, 1163
- Smak (1983) Smak J., 1983, Astrophys. J., 272, 234
- Smak (1984) Smak J., 1984, Acta Astron., 34, 161
- Smak (1999) Smak J., 1999, Acta Astron., 49, 383
- Smak (2000) Smak J., 2000, New Astron. Rev., 44, 171
- Soleri et al. (2013) Soleri P., et al., 2013, MNRAS, 429, 1244
- Subasavage et al. (2010) Subasavage J. P., Bailyn C. D., Smith R. C., Henry T. J., Walter F. M., Buxton M. M., 2010, in Observatory Operations: Strategies, Processes, and Systems III. p. 77371C, doi:10.1117/12.859145
- Szkody et al. (2013) Szkody P., et al., 2013, PASP, 125, 1421
- Tetarenko et al. (2016) Tetarenko B. E., Sivakoff G. R., Heinke C. O., Gladstone J. C., 2016, ApJS, 222, 15
- Tetarenko et al. (2017) Tetarenko A. J., et al., 2017, MNRAS, 469, 3141
- Tetarenko et al. (2018a) Tetarenko B., Dubus G., Lasota J.-P., Heinke C., Sivakoff G., 2018a, MNRAS, 480, 2
- Tetarenko et al. (2018b) Tetarenko B. E., Lasota J.-P., Heinke C. O., Dubus G., Sivakoff G. R., 2018b, Nature, 554, 69
- Tody (1986) Tody D., 1986, in Crawford D. L., ed., Society of Photo-Optical Instrumentation Engineers (SPIE) Conference Series Vol. 627, Instrumentation in astronomy VI. p. 733
- Tody (1993) Tody D., 1993, in Hanisch R. J., Brissenden R. J. V., Barnes J., eds, Astronomical Society of the Pacific Conference Series Vol. 52, Astronomical Data Analysis Software and Systems II. p. 173
- Tomsick et al. (2015) Tomsick J. A., et al., 2015, ApJ, 808, 85
- Tomsick et al. (2017) Tomsick J. A., Shaw A., Gandhi P., Rahoui F., Dincer T., 2017, The Astronomer’s Telegram, 10114
- Veledina et al. (2017) Veledina A., Gandhi P., Hynes R., Kajava J. J. E., Tsygankov S. S., Revnivtsev M. G., Durant M., Poutanen J., 2017, MNRAS, 470, 48
- Verner et al. (1996) Verner D. A., Ferland G. J., Korista K. T., Yakovlev D. G., 1996, ApJ, 465, 487
- Wilms et al. (2000) Wilms J., Allen A., McCray R., 2000, ApJ, 542, 914
- Zhang et al. (2017) Zhang G.-B., Russell D. M., Bernardini F., Gelfand J. D., Lewis F., 2017, The Astronomer’s Telegram, 10562
- Zurita et al. (2008) Zurita C., Durant M., Torres M. A. P., Shahbaz T., Casares J., Steeghs D., 2008, ApJ, 681, 1458
- van Paradijs (1983) van Paradijs J., 1983, in Lewin W. H. G., van den Heuvel E. P. J., eds, Accretion-Driven Stellar X-ray Sources. pp 189–260
- van Paradijs (1996) van Paradijs J., 1996, ApJ, 464, L139
- van Paradijs & McClintock (1994) van Paradijs J., McClintock J., 1994, A&A, 290, 133
Appendix A Fits to the UVOIR SEDs
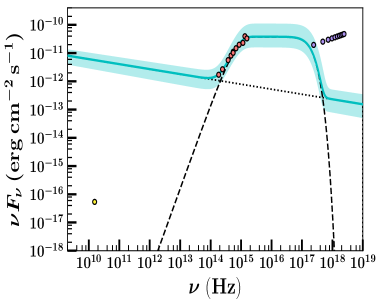
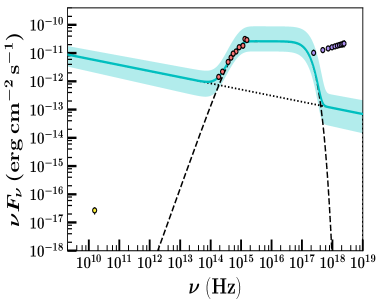
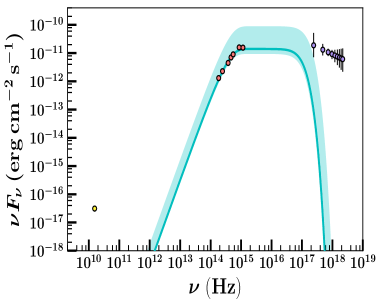
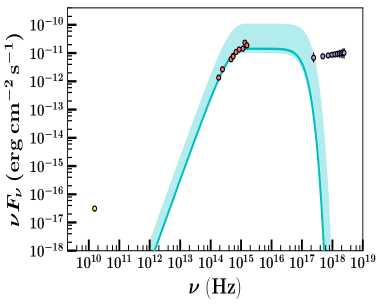
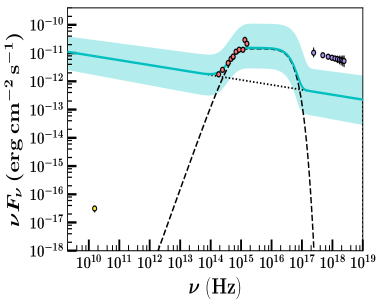
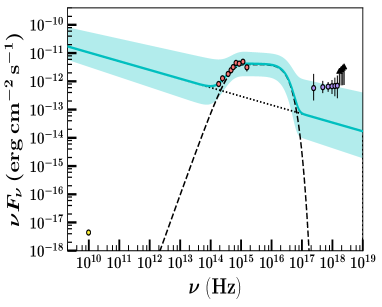
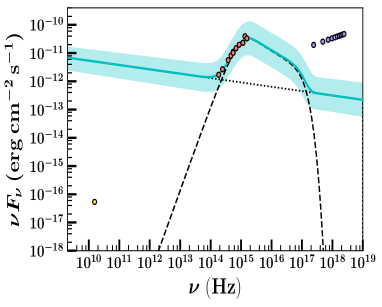
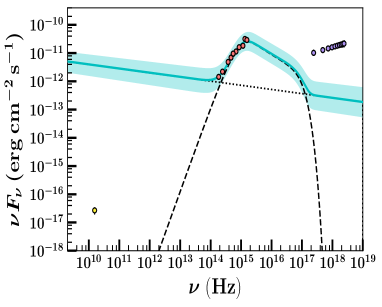
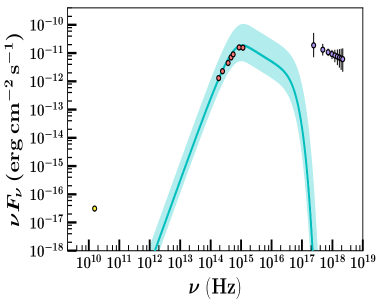
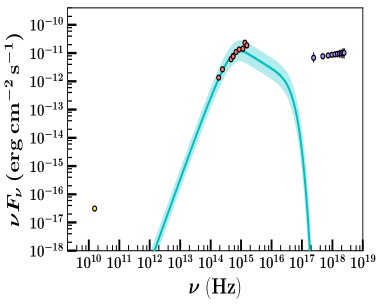
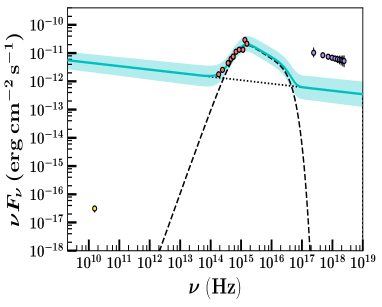
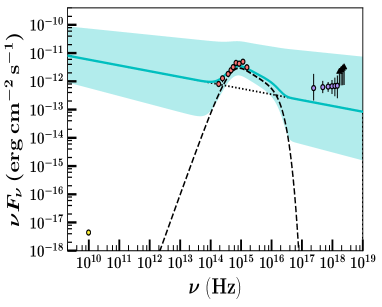
Broadband SEDs for 6 individual epochs during the Swift J1753.5-0127 mini-outburst fit with the irradiated disc model with a temperature distribution . All data are simultaneous or quasi-simultaneous (within 1 day) and has been dereddened. The solid cyan line and shaded regions represent the best-fit and 1 confidence intervals from the MCMC fitting algorithm, respectively. The dotted lines show the individual contributions from the irradiated disc (dashed) and jet (dotted), where applicable. Only the UVOIR data (Swift/UVOT and SMARTS; red) are fit. X-ray (Swift/XRT: keV; purple) and radio (VLA: 9.8 GHz and AMI: 15.5 GHz from Plotkin et al. 2017; yellow) are also plotted to show the multi-wavelength behaviour of the source.
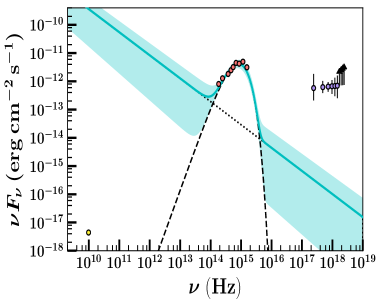
Broadband SEDs for 6 individual epochs during the Swift J1753.5-0127 mini-outburst fit with the non-irradiated disc model with a temperature distribution . All data are simultaneous or quasi-simultaneous (within 1 day) and has been dereddened. The solid cyan line and shaded regions represent the best-fit and 1 confidence intervals from the MCMC fitting algorithm, respectively. The dotted lines show the individual contributions from the irradiated disc (dashed) and jet (dotted), where applicable. Only the UVOIR data (Swift/UVOT and SMARTS; red) are fit. X-ray (Swift/XRT: keV; purple) and radio (VLA: 9.8 GHz and AMI: 15.5 GHz from Plotkin et al. 2017; yellow) are also plotted to show the multi-wavelength behaviour of the source.