Linking bar- and interaction-driven molecular gas concentration with centrally-enhanced star formation in EDGE-CALIFA galaxies
Abstract
We study the spatially resolved star formation history and molecular gas distribution of 58 nearby galaxies, using integral field spectroscopy from the CALIFA survey and CO intensity mapping from the CARMA EDGE survey. We use the 4000 Å break (Dn(4000)), the equivalent width of the H absorption line (EW(HA)), and the equivalent width of the H emission line (EW(H)) to measure the recent star formation history (SFH) of these galaxies. We measure radial profiles of the three SFH indicators and molecular gas mass surface density, from which we measure the level of centrally enhanced star formation and the molecular gas concentration. When we separate our galaxies into categories of barred (17 galaxies), unbarred (24 galaxies), and merging/paired (17 galaxies) we find that the galaxies which have centrally-enhanced star formation (19/58) are either barred (13/19) or in mergers/pairs (6/19) with relatively high molecular gas concentrations. A comparison between our barred galaxies and a snapshot of a hydrodynamic -body simulation of a barred galaxy shows that the current theory of bar formation and evolution can qualitatively reproduce the main features of the observed galaxies in our sample, including both the sharp decrease of stellar age in the galactic center and the gradual decrease of age with increasing distance from center. These findings provide substantial evidence for a picture in which cold gas is transported inward by a bar or tidal interaction, which leads to the growth and rejuvenation of star formation in the central region.
keywords:
galaxies: evolution – galaxies: star formation – galaxies: bulges – galaxies: interactions – galaxies: spiral1 Introduction
Bars play an essential role in the secular evolution of galaxies. Simulations have shown that the growth of a bar causes gas to either form a ring structure or fall inwards and trigger central star formation (Athanassoula, 1992b, 1994; Piner et al., 1995; Athanassoula et al., 2013; Sormani et al., 2015). Minor mergers and tidal interactions have a similar effect as bars, as these events also tend to drive molecular gas inward (Barnes & Hernquist, 1991). The subsequent star formation from these processes leads to the growth of the central disky pseudobulge (Kormendy & Kennicutt, 2004; Athanassoula, 2005, and references therein). Internal processes can quench star formation, such as feedback from an active galactic nucleus (AGN), or the growth of the central bulge which can stabilize the gas disk (Martig et al., 2009). Bars can counteract these quenching mechanisms by transporting gas to the center which can fuel subsequent central star formation.
The most commonly-used tracer of molecular gas mass in the interstellar medium is line emission of the CO molecule, e.g. CO , , etc. (Bolatto et al., 2013, and references therein). Observational studies of CO have found elevated molecular gas concentrations in barred galaxies compared to their unbarred counterparts (e.g., Sakamoto et al., 1999; Sakamoto, 2000; Jogee et al., 2005; Sheth et al., 2005; Regan et al., 2006; Kuno et al., 2007). It is also known that star formation rates (SFRs) are higher in the central region of barred galaxies compared to unbarred galaxies (e.g, Hawarden et al., 1986; Devereux, 1987; Puxley et al., 1988; Ho et al., 1997; Ellison et al., 2011; Oh et al., 2012; Zhou et al., 2015). Minor mergers and galaxy-galaxy interactions have also been found to correlate with increased central star formation (e.g., Li et al., 2008; Ellison et al., 2011; Wang et al., 2012; Lin et al., 2014). Interaction-induced enhancement of star formation is found mainly in galaxies with projected separations less than kpc (Li et al., 2008; Patton et al., 2013; Ellison et al., 2013). A number of recent studies have used both molecular gas tracers and star formation indicators to study central star formation and cold gas in interacting galaxies (e.g., Saintonge et al., 2012; Stark et al., 2013; Kaneko et al., 2013; Violino et al., 2018), finding lower gas depletion times and enhanced gas content in these galaxies. Galaxies in dense environments also tend to have more centrally-concentrated molecular gas and enhanced star formation (e.g., Mok et al., 2017).
Most earlier optical studies of galaxies used single-fiber measurements from the Sloan Digital Sky Survey (SDSS; York et al., 2000). Integral-field unit (IFU) surveys such as the Calar Alto Legacy Integral Field Area (CALIFA) survey (Sánchez et al., 2012; Walcher et al., 2014; Sánchez et al., 2016), the SDSS-IV Mapping nearby Galaxies at Apache Point Observatory Survey (MaNGA; Bundy et al., 2015; Blanton et al., 2017), and the Sydney-AAO Multi-object Integral field spectrograph (SAMI; Croom et al., 2012) have provided spatially resolved spectroscopy for thousands of galaxies in the local Universe, enabling detailed studies of the correlation of internal structure of galaxies with their star formation properties.
Of particular interest for the present work, Lin et al. (2017) analyzed 57 nearly face-on spiral galaxies using CALIFA IFU data. They measured the recent star formation history (SFH) using three parameters extracted from the CALIFA data: the 4000 Å-break Dn(4000), and the equivalent widths (EW) of the H emission line EW(H) and H absorption line EW(HA). A considerable fraction of their galaxies (17/57) had a central drop (“turnover”) in the Dn(4000), and a central upturn in EW(H) and EW(HA), indicating recent star formation in the center. Interestingly, almost all of these “turnover” galaxies are barred, while only half of the barred galaxies in their sample present a turnover feature, suggesting that a bar is a necessary but not sufficient condition for central star formation enhancement. The only parameter found to be correlated with the level of central star formation is the bar length, an indicator of bar strength. Together with the results of Kuno et al. (2007), for example, who found a correlation between bar strength and molecular gas concentration, one might expect enhanced central star formation to be associated with molecular gas concentration. Observations of the cold gas within galaxies, with spatial resolution comparable to the optical IFU data, are needed in order to clearly examine the correlation of the two components.
Uniform samples of high-sensitivity (detections of 1 pc-2), high spatial resolution (sub-kpc) cold gas measurements of nearby galaxies are available, however the sample sizes range from a few up to 30-50 galaxies. Although a sample of 30-50 galaxies is sufficient for many purposes, the effective sample size can quickly become much lower after selection cuts (on redshift, stellar mass, etc.) and/or dividing the galaxies into different categories for comparison (e.g. barred or unbarred). Some notable studies and surveys are Kennicutt et al. (2007), Bigiel et al. (2008), the H i Nearby Galaxy Survey (THINGS; Walter et al., 2008), and the HERA CO-Line Extragalactic Survey (HERACLES; Leroy et al., 2009). At slightly lower spatial resolution, recent surveys have obtained spatially resolved CO spectra for significantly larger samples, such as the James Clerk Maxwell Telescope (JCMT) Nearby Galaxies Legacy Survey (NGLS; 155 galaxies, 50% detected; Wilson et al., 2012), the Combined Array for Research in Millimeter-wave Astronomy (CARMA) Extragalactic Database for Galaxy Evolution (EDGE) CO survey (126 galaxies, 82% detected; Bolatto et al., 2017), and the CO Multi-line Imaging of Nearby Galaxies survey (COMING; 127 galaxies; Sorai, K., et al. 2018, in preparation). Galaxies in the CARMA EDGE survey were selected from the CALIFA survey, and were observed in CO with a similar field-of-view and angular resolution (″) as the CALIFA data (″). The similar resolution and field-of-view were intended to enable joint analyses of the stellar populations and cold gas content of nearby galaxies. Recent work by Utomo et al. (2017) found, using EDGE and CALIFA data, that barred and interacting galaxies tend to have smaller center-to-disk gas depletion time ratios than unbarred, isolated galaxies.
In this paper we extend the work of Lin et al. (2017) by explicitly linking the central SFH and resolved gas properties in barred, unbarred, and interacting galaxies. We have used spatially resolved maps of CO from EDGE and SFH indicators from CALIFA to accomplish this goal. We find that molecular gas concentrations are indeed associated with centrally-enhanced star formation, and this link is seen in both barred galaxies and interacting galaxies. Our main result is that the level of centrally-enhanced star formation in barred galaxies is positively correlated with molecular gas concentration (correlation coefficient ), while unbarred galaxies show little-to-no centrally-enhanced star formation and no correlation (). Some merger/pair galaxies have centrally enhanced star formation, but the correlation between the level of enhanced star formation and gas concentration is weak (). In addition, we have compared these observational results with an -body simulation of the gas and stellar distributions of a barred galaxy. The similarities between the simulation and the real galaxy suggest that the current theory of bar formation can qualitatively reproduce the key features of real galaxies.
The structure of this paper is as follows. In §2 we describe the data used and how they are processed. We present our observational results in §3 and the comparison with the -body simulation in §4. We discuss some questions in light of our results and highlight interesting individual galaxies in §5. Finally, we summarize our work in §6. Tables of galaxy properties and a discussion of a few unusual galaxies are given in the Appendix. Throughout this paper we assume a CDM cosmology with parameters km s-1 Mpc-1, , and , following the results from the Planck satellite (Planck Collaboration et al., 2016).
2 Data and processing
2.1 The CARMA EDGE and CALIFA surveys
CARMA EDGE (Bolatto et al., 2017) is a survey of CO emission in 126 nearby galaxies carried out using the CARMA interferometer (Bock et al., 2006). The CARMA EDGE sample was selected from the CALIFA sample with high fluxes in the 22m band from the Wide-field Spectroscopic Explorer (WISE) survey. The requirement for high mid-infrared flux means that the sample is mainly gas-rich and actively star-forming, given the correlation between the mid-infrared luminosities from WISE and the molecular gas mass (e.g. Jiang et al., 2015). The sample consists of galaxies imaged in 12CO and 13CO with sensitivity, angular resolution and field-of-view well-matched to CALIFA data. The typical molecular gas mass surface density sensitivity is 11 , and the typical angular resolution is 4.5″ (Bolatto et al., 2017). We use the publicly available 12CO integrated flux maps from CARMA EDGE. Specifically, we chose the version of these maps made by creating a mask using a smoothed version of the data cubes, and applying this mask to the original (un-smoothed) cubes before integrating. The maps are sampled with 1″ 1″ pixels.
We use optical IFU data from the 3rd data release (DR3) of the CALIFA survey (Sánchez et al., 2012). The CALIFA survey consists of about 600 galaxies observed with the PMAS/PPak integral-field spectrograph at the Calar Alto Observatory (Roth et al., 2005; Kelz et al., 2006). The CALIFA datacubes are available in three spectral setups: (1) a low-resolution setup with 6 Å spectral resolution (), (2) a medium-resolution setup with 2.3 Å resolution (), and (3) the combination of and cubes (called COMBO). The mean angular resolution of CALIFA is 2.5″, which is similar to SAMI and MaNGA. The maps are sampled with 1″ 1″ pixels. We used the COMBO data cubes from CALIFA DR3 where available. For the 8 CARMA EDGE galaxies with no COMBO datacubes available, we used the datacubes instead.
2.2 Sample selection
Starting with all 126 CARMA EDGE galaxies, we remove galaxies which are close to edge-on by requiring the minor-to-major axis ratio to be . For our analysis we need to be able to measure radial profiles of the molecular gas mass density, so we exclude galaxies which are not detected in CO emission, which would prevent us from measuring a radial profile. We use same definition of “detection” as Bolatto et al. (2017), namely a cube which has at least one beam with at least a 5 detection in at least one velocity bin ( km/s). Furthermore, we remove four galaxies from our sample which are classified as Seyferts according to the SIMBAD database, since we suspect such galaxies may have different central star formation properties (and perhaps molecular gas properties) than non-AGN. We remove an additional 6 galaxies which we classify as AGN based on their BPT diagrams. We would like to emphasize that the correlation of nuclear activity with cold gas concentration is an interesting topic by itself, but this is outside the scope of the current paper.
These requirements leave us with 58 galaxies. Some basic properties of the sampled galaxies are listed in Table 3. The galaxies in our sample are located between 24 and 128 Mpc away, or 68 Mpc on average. The angular resolutions of CALIFA (2.5″) and CARMA (4.5″) at these distances correspond to physical diameters of 0.27-1.5 kpc and 0.5-2.8 kpc respectively. The pixel scale of 1″ corresponds to a physical scale of 0.1-0.6 kpc.
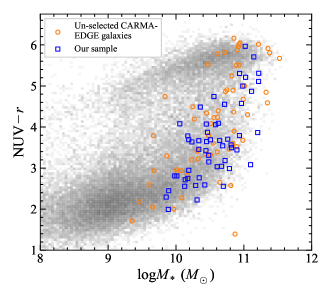
Figure 1 shows our sample (blue squares) in the NUV vs. M∗M plane on top of a volume-limited sample () selected from the NASA-Sloan Atlas111NSA: http://www.nsatlas.org (NSA), version 0.1.2. The NUV magnitudes in the NSA catalog are from the Galaxy Evolution Explorer (GALEX) (Martin et al., 2005), and the stellar masses are estimated by Blanton & Roweis (2007) based on SDSS ugriz Petrosian magnitudes; see Blanton et al. (2005a); Blanton et al. (2005b, 2011) for details on the NSA. As can be seen, our sample covers a wide range of global properties from the star forming main sequence (the lower part of the plane) through the green valley and into the red sequence, and is roughly representative of the CARMA EDGE survey (the orange circles plus our sample). Compared to the volume-limited sample, galaxies in the EDGE sample have relatively high stellar masses with , and are predominately blue or green in colour with some extending into the red sequence. Their mostly-blue NUV colours (indirectly) suggests that they have mainly high molecular gas mass fractions according to the tight empirical relation between H2 mass fraction and NUV (Saintonge et al., 2017). This is expected, given the requirement for high 22-m WISE luminosity in the EDGE sample selection.
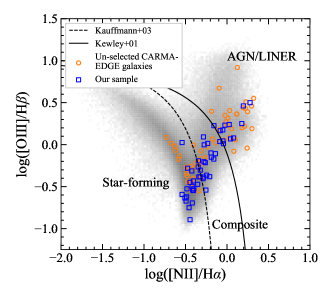
Figure 1 also shows our sample on the Baldwin, Phillips and Terlevich (BPT) diagram (Baldwin et al., 1981). For reference, we show the BPT diagram for a volume-limited sample from the MPA-JHU catalog derived from SDSS DR8 data. For this plot we have measured the fluxes of the four emission lines in the central 3″ of all CARMA EDGE galaxies using the processed CALIFA data. Our galaxies fall mainly in the star-forming and composite regions, with some extending to the LINER region. Compared to the full EDGE sample (orange + blue), our sample lacks Seyfert galaxies which is a consequence of our sample selection as described above. Note that some galaxies are not shown on this diagram, because the signal-to-noise is required to be greater than 3.0 in all four emission lines.
In a later section we analyze the gas content and star formation rate surface density in the nuclei of our galaxies. For that analysis we require at least 50 percent of the pixels in the central 500 pc (radius) to be detected in CO, and not be classified as LINER. 31/58 galaxies from our primary sample satisfy these more stringent requirements. This smaller sample (which we call our “reduced” sample) is used in §3.3.
2.3 Morphological classification
We visually classify all of the galaxies in our sample (done by the first two authors) as either barred or unbarred, and we cross-check our results with two or three independent classifications from the literature. First, we use the morphological classification by the CALIFA team (Walcher et al., 2014), who classify the galaxies as barred, unbarred, or uncertain. The CALIFA morphological classification is done by-eye by the CALIFA collaboration using r- and i-band SDSS DR7 images, as described in Walcher et al. (2014). Next, we cross-match our sample with the SIMBAD database (Wenger et al., 2000) to get morphological types and references for each. Additionally, there are 19 galaxies in our sample that overlap with the sample of Lin et al. (2017), who performed a reliable bar classification by applying the IRAF task ELLIPSE to the background-subtracted -band images from SDSS. For most galaxies in our sample, these two (or three where available) cross-checks on the bar status agree. Our final classification of barred or unbarred is our best judgment of the CALIFA, SIMBAD, Lin et al. (2017) and our own by-eye classification.
Next, each galaxy is classified as either isolated or interacting with another galaxy (mergers or pairs). Galaxies which are classified by the CALIFA team as mergers or isolated are initially put into these two categories. There are a small number of galaxies with uncertain merger status based on their classification. We then cross-check all isolated/merger classifications with the SIMBAD database, which resolves the uncertain cases, and moves some galaxies classified as isolated into the paired category. Galaxies in SIMBAD are classified as interacting if they belong to catalogues of interacting galaxies such as Vorontsov-Velyaminov et al. (2001); galaxies are classified as pairs if they belong to any of the available catalogues of paired galaxies (e.g., Karachentsev, 1972; Turner, 1976; Barton Gillespie et al., 2003).
We visually examine the SDSS gri images of all galaxies classified as pairs, and in a small number of cases, the companion galaxies are too far away to affect the central star formation (greater than kpc as discussed in §1, and/or at significantly different redshifts). Such cases are moved into either the isolated barred or isolated unbarred category.
These classifications are used to group the galaxies into three categories: isolated barred, isolated unbarred, and merger/pair/interacting. Note that pair galaxies may be barred or unbarred. In summary, we have 17 isolated barred galaxies, 24 isolated unbarred galaxies, and 17 merger or interacting pair galaxies. The reduced sample mentioned in the previous section consists of 11 barred galaxies, 13 unbarred galaxies, and 7 merger/pair galaxies.
The means and standard deviations of the distances of the barred, unbarred and merger/pair categories are Mpc, Mpc, and Mpc, respectively. Given the similarity of these distributions, we do not expect any distance-related biases to affect the physical resolution of our data. Furthermore, we compare the populations using distance-independent quantities.
2.4 Maps and radial profiles of recent SFH diagnostics
We measure three spectral indices, which together tell us the recent SFH for a given spaxel of our galaxies (Bruzual & Charlot, 2003; Kauffmann et al., 2003b; Li et al., 2015; Lin et al., 2017):
- EW(H)—
-
Equivalent width (EW) of the H emission line. This quantifies the ratio of the current star formation rate (0-30 Myr; Kennicutt & Evans, 2012) to the recent past star formation rate.
- EW(HA)—
-
EW of the H absorption line (the subscript indicates absorption). A strong H line indicates a burst of star formation which ended 0.1 to 1 Gyr ago (Kauffmann et al., 2003a).
- Dn(4000)—
-
The 4000 Å break. This index is sensitive to stellar populations formed 1-2 Gyr ago. In practice, if Dn(4000) , there has been star formation in this time frame (Li et al., 2015).
For each galaxy in our sample, we perform full spectral fitting to each spaxel in the CALIFA DR3 COMBO data cube (or for the few galaxies which do not have COMBO datacubes), using the Penalized Pixel-Fitting code222http://www-astro.physics.ox.ac.uk/~mxc/software (pPXF) (Cappellari & Emsellem, 2004; Cappellari, 2017). The Bruzual & Charlot (2003) simple stellar populations (SSP) and the Calzetti et al. (2000) reddening curve were used during the fitting. The result of the full spectral fitting is a best-fit model spectrum representing the stellar component of the spaxel (continuum plus absorption lines) which is a linear combination of the SSPs, plus a color excess quantifying the overall dust extinction. Both the observed spectrum and the model spectrum are corrected for dust extinction according to this . The equivalent width of H and Dn(4000) are then measured from the model spectrum. In addition, we obtain the luminosity-weighted age of the spaxel based on the luminosity and coefficient of the SSPs that form the best-fit spectrum.
The model spectrum is then subtracted from the observed one, and we measure both the dust-corrected flux and the equivalent width for the H emission line. We correct for the dust extinction based on the Balmer Decrement measured from the observed spectrum. For this we have assumed a temperature of K, an electron density of cm-3 in the H ii regions, an intrinsic H-to-H flux ratio of 2.86 in case-B recombination (Osterbrock & Ferland, 2006), as well as a Calzetti et al. (2000) reddening curve. The dust-corrected H flux is converted to a luminosity using the distance assuming the adopted cosmological parameters §1. A star formation rate (SFR) is then estimated by multiplying the H luminosity by yr-1 (erg s-1)-1 as in Murphy et al. (2011); Hao et al. (2011); Kennicutt & Evans (2012). This SFR calibration adopts the stellar initial mass function (IMF) from Kroupa & Weidner (2003).
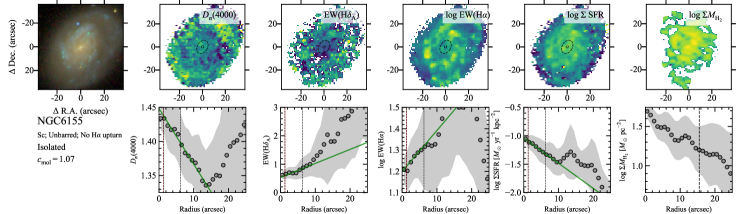
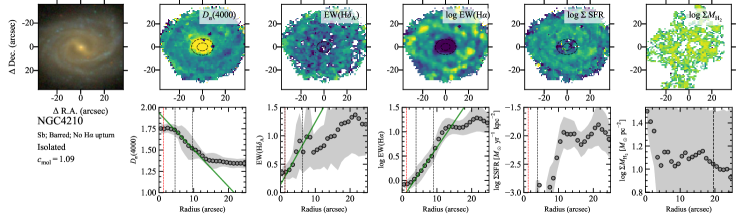
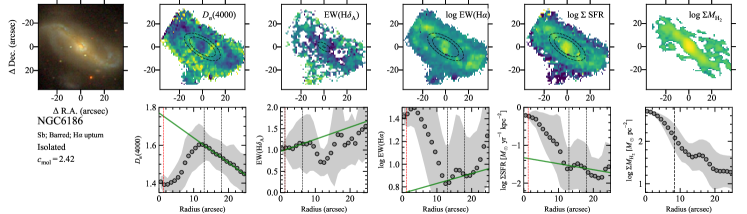
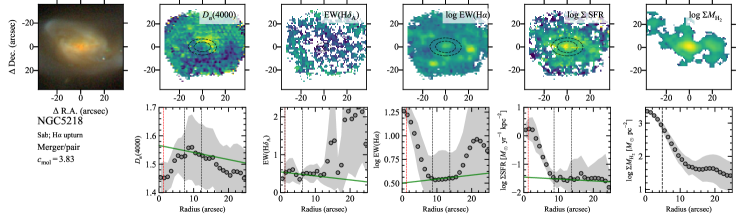
We compute radial profiles of each quantity by azimuthally averaging the maps in elliptical annuli separated by 1″ along the semi-major axis. The position angles and minor-to-major axis ratios are taken from the CALIFA DR3 supplementary tables (Walcher et al., 2014). Partial pixel overlap within each annulus is taken into account, and pixels with signal-to-noise ratio less than 1 are set to zero in the averages. Using a value instead of zero does not significantly affect the radial profiles at the radii used in our analysis. The SDSS gri images and the processed maps of Dn(4000), EW(HA) and EW(H), as well as their radial profiles are shown in Figure 2 for four example galaxies from our sample: an unbarred galaxy in the top (NGC6155), followed by two barred galaxies (NGC4210 and NGC6186) and a merging galaxy (NGC5218). The first two galaxies present similar radial profiles in the recent SFH indicators in the sense that, from galactic center to larger radii, Dn(4000) decreases while both EW(H) and EW(HA) increase. This radial profile shape indicates a relatively old stellar population in the inner region, and less star formation in the recent past in this region. Large samples of IFU observations such as MaNGA have shown that radial profiles like this are typical for the general population of galaxies in the local Universe, although the amplitudes and slopes of the profiles depend on galaxy stellar mass (e.g. Wang et al., 2018).
Different from the top two galaxies in Figure 2, the bottom two galaxies in the same figure show a significant upturn in EW(H) and/or a significant turnover in Dn(4000) in their innermost region, indicating star formation has been recently enhanced in the central region. Galaxies with a central turnover in Dn(4000) were called “turnover” galaxies in Lin et al. (2017). Those authors found that almost all turnover galaxies are barred. We note that the two galaxies in Figure 2 with a turnover feature are a barred galaxy and a merger.
2.5 Maps and radial profiles of molecular gas mass
We take the integrated flux CO maps from the public CARMA EDGE data release, convert them from their native units of Jy km/s beam-1 to K km/s, and then convert to H2 gas mass surface densities in units of pc-2 by assuming a constant CO-to-H2 conversion factor pc-2 (K km/s)-1 (Bolatto et al., 2013; Sandstrom et al., 2013). The conversion factor has been found to be lower by a factor of about 2 (i.e. pc-2(K km/s)-1) in the central kpc of nearby galaxies (Sandstrom et al., 2013). For simplicity, we adopt pc-2 (K km/s)-1 but we do consider the impact of the central on our results in later sections. Radial profiles of for our sample are computed in the same way as in the previous section. Pixels without CO detections are set to zero in the averages. As a result, is slightly underestimated at large radii where the fraction of detected pixels is small. However, the fraction of missing flux in the CO maps is small, so this is a good approximation to the true radial profiles (Bolatto et al., 2017). Maps and radial profiles of for our example galaxies are shown in the right-most column in Figure 2.
3 Central star formation and the link to gas concentration
| Category | a | b | c | d | e |
|---|---|---|---|---|---|
| (dex) | (dex) | (Å) | |||
| Barred | |||||
| All | 17 | ||||
| Upturn | 13 | ||||
| No upturn | 4 | ||||
| Unbarred | |||||
| All | 24 | ||||
| Upturn | 0 | ||||
| No upturn | 24 | ||||
| Merger/pair | |||||
| All | 17 | ||||
| Upturn | 6 | ||||
| No upturn | 11 | ||||
| a Number of galaxies in category. | |||||
| b Mean and uncertainty on the mean of the molecular gas concentration index (Eq. 3). | |||||
| c Mean and uncertainty on the mean of the EW(H) upturn strength (Eq. 1). | |||||
| d Mean and uncertainty on the mean of the EW(HA) upturn strength (Eq. 1). | |||||
| e Mean and uncertainty on the mean of the Dn(4000) turnover strength (Eq. 2). | |||||
3.1 Recent central star formation enhancement
Our identification and measurement of centrally elevated star formation is similar to the procedure described in Lin et al. (2017). First we calculate radial profiles of logEW(H), EW(HA), Dn(4000), and , and plot them next to the gri composite image from SDSS. We then inspect each profile in the inner region of each galaxy (inside of the spiral arms), and judge whether or not the central region shows an upturn (for EW(H), EW(HA) and ) or a drop (for Dn(4000)) in the slope of the profile in the innermost region. The inner region corresponds to a by-eye estimate of the radius of the transition between bulge and disk. Note that Lin et al. (2017) had performed photometric decomposition on the optical images, allowing for a precise measurement of these radii, but we do not have that information for all galaxies in our sample so we estimate the inner region by eye. The by-eye estimate of the inner radius is not used in the following analysis. If such an upturn or turnover is identified, we mark by eye the radius at which it occurs.
Next, for each galaxy, and for a given star formation history indicator, we fit a line to the radial profile between and ″, where is the turn-up/turnover radius determined by eye in the first step. This is what was done in Lin et al. (2017). Those authors found that this radial range provided a sufficient fit to the general profile in the inner region without being contaminated by spiral arms or the transition region. For radial profiles which are not visually classified as having an upturn/turnover, we still perform the linear fitting, but we set to half of the point-spread function (PSF) size of CALIFA (roughly 1.25″; Walcher et al., 2014). In Figure 2, the linear fits are plotted as green solid lines for the four example galaxies. In each panel the radial range used for the linear fitting is indicated by the two vertical, dotted lines. By our definition, the value of EW(H) or EW(HA) at the center may be lower than where the fitting is performed (e.g. the logEW(H) profiles of NGC4210 in Fig. 2), or it may be greater (as in the logEW(H) profiles of NGC6186 and NGC5218 in Fig. 2). In either of these scenarios, the value of the SFH indicator in the center is greater than expected from extrapolating the linear fit to the center.
The upturn/turnover strength of each galaxy, for each of the star formation history indicators, is then quantified by the difference between the observed and extrapolated value in the central region, as measured above. Specifically, for EW(H), EW(HA) and , the upturn strength is defined as
| (1) |
where is the value of in the central radial bin, and is the best-fit line extrapolated to . For Dn(4000), the turnover strength is defined as
| (2) |
Note that larger values of () correspond to stronger turnovers (upturns). The upturn and turnover strengths of each galaxy in our sample are listed in Table 4.
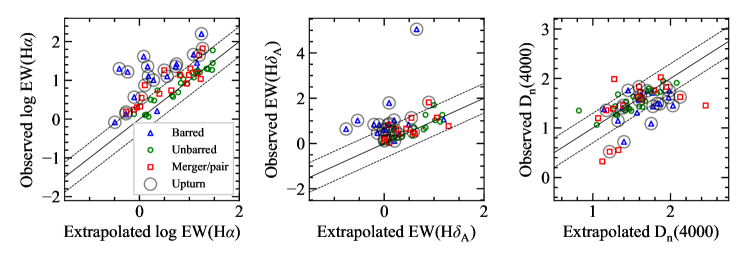
In Figure 3, which shows the central observed value of each star formation history indicator compared to the value of the line extrapolated to the center for all the galaxies in our sample. Barred, unbarred and merging/paired galaxies are plotted as blue triangles, green circles and red squares, respectively. The 1:1 relation represents no difference between the observed and extrapolated values. We divide our galaxies into two sets (those with or without an upturn in EW(H)) by comparing the observed value of the EW(H) profile at with the value of the fitting line extrapolated to . A galaxy is classified as having an upturn if it lies above the 1:1 relation (the solid line) plus the scatter (the dotted lines) on the left panel of Figure 3. The scatter is the standard deviation of all points with respect to the 1:1 line. We note that turnover/non-turnover galaxies in Lin et al. (2017) were divided in the same way but using Dn(4000) rather than EW(H).
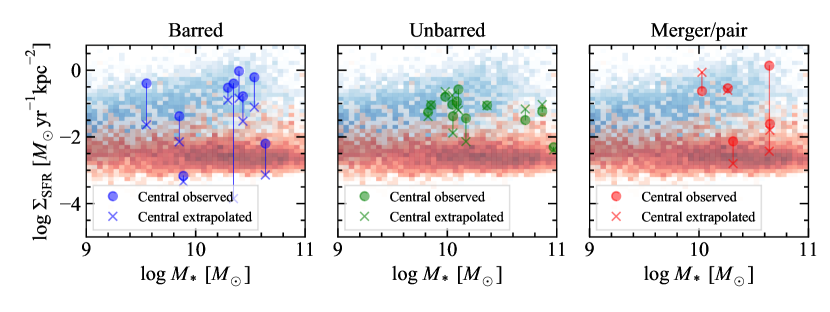
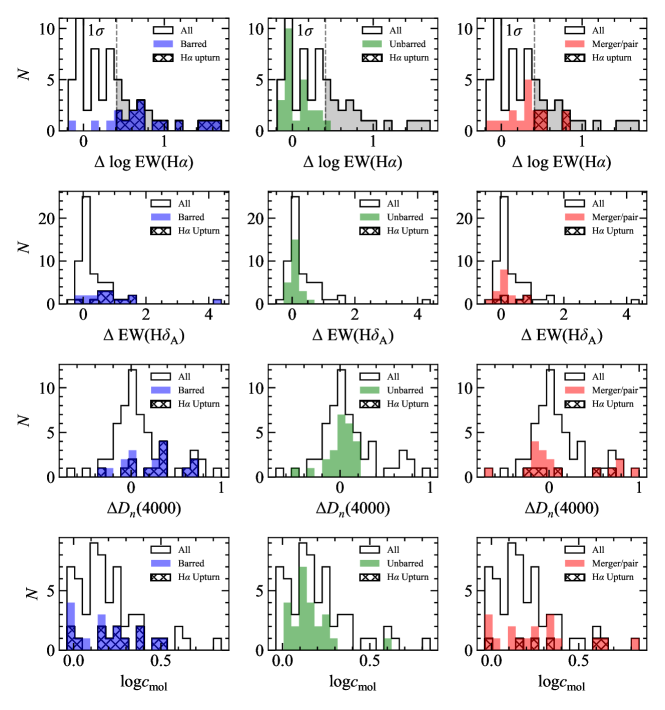
Figure 4 shows histograms of the upturn and turnover strengths of our sample, for three of the star formation history indicators: EW(H), EW(HA), and Dn(4000). Results are shown for the barred (red), unbarred (green) and paired/merging (red) galaxies separately in panels from left to right. The separating value of EW(H) dex, which is determined from the scatter of the points about the 1:1 relation in Fig. 3, is shown as the vertical dashed line in the top row of Fig. 4. In the second and third rows of the same figure, we show the distributions of our sample in EW(HA) and Dn(4000), highlighting the EW(H)-upturn galaxies as hatched histograms. The mean and uncertainty on the mean upturn strengths from each SFH indicator are shown in Table 1.
Both Figure 3 and Figure 4 show that none of the unbarred galaxies in our sample are classified as having a EW(H) upturn. The majority of the upturn galaxies are barred (13/19), followed by mergers and pairs (6/19). On the other hand, not all of the barred or paired/merging galaxies have upturns. This result suggests that either a bar or galaxy-galaxy interactions/mergers is necessary, but neither alone is sufficient for the central upturn to occur. In agreement with Lin et al. (2017), we find that most galaxies classified as having a central upturn in EW(H) also have a relatively strong EW(HA) upturn and Dn(4000) turnover. These results suggest an enhancement in both the recent and ongoing star formation at the center of the upturn galaxies.
In Figure 5 we compare the central-observed and central-extrapolated as a function of global stellar mass for barred (left panel), unbarred (middle panel) and merger/pair (right panel) galaxies. The galaxies shown in this plot are a subset of our reduced sample (§2.2) for which we can perform linear fitting to the radial profiles of . For reference, in each panel we show the distribution of the volume-limited galaxy sample selected from the MPA/JHU SDSS database (see above), for which the SFR is measured from the SDSS 3″-fiber spectroscopy. We find that barred galaxies generally have observed values of that are significantly higher than expected (by 0.5-2 dex), effectively bringing the central from values that would be typical of the quiescent population or green valley, up into the star-forming main sequence. For unbarred galaxies, we see little change in the central SFR surface density, as expected. Overall, these results are consistent with the theoretical expectation that the central region may be rejuvenated by star formation enhancement driven by a bar. The merger/pair galaxies appear to either have no enhancement or centrally suppressed star formation, however, this is not representative of merger/pair galaxies as a whole due to the selection cuts.
3.2 Recent central star formation vs. molecular gas concentration
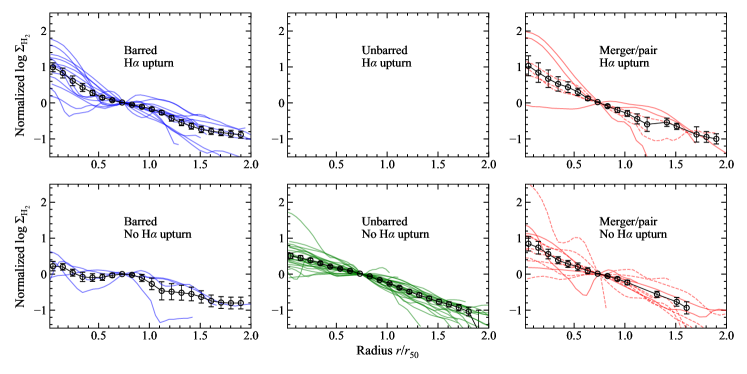
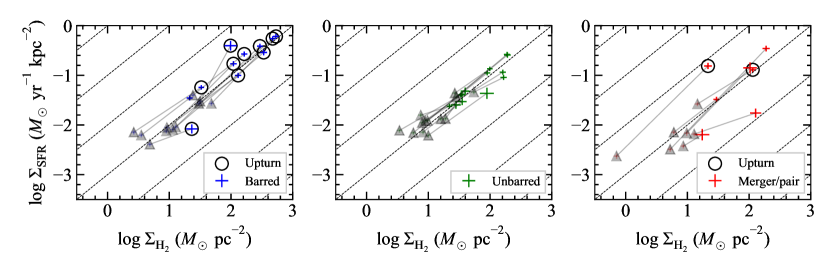
Figure 6 displays the H2 gas mass surface density profiles for barred (left), unbarred (middle) and merger/pair galaxies (right), and for the subsets of upturn galaxies (upper panels) and non-upturn galaxies (lower panels), as classified above. In this figure we have normalized each profile to the value of at , and have scaled the radius by . In each panel we also show the mean profile and the standard deviation around the mean.
The upturn galaxies on average show a centrally-peaked molecular gas profiles. The peak value of the normalized gas profiles relative to is dex for upturn galaxies and all merger/pairs, vs. dex for unbarred galaxies. Almost all of the non-upturn barred or unbarred galaxies have a molecular gas profile without a central peak. Also, some galaxies show unusual profiles, deviating to varying degrees from the average profile of their type. These outlier galaxies are interesting targets for individual follow-up work.
We measure a molecular gas concentration index for each of our galaxies, defined by
| (3) |
where is the half-light radius in the SDSS -band, obtained from the NSA, and is the radius enclosing half of the total molecular gas mass. This definition of concentration is similar to the optical concentration index which is commonly used in the SDSS-based studies and defined as , where is the radius enclosing 90% of the r-band light. A larger value of indicates a higher central concentration of gas mass.
The molecular gas half-mass radius was used in early single-dish surveys such as Young et al. (1995), and was estimated for many but not all (38/58) of the galaxies in our sample by the EDGE-CALIFA team (Bolatto et al., 2017). For completeness, we redo the measurements for all 58 galaxies in our sample. We measure by computing the cumulative molecular gas mass radial profile (in linear units, not logarithmic), and determine the radius at which the enclosed mass equals half of the total H2 mass. We have adopted two different methods to measure the total H2 mass. In the first method, which is our fiducial method, we ignore non-detections and estimate the total H2 mass by the sum of the detected pixels. In the second method, we include non-detections as 1 upper-limits, where is the RMS noise in each pixel, obtained from the unmasked CARMA EDGE integrated flux maps. In this case the H2 mass in each radial bin is the sum of the detections and non-detections, unless the fraction of detected pixels in that bin is less than 0.05, as was done in Mok et al. (2017) when measuring the radial profiles of H2 for galaxies in the NGLS (Wilson et al., 2012). In both methods, the enclosed mass as a function of radius is given by the integral of the radial profile of , and is used to determine the half-mass radius. We find that the two methods lead to almost identical measurements, indicating that non-detection pixels contribute little to the total H2 mass.
All values of are computed using the first method. Two of the galaxies in the merger/pair category have that is the CARMA resolution, so we have quoted their concentrations as lower limits. The rest of our galaxies have which is significantly larger than the CARMA resolution. The bottom panel of Figure 4 shows the distribution of molecular gas concentrations for our sample as a whole and for the subsamples of barred, unbarred and merger/paired galaxies separately. The molecular gas concentrations of the galaxies in our sample are also listed in Table 4.
We have also compared our with those of Bolatto et al. (2017), and find the two to agree well, with no systematic differences. The mean absolute differences in are 1.6″ and 1.8″ for the two methods adopted in our case, comparable to the 1″ pixel size. In Sheth et al. (2005) the total H2 masses were obtained from single-dish CO measurements, while the nuclear H2 mass were obtained from spatially resolved CO maps. We do not have single-dish CO data, but, as discussed in Bolatto et al. (2017), the total flux in the CARMA EDGE maps matches well with expectations based on single-dish CO calibrations from Saintonge et al. (2011). We have also investigated the potential impact of a central drop in the CO-to-H2 conversion factor in our analysis, and find that the change in is negligible.
In Table 1 we show the mean and error on the mean of for barred, unbarred, and merger/pair galaxies. We have calculated these quantities for all galaxies in each category, and the upturn/non-upturn galaxies separately. Galaxies with an upturn (barred or merger/pair) have significantly higher concentrations than unbarred galaxies. Barred galaxies without an upturn have significantly lower concentrations than all other categories. Interestingly, merger/pair galaxies without an upturn have relatively high gas concentrations, which are consistent on average with those with an upturn. These results show that, in order to have an upturn, it is not enough to be a merger/pair with high molecular gas concentration.
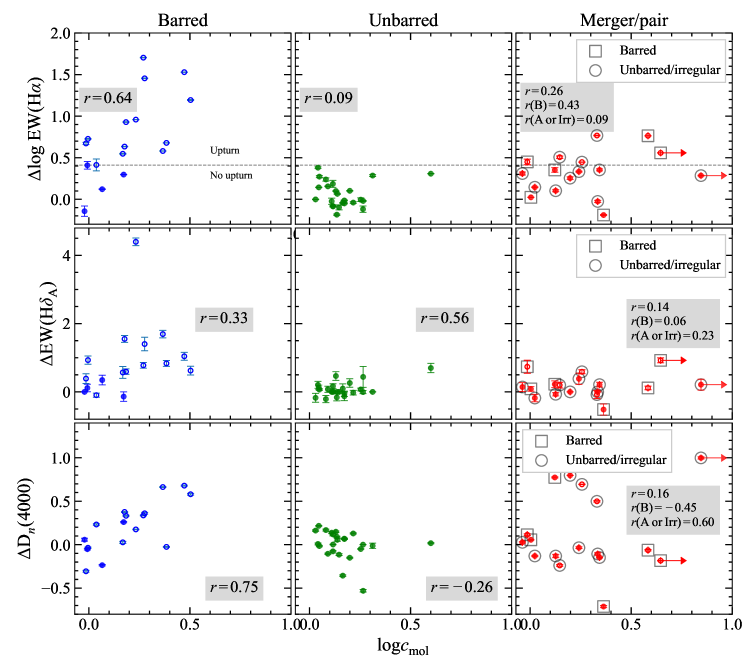
In Figure 7 we examine the correlation of central star formation enhancement with molecular gas concentration, by showing the EW(H) (first row), EW(HA) (second row), and Dn(4000) (third row) as a function of for the three main categories (barred, unbarred, and merger/pairs). The Pearson correlation coefficients shown in Fig. 7 show that the strongest correlations are between EW(H) and for barred galaxies, and between Dn(4000) and for barred galaxies. There also appears to be some correlation between EW(HA) and for unbarred galaxies. There does not appear to be a significant correlation between upturn strength and concentration in other panels. The lack of correlation between central SF enhancement and in merger/pair galaxies may be suggesting that the enhancement may be episodic. It is interesting that there are some merger/pair galaxies with significant enhancements in Dn(4000) but not in EW(HA) or EW(H) and with relatively low gas concentrations.
Here we briefly remark on why we did not measure a concentration index like for the SFH indicators. The gas concentration is a proxy for how much gas has been transported inwards. Generally, the gas radial profiles are either flat or with a central peak. This could possibly be due to the lower resolution of the CO data. The case for the SFH indicators is more complex – there are cases where there is clearly a central peak/drop in SFH indicators, but this is sometimes a local peak or drop. A concentration index is sensitive to where most of the gas or SF is happening, and would not pick out a central peak if it is a local one. This problem could be alleviated by calculating a concentration within the inner region only, however this would require a by-eye estimation of the radius of the inner regions since we have not performed photometric decomposition. This is why we decided to measure upturn strengths on the central region specifically.
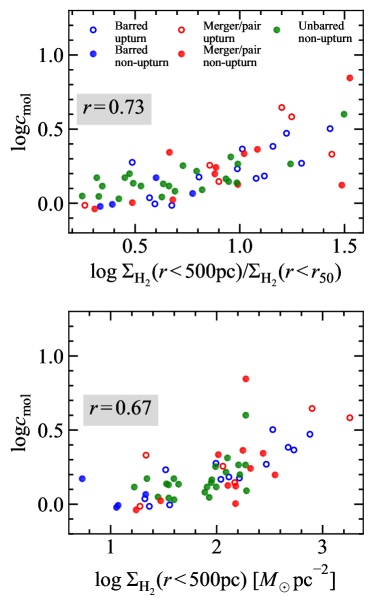
Now we assess whether such correlations may be due to our particular definition of molecular gas concentration. The top panel of Figure 8 shows the comparison between our concentration parameter and an alternative definition from Sheth et al. (2005), namely in the central kiloparsec divided by the total . In their analysis, the total was obtained from single-dish CO measurements, whereas we measure it from the CARMA CO maps. Specifically, we measure the total H2 mass within and divide by the area of the corresponding ellipse. The Pearson correlation coefficient between these quantities is 0.73, indicating a good correlation. Thus, if we were to use this alternative concentration in our analysis, our results would not change significantly. The lower panel of Fig. 8 shows our concentration versus calculated in the central kpc (500 pc radius). Again, the correlation coefficient of 0.67 suggests a significant correlation, and our results would also not change significantly if we were to use in the central kpc in place of .
We do not find significant correlations between and parameters which quantify the global properties of a galaxy, namely global stellar mass (from the NSA; ), NUV colour (from the NSA; ), optical concentration (, from the NSA; ), H2 mass fraction (; ), or H i mass fraction using H i measurements from the ALFALFA 100% catalog (Haynes et al., 2018) or the HyperLeda database (Makarov et al., 2014) (). We find a slight correlation between and H2-to-H i mass ratio (). In a sense, this quantity is also a gas concentration, because it is a measure of the gas mass in a small area (H2 tends to be more centrally concentrated) divided by the gas mass in a large region (H i is known to have a larger spatial extent than H2), so this tentative correlation is not surprising. These results indicate that the gas concentration is indeed caused by bars or mergers, an effect which is independent of galaxy mass, global color or light concentration.
| Upturn? a | b | c | d | e | f | |||
|---|---|---|---|---|---|---|---|---|
| (Y/N) | pc | yr-1kpc | (yr) | (dex) | ||||
| Center | Disk | Center | Disk | Center | Disk | |||
| Barred | ||||||||
| Y | 10 | |||||||
| N | 1 | |||||||
| Unbarred | ||||||||
| Y | 0 | |||||||
| N | 13 | |||||||
| Merger/pair | ||||||||
| Y | 2 | |||||||
| N | 5 | |||||||
| Note: a Galactic was assumed, and a 10% calibration uncertainty is included in both and . | ||||||||
| Here, “center” refers to pc, and “disk” refers to pc . | ||||||||
| a Galaxies which have an upturn in EW(H) or not. | ||||||||
| b Number of galaxies in category. | ||||||||
| c Mean and uncertainty on the mean of in the center and disk. | ||||||||
| d Mean and uncertainty on the mean of in the center and disk. | ||||||||
| e Mean and uncertainty on the mean of (Eq. 4) in the center and disk. | ||||||||
| f Mean and uncertainty on the mean of the center-to-disk depletion time ratio. | ||||||||
3.3 Linking central star formation enhancement with molecular gas mass profiles
For another perspective, rather than comparing the relative enhancement in star formation history indicators between barred/unbarred and merger/pair categories, here we compare the absolute values of and in these categories. For this analysis we have used the reduced sample (31 galaxies) described in §2.2. Figure 9 shows and for barred (left), unbarred (middle), and merger/pair galaxies (right). For each galaxy we show the means and uncertainties of these surface densities, calculated in the central kpc (500 pc radius, shown as the coloured symbols) and in the disk (, triangles). The uncertainties include measurement errors as well as a 10% calibration uncertainty in each quantity. A Galactic was used for all points.
We use these measurements to compute molecular gas depletion times
| (4) |
where (where the factor of 1.36 accounts for the presence of helium). We have measured the mean and uncertainty on the mean of , , , and , all of which are shown in Table 2. The measurements for each galaxy are given in Table 4. Table 2 shows that barred galaxies with an upturn have a slight drop in depletion time in their centers compared to their disks, while unbarred galaxies have a slight central rise in depletion time. Although in the central kpc may be lower by a factor of 2 (Sandstrom et al., 2013), this would shift all lower by 0.3 dex, without changing their uncertainties. This would turn the central rise in for unbarred galaxies into a slight drop, but would turn the drop for barred galaxies into an even larger drop. However, the relative value of these quantities between the barred, unbarred and merger/pair categories should not be affected by such variations in .
We would like to emphasize that due to the small number statistics here, we do not interpret these findings as strong evidence. The best statistical comparison we can make is between barred upturn galaxies and unbarred galaxies – we find is lower in barred upturn galaxies than unbarred galaxies by dex. Merger/pair galaxies do not show a statistically significant increase or decrease in depletion times in their centers on average, but from Fig. 9, one can see that some of these galaxies have , while others have .
These results are similar to those of Utomo et al. (2017), who found for barred and interacting galaxies to be dex and dex respectively. They found this ratio to be dex for unbarred galaxies. Those authors used a slightly different definition of “center” and “disk,” which may be the reason for an offset between our ratios and theirs, however the relative difference between barred, unbarred and interacting is similar to what we find.
4 Comparison to an -body simulation
4.1 Observations
To understand our results better, our observational results are compared to high-resolution -body hydrodynamic simulations. Given the large diversity of properties of our observed barred galaxies (properties of the disc, the bulge(s), the bar as well as of the spirals and rings that the latter may drive, etc.) it is clearly well beyond the scope of this paper to attempt truly quantitative comparisons. We will thus restrain ourselves here to qualitative comparisons and to generic properties.
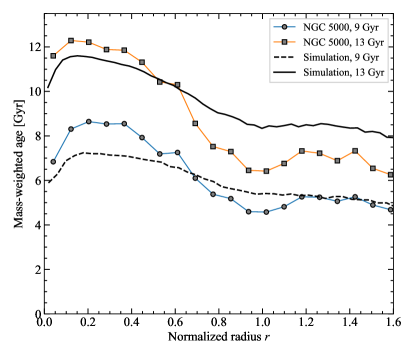
We selected NGC 5000 (Fig. 10) as a random galaxy from our sample, using only the rough morphological constraints that the chosen galaxy should have a strong bar, a clear inner ring, and that it be viewed nearly face-on. We then calculated the mass-weighted average age of the stellar population for each IFU spaxel by fitting the corresponding spectrum with a linear combination of simple stellar populations (SSP) of different ages. Then, using simple azimuthal averages, we obtained the corresponding radial age profile (Fig. 11). For such fits it is customary to include populations considerably older than the Universe, e.g. up to 18 Gyr, or even more (González Delgado et al., 2015; Scott et al., 2017; Ge et al., 2018, etc.) in order to ensure completeness of templates. Since we want to compare with -body simulations following the formation of discs and of their bars, we limited the age range of our SSPs to 13 Gyr.
4.2 Simulations
One of us (EA) has run a number of high resolution -body hydro-dynamic simulations, including star formation, feedback, and cooling. They follow the formation of a disc and of its components, such as the bar, B/P bulge, lens, spirals, rings etc. We give a very short summary of the simulations here; readers who want more information should refer to Athanassoula et al. (2016, hereafter A16) and Rodionov et al. (2017).
The simulations were run using a code based on Gadget3 (Springel & Hernquist, 2002, 2003; Springel et al., 2005), with only a few modifications (A16 and references therein). The initial conditions and the way they were built are also described in that paper. This simulation survey includes galaxies formed and evolved in isolation, as well as galaxies formed from the merging of an isolated pair of protogalaxies, with the merging occurring early on in the run. Compared to most other dynamical simulations, where the disc is already in place and fully developed in the initial conditions of the simulation, they have the big advantage of not starting off with a pre-fabricated disc component, which might unwittingly introduce a bias. Indeed, they start off as single spheroid, composed of dark matter and hot gas, or as a pair of such spheroids. The dark matter is described by 2.2 million collisionless particles and the hot gas by 1.25 million smoothed particle hydrodynamics (SPH) particles. The linear resolution is equal to 50 pc for the dark matter and 25 pc for the baryonic particles.
During the evolution, the gas cools by radiation and accretes onto a plane perpendicular to the initial halo spin axis, thus forming a gaseous disc which, via star formation, becomes partly stellar. This disc forms inside-out, growing with time in radial extent while its gas-to-total-baryonic mass ratio decreases (A16), in good agreement with observations of galaxies at higher and lower redshifts. A stellar bar starts forming and evolves at the same time as the disc.
The various simulations we had at our disposal, as well as most other simulations in the literature, were run for a time span of at most 10 Gyr. Since our goal is to compare the radial age profile of our simulations with that derived from SSP fits to the CALIFA data of NGC 5000, we continued our run to 13 Gyr. We will hereafter call Gyr the final time of the simulation.
4.3 Morphology
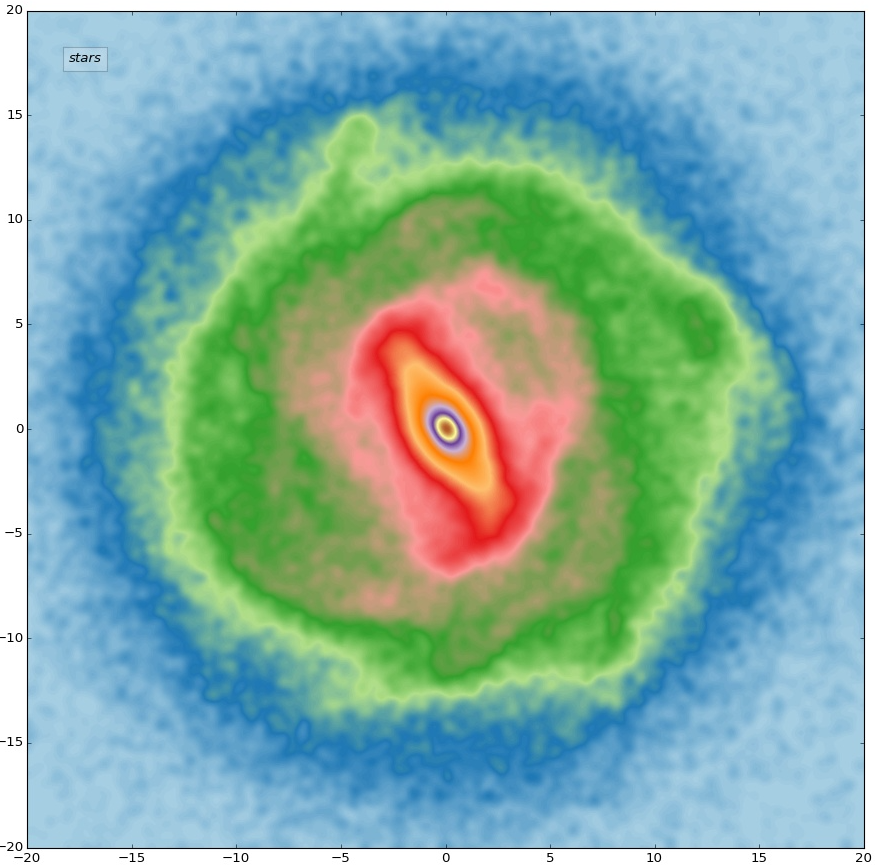
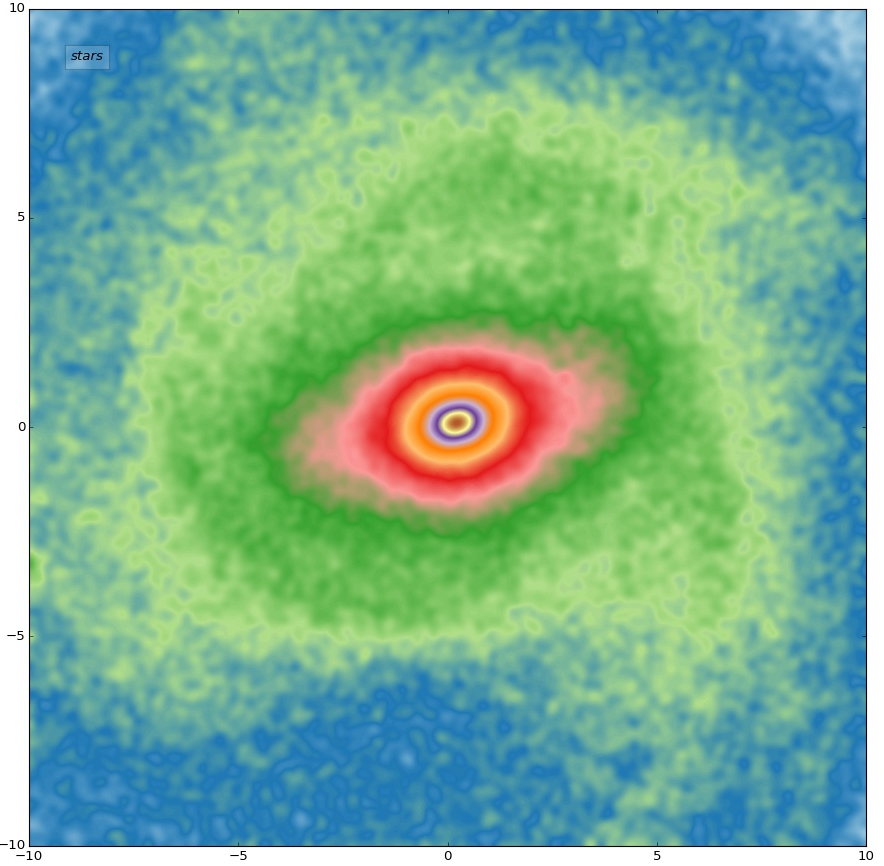
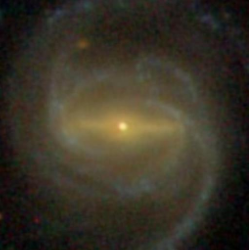
None of the simulations at our disposal reproduce well all the morphological features of NGC 5000. Many had a partial success, i.e. reproduced well some features but never all. This is no surprise, given the very large variety of disc galaxy properties. Thus the probability of having a simulation which will reproduce a given observed galaxy is very small, unless we run a large number of simulations specifically for this task, which is well beyond the scope of this paper. Fig. 11 shows that the maximum value of the radial age profile for NGC 5000 is around 12.5 Gyr. To reach such ages, we thus need to constrain our comparisons to times as near the final time as possible and certainly above 12.5 Gyr. This sets very strong restrictions to our choice.
We chose a snapshot in the same way as we had chosen NGC 5000, i.e. a snapshot which has a bar and an inner structure such as a lens or inner ring (Fig. 10). It has a clear bar; however, compared to the observations, the simulated bar is less thin, and thus is presumably not as strong. Both the real and the simulated bar are surrounded by a component which is fatter in the equatorial plane. In the real galaxy, however, this component is more ring-like, while in the simulated one it is more lens-like. This relatively minor difference will have some influence on the shapes of the age radial profiles. Outside this structure the observations show a grand design two-armed spiral structure. This exists also in the stellar component of the simulation, but has a much lower amplitude. This difference must be due to the fact that we are looking at times as late as 13 Gyr, so that the bar and, albeit to a lesser extent, the spirals have had ample time to stir up the stars in the region outside the ring and to increase their velocity dispersion considerably, so that no high amplitude spirals can be driven (for a review, see Athanassoula, 1984). This could also explain the difference of the bar shape, because horizontally thinner bars can be found in discs with lower velocity dispersions than thicker bars (Athanassoula, 1983, 2003, 2018; Bekki & Tsujimoto, 2011; Athanassoula et al., 2016; Fragkoudi et al., 2017).
As this comparison is not very satisfactory, most likely due to the late comparison time, we decided to look also at earlier times. We found a much better resemblance between the observed and simulated morphologies. For example, at a time of 9 Gyr (left panel), we find a much thinner bar (although still not as thin as that of NGC 5000), the outline of a partial inner ring (rather than a lens-like enhancement) and much clearer outer spirals. We thus decided to include this time also in the comparisons, even though this excluded stars older than 9 Gyr from the comparisons, i.e. has a worse completeness of SSP templates.
4.4 Age radial profile
In order to compare the two pairs of azimuthally-averaged radial age profiles, we need to calibrate the radii for the data and the simulation. The best calibration is by using physically-motivated lengths, as bars can have considerably different lengths in kpc in the two cases. A good candidate is the radius of one of the main resonances, and the one that is easiest to measure is the corotation or the inner ultra-harmonic resonance. This is one of the reasons we chose a galaxy with a clear inner ring (corresponding to the deepest age minimum), as in that case the radius of the ring can be used as a measuring rod. An inner ring is also easily observed as it is the locus of intense star formation and thus can be seen as a clear minimum in any azimuthally averaged age profile.
We calculated the azimuthally-averaged age radial profile from the simulation both at 9 and 13 Gyr, and we compare them in Fig. 11 with two age radial profiles of NGC 5000, calculated with maximum SSP ages of 9 and 13 Gyr. Given that the simulation we use was not specifically run to match NGC 5000, that there are considerable morphological differences between the simulations and observations, and that there are no free parameters to improve the match, we could have expected a very poor fit. Our results, however, are good qualitatively and even acceptable quantitatively.
Over the full radial range used in Fig. 11, the average difference between the simulation and the SSP fitted observations is considerably smaller for 9 Gyr than for 13 Gyr (0.625 Gyr for the former, compared to 1.127 Gyr for 13 Gyr). Considering separately the part of the disc within a normalised radius of 0.6 and the part beyond that radius, we see that the 13 Gyr model fits better in the former (0.56 Gyr average absolute difference for 13 Gyr, compared to 1.08 for 9 Gyr), while the 9 Gyr model fits better in the region beyond the radius of 0.6 (0.37 Gyr average absolute difference, compared to 1.43 for the 13 Gyr model). If we compare the values of the maximum age in the profile, which are in all cases located in the inner part, the difference between simulations and SSP fits is around 6% for the 13 Gyr case, which is quite good, and better than 20% for the 9 Gyr case, which is acceptable given the differences between morphologies of the simulation and NGC 5000. What is most interesting, however, is that we can see a few generic features, present for both times and for the observations as well as the simulations. Two are most important, namely that the profile has a central dip, and that beyond that dip the age decreases with increasing distance from the centre.
In the central part of all four profiles there is a clear age minimum of relatively small radial extent. The size of this minimum shows a good agreement between observations and simulations. With the help of the simulation used here (but see also previous simulations, e.g. Athanassoula, 1992b) it is easy to see how this minimum is formed, as the bar exerts torques on the gas and pushes it inwards. Thus, the gas concentrates in a small central area, where it reaches very high densities. Athanassoula (1992a) showed that the radius of this area is set by the Inner Lindblad Resonance (ILR) radius (i.e. by the extent of the x2 orbits). This radius is more extended for slower rotating bars and for more centrally concentrated mass distributions (see Fig. 6 and 7 in the above mentioned paper). Due to its high gaseous density, this central region will thus be the locus of high star formation, and therefore the mean stellar age in there will be considerably lower than that of the region immediately surrounding it. The observations also show the same central minimum in age and thus the simulations give a good qualitative representation of this feature and allow us to explain its formation and properties.
We have examined the mean stellar age profile for all the galaxies in our observational sample, and find that a central drop is similarly seen in many (but not all) of the barred galaxies, while unbarred galaxies basically show little or no such central features. We similarly examined about half a dozen simulations and found similar results and also could witness the formation of this dip with time. Extensive comparisons with simulations covering a broader spectrum of different galactic types would be able to provide better constraints on models of bar formation and a better understanding of bar-driven secular evolution of galaxies.
Beyond this innermost region, up to one normalised length unit (i.e. roughly up to the end of the bar) the mean age decreases with increasing distance from the centre for both simulated and observed radial profiles. In the simulation, the disc forms inside-out, in good agreement with many observations, and this leads to a negative age gradient. Furthermore, any gas in this region will be pushed inwards by the bar to the region within the ILR and therefore only few new stars will be born, so that any stellar profile at formation will not be modified much at later times.
We also note that the slope of this radial density profile beyond the central dip is not constant with distance from the centre. In the region between the maximum age to about half the bar length, the profile is rather flat. For larger radii, however, the decrease is much stronger, until a minimum age is reached. This behaviour is very clear in the profile from the CALIFA data, both for 9 and 13 Gyr cases. It is also present for the simulation age profile, although less dramatic. The extent of the two parts, i.e the flatter and the steeper decreasing parts, is also in rather good agreement between observations and simulations.
At the end of this radial range where the age is decreasing, we have a minimum. Again this is much clearer in the profiles obtained from observations, but it can also be seen well in the 13 Gyr simulation profile and, more as a change of slope, for the 9 Gyr one. This difference between observations and simulations is due to a difference in the corresponding morphologies (Fig. 11). Namely in NGC 5000 the bar is surrounded by an inner ring, i.e. a structure which is usually gas-rich and a locus of intense star formation (for a review, see Buta & Combes, 1996). We thus expect a concentration of young stars and a minimum in the radial age profile. Such inner rings can be seen in a number of other simulations run by one of us (EA) and have the expected properties. However the simulation snapshots analysed here have a clear inner ring only in the gas and young populations (not shown here), but not in the older populations where it has a more lens-like component. Thus there should be less star formation in the simulation and the mean age at these radii should not be much decreased with respect to their surroundings.
5 Discussion
5.1 How often do we see a central star formation enhancement?
Our sample consists of 58 nearby galaxies, including 41 isolated galaxies with regular morphologies (17 barred and 24 unbarred), and 17 mergers or paired galaxies. A third of all the galaxies (19/58) in our sample present a significant central upturn in EW(H), including 13 barred isolated galaxies and 6 mergers/pairs. This is a large fraction compared to expectations from the traditional view that spiral galaxies host redder and older galactic centers with less star formation than their outer discs. This result echoes a similar fraction of “turnover” galaxies found in Lin et al. (2017), where 17 out of 57 galaxies were identified as having a central turnover in Dn(4000). We note, however, that Lin et al. (2017) excluded mergers/pairs from their sample. If mergers and pairs are also excluded from our sample, the fraction of upturn galaxies remains similar though slightly higher, 31.7% (13/41).
As discussed in Lin et al. (2017), almost all of the galaxies with a central drop in Dn(4000) present central upturn features in both EW(HA) and EW(H). Therefore, a higher upturn fraction in our sample should not be attributed to the fact that Lin et al. (2017) used Dn(4000) as the nominal definition of enhanced central star formation rather than EW(H). As pointed out above, by selection the EDGE-CALIFA sample is biased to gas-rich galaxies. Therefore, a higher fraction of upturn galaxies in our sample might imply that the central star formation enhancement happens more frequently in galaxies with more cold gas. As pointed out earlier (§2.2), our sample is limited to relatively high-mass galaxies with few below (see Fig. 1). Therefore, one might expect the upturn galaxy fraction to increase if the sample includes galaxies of lower masses which are more gas-rich.
It is thus natural to conclude that the central star formation enhancement occurs commonly in local galaxies, with a fraction of at least 1/3. The central upturn or turnover in the spectral indices can be observed only when spatially resolved spectroscopy like IFU data is available. Multi-band imaging should be also useful, and probably more applicable, if one were to study such central features for larger samples. In this case color indices can be used as reasonably good indicators of recent star formation history, although they suffer from dust extinction more seriously than spectral indices. We predict that a large fraction of galaxies must present a central drop in their color maps or profiles, an effect that can be tested with existing/future large-area imaging surveys at different redshifts.
5.2 Can bars and mergers together fully account for the central star formation enhancement?
The fact that all galaxies in our sample with a central upturn in EW(H) are either barred, mergers, or pairs, and that no unbarred galaxies (24) present an upturn feature strongly suggests that bars, mergers and pairs fully account for the central star formation enhancement occurring in our sample. On the other hand, 4 of the 17 barred galaxies and 11 of the 17 mergers/pairs present no upturn features in their centers. This result suggests that the presence of a bar or tidal interactions is necessary, but not a sufficient condition for the central star formation enhancement, in agreement with the conclusions of Lin et al. (2017).
Our work extends their findings by including mergers and paired galaxies in the analysis. Bars and mergers appear to respectively account for 2/3 and 1/3 of the central upturn phenomenon. Previous studies of large samples from SDSS have examined the correlation of central star formation with both galaxy-galaxy interactions (e.g. Li et al., 2008) and the internal bar structure (e.g. Wang et al., 2012). Li et al. (2008) found % of the most strongly star-forming galaxies in the local Universe have a close companion, while Wang et al. (2012) found that only half of the galaxies with centrally enhanced star formation host a bar. The two studies combine to suggest that bars and interactions can roughly account for the central star formation enhancement occurring in low-redshift galaxies. It is encouraging that the same conclusion is reached by both the SDSS-based studies of large samples, i.e. Li et al. (2008) and Wang et al. (2012) which used single-fiber spectroscopy, the work of Lin et al. (2017), and the current work which uses integral field spectroscopy.
In addition to instabilities driven by bars and tidal interactions, other mechanisms may be invoked, such as driving by spirals or asymmetries, although presumably these may be much less efficient. A common purpose of all these mechanisms is to transport cold gas from the disk to the central kiloparsec, where star formation is triggered due to increased gas density. In this work we have shown that molecular gas is indeed more concentrated when central star formation enhancement is observed (Fig. 7). More importantly, our work shows that the star formation enhancement can be substantially explained by bars and mergers, with no need to have additional mechanisms. Again, however, we should emphasize that our sample is biased to relatively high-mass and gas-rich galaxies. Larger samples covering wider ranges of mass and color would be needed if one were to have a complete picture of the physical mechanisms behind the central star formation enhancement.
5.3 Bar-driven central SF enhancement as a long-lived effect
Our results suggest that bar-induced central star formation is a long-term process lasting at least 1-2 Gyr. This can be seen from both Fig. 4 and Fig. 7, where barred galaxies with a central upturn in EW(H) also show a central upturn in EW(HA) and a central drop in Dn(4000). We know that a central drop in Dn(4000) indicates that a considerable fraction of young stellar populations were formed in the central region 1-2 Gyr ago, a central upturn in EW(HA) reveals the existence of a starburst ending 0.1-1 Gyr ago, and a central upturn in EW(H) indicates ongoing star formation. Therefore, the fact that both a Dn(4000) drop and an EW(HA) upturn are associated with barred, EW(H)-upturn galaxies implies that the central star formation induced by the bar started at least 1-2 Gyr ago, and is still happening at the moment.
Krumholz & Kruijssen (2015) showed using simulations that the timescale between bar-induced gas accumulation and a subsequent central starburst is only 10-20 Myr, after which the central region needs to accumulate more gas. The three SFH indicators used in the current work cannot tell whether the SF process is continuous or bursty, if the cycle timescale is only 10-20 Myr. What we can say is that there are young stellar populations; some are younger than a few Myr, and some are younger than 1-2 Gyr. We find that the upturn and turnover strengths are correlated for barred galaxies, with correlation coefficients ranging from 0.50 to 0.54, which supports the conclusion that central SF enhancement is long-lived. The correlations are weaker for merger/pair galaxies, and negligible for unbarred galaxies.
5.4 Is high a necessary and sufficient condition for central star formation enhancement?
Our results show that high gas concentration is neither a necessary, nor sufficient condition for enhanced central star formation to occur. This can be seen from both Fig. 4 and Fig. 7. On the one hand, the upturn galaxies (particularly those with a bar) span the full range of , although the majority of them have higher gas concentration than non-upturn galaxies, with in most cases. This result suggests that a highly concentrated gas distribution is an important, but not a necessary condition for the central upturn to occur in our galaxies. On the other hand, we see some galaxies in our sample with high gas concentration but without a central upturn. This result indicates that high gas concentration alone is not sufficient for the central upturn.
It is interesting that all of the galaxies with no central upturn but with high gas concentration are in the category of mergers/pairs, except for one galaxy, NGC7819, which is an unbarred galaxy with (see § A.1 for more discussion on this galaxy). For barred galaxies, we see that all those with present a central upturn in EW(H), with no exception, although a central upturn/turnover in EW(HA) or Dn(4000) is not associated in a few cases. Thus, bars seem to be more efficient than mergers in triggering enhanced star formation in galactic centers, even when cold gas is not highly concentrated. However, star formation may be underestimated in mergers due to high levels of dust extinction. We conclude that high gas concentration is neither necessary, nor sufficient, and that the presence of a bar in most cases or mergers/interactions in other cases appear to be a crucial condition for central star formation enhancement.
6 Conclusions and future work
We have studied the spatially-resolved molecular gas and indicators of recent star-formation history for 58 nearby galaxies using CARMA EDGE CO and CALIFA optical IFU data. We divide our sample of 58 galaxies into three subsamples based on morphology: barred (17), unbarred (24), and mergers/pairs (17). The resolved gas and star formation history data are used to compare these three subsamples. We use the equivalent width of the H emission line EW(H), equivalent width of the H absorption line EW(HA) and the 4000 Å break Dn(4000) to measure the strength of recent star formation in the central region compared to the outer part of the central region (inside the spiral arms). These three parameters allow us to probe the star formation history at three times: 0-30 Myr (EW(H)), 0.1-1 Gyr (EW(HA)), and 1-2 Gyr (Dn(4000)). We measure a molecular gas concentration index defined as the ratio of the optical half-light radius to the molecular gas half-mass radius measured from radial profiles of the publicly available EDGE CO maps.
After comparing the central star formation history and molecular gas concentration for subsamples of barred, unbarred and merging/paired galaxies, we reach the following conclusions:
-
•
Out of the 58 galaxies in our primary sample, 19 show a central upturn in EW(H), of which 13 are barred, none are unbarred, and 6 are mergers/pairs. Galaxies with upturns have higher gas concentrations than barred or unbarred galaxies without upturns (Table 1). Merger/pair galaxies without upturns have average concentrations similar to galaxies with upturns.
-
•
The level of enhanced central star formation is positively correlated with molecular gas concentration for barred galaxies, and in two out of the three SFH indicators. No significant correlations are found for unbarred or merger/pair galaxies (Figure 7).
-
•
Barred galaxies with upturns in EW(H) have significantly higher values of upturn and turnover strengths than merger/pair galaxies with upturns (Table 1). The average gas concentrations are consistent between these two categories. However, barred galaxies with no upturn have significantly lower gas concentrations than merger/pair galaxies with no upturn. These results imply that bars are efficient in enhancing central star formation, which is long-lived (at least 1-2 Gyr).
-
•
Our observational results provide strong support to the current theory of bar formation in which bars form and grow from inside out. Furthermore, they transport cold gas from the disk to the central region, which leads to significant enhancement in star formation. We compared our results with those from a simulation snapshot (§4) and found that the latter successfully reproduce two major features in the azimuthally-averaged radial profiles of mass-weighted age obtained from the data, namely the sharp decrease of stellar age in the galactic center and the gradual decrease of age with increasing distance from center. This qualitative comparison provides evidence for a picture in which cold gas is transported inward due to a bar or tidal driving, which leads to the growth and rejuvenation of the central region.
Some important issues are not yet addressed in the current work, such as the correlation of central upturn strength with bar length and ellipticity (which are commonly used to quantify the strength of a bar), and the distribution of cold gas and star formation indicators along and surrounding the bar. Lin et al. (2017) found a weak correlation between the radius of Dn(4000) turnover and bar length. It would be interesting to examine whether the gas concentration is also somehow correlated with bar properties. Secondly, the merger/pair category may be studied in more detail, e.g. by further splitting the galaxies into subsets according to pair separation and merger status to examine how the central star formation and gas distribution evolve as the interaction/merger proceeds. It would also be interesting to have more detailed analyses of the exceptional galaxies in our sample, as mentioned in the previous subsection. What are the reasons for variations in the barred galaxies? Do different concentrations indicate different stages of bar-driven gas transport? Finally, one may also want to examine the effects of different environments, such as ram-pressure stripping and tidal stripping that occur in/around massive dark halos and can effectively strip hot/cold gas of satellite galaxies. For this purpose our sample is probably too small, and larger samples with both integral field spectroscopy and CO intensity mapping are needed.
From the theoretical side, it is important to make comparisons for different types of galaxies and for models with different bar strengths, gas properties, feedback, star formation, as and dark matter halo properties. In this work we have focused our observational analysis on stellar populations, while ignoring dynamical properties of our galaxies which can be measured from integral field spectroscopy as well. As mentioned above, the radius where the central upturn/turnover occurs may be related to the mass distribution in the innermost region and the pattern speed of the bar (e.g. Athanassoula, 1992b). The latter can be measured by dynamical modelling of the kinematics of stars in the galaxy based on integral field spectroscopy data. Therefore stellar population synthesis and dynamical modelling in combination are expected to provide more powerful constraints on bar formation models.
Acknowledgements
This work is supported by the National Key R&D Program of China (grant Nos. 2018YFA0404502), the National Key Basic Research Program of China (No. 2015CB857004), and the National Science Foundation of China (No. 11233005, 11325314, 11320101002, 11733004). RC acknowledges the support of McMaster University, a Mitacs Globalink Research Award (IT10717), and the China Scholarship Council. EA thanks the CNES for financial support. This work was granted access to the HPC resources of CINES under the allocations 2017-A0020407665 and 2018-A0040407665 attributed by GENCI (Grand Equipement National de Calcul Intensif), as well as the HPC resources of Aix-Marseille University financed by the project Equip@Meso (ANR-10-EQPX-29-01) of the program “Investissements d’Avenir” supervised by the Agence Nationale de la Recherche. HJM acknowledges the support from NSF AST-1517528. The research of CDW is supported by grants from the Natural Sciences and Engineering Research Council of Canada and the Canada Research Chairs program. LL was supported by the National Science Foundation of China (No. 11703063).
This study uses data provided by the CARMA Extragalactic Database for Galaxy Evolution (EDGE) survey (http://www.astro.umd.edu/EDGE/), the Calar Alto Legacy Integral Field Area (CALIFA) survey (http://califa.caha.es/), the NASA-Sloan Atlas (http://www.nsatlas.org/), the Sloan Digital Sky Survey (https://www.sdss.org/), the HyperLeda database (http://leda.univ-lyon1.fr), and the SIMBAD database, operated at CDS, Strasbourg, France. CALIFA is based on observations collected at the Centro Astronómico Hispano Alemán (CAHA) at Calar Alto, operated jointly by the Max-Planck-Institut für Astronomie and the Instituto de Astrofísica de Andalucía (CSIC).
References
- Athanassoula (1983) Athanassoula E., 1983, in Athanassoula E., ed., IAU Symposium Vol. 100, Internal Kinematics and Dynamics of Galaxies. pp 243–250
- Athanassoula (1984) Athanassoula E., 1984, Phys. Rep., 114, 321
- Athanassoula (1992a) Athanassoula E., 1992a, MNRAS, 259, 328
- Athanassoula (1992b) Athanassoula E., 1992b, MNRAS, 259, 345
- Athanassoula (1994) Athanassoula E., 1994, in Shlosman I., ed., Mass-Transfer Induced Activity in Galaxies. p. 143
- Athanassoula (2003) Athanassoula E., 2003, MNRAS, 341, 1179
- Athanassoula (2005) Athanassoula E., 2005, MNRAS, 358, 1477
- Athanassoula (2018) Athanassoula E., 2018, in Chiappini C., Minchev I., Starkenburg E., Valentini M., eds, IAU Symposium Vol. 334, Rediscovering Our Galaxy. pp 65–72 (arXiv:1801.07720), doi:10.1017/S1743921317008778
- Athanassoula et al. (2013) Athanassoula E., Machado R. E. G., Rodionov S. A., 2013, MNRAS, 429, 1949
- Athanassoula et al. (2016) Athanassoula E., Rodionov S. A., Peschken N., Lambert J. C., 2016, ApJ, 821, 90
- Baldwin et al. (1981) Baldwin J. A., Phillips M. M., Terlevich R., 1981, PASP, 93, 5
- Barnes & Hernquist (1991) Barnes J. E., Hernquist L. E., 1991, ApJ, 370, L65
- Barton Gillespie et al. (2003) Barton Gillespie E., Geller M. J., Kenyon S. J., 2003, ApJ, 582, 668
- Bekki & Tsujimoto (2011) Bekki K., Tsujimoto T., 2011, MNRAS, 416, L60
- Bigiel et al. (2008) Bigiel F., Leroy A., Walter F., Brinks E., de Blok W. J. G., Madore B., Thornley M. D., 2008, AJ, 136, 2846
- Blanton & Roweis (2007) Blanton M. R., Roweis S., 2007, AJ, 133, 734
- Blanton et al. (2005a) Blanton M. R., et al., 2005a, AJ, 129, 2562
- Blanton et al. (2005b) Blanton M. R., Eisenstein D., Hogg D. W., Schlegel D. J., Brinkmann J., 2005b, ApJ, 629, 143
- Blanton et al. (2011) Blanton M. R., Kazin E., Muna D., Weaver B. A., Price-Whelan A., 2011, AJ, 142, 31
- Blanton et al. (2017) Blanton M. R., et al., 2017, AJ, 154, 28
- Bock et al. (2006) Bock D. C.-J., et al., 2006, in Society of Photo-Optical Instrumentation Engineers (SPIE) Conference Series. p. 626713, doi:10.1117/12.674051
- Bolatto et al. (2013) Bolatto A. D., Wolfire M., Leroy A. K., 2013, ARA&A, 51, 207
- Bolatto et al. (2017) Bolatto A. D., et al., 2017, ApJ, 846, 159
- Bruzual & Charlot (2003) Bruzual G., Charlot S., 2003, MNRAS, 344, 1000
- Bundy et al. (2015) Bundy K., et al., 2015, ApJ, 798, 7
- Buta & Combes (1996) Buta R., Combes F., 1996, Fundamentals Cosmic Phys., 17, 95
- Calzetti et al. (2000) Calzetti D., Armus L., Bohlin R. C., Kinney A. L., Koornneef J., Storchi-Bergmann T., 2000, ApJ, 533, 682
- Cappellari (2017) Cappellari M., 2017, MNRAS, 466, 798
- Cappellari & Emsellem (2004) Cappellari M., Emsellem E., 2004, PASP, 116, 138
- Catinella et al. (2018) Catinella B., et al., 2018, MNRAS,
- Croom et al. (2012) Croom S. M., et al., 2012, MNRAS, 421, 872
- Devereux (1987) Devereux N., 1987, ApJ, 323, 91
- Ellison et al. (2011) Ellison S. L., Nair P., Patton D. R., Scudder J. M., Mendel J. T., Simard L., 2011, MNRAS, 416, 2182
- Ellison et al. (2013) Ellison S. L., Mendel J. T., Patton D. R., Scudder J. M., 2013, MNRAS, 435, 3627
- Fragkoudi et al. (2017) Fragkoudi F., Di Matteo P., Haywood M., Gómez A., Combes F., Katz D., Semelin B., 2017, A&A, 606, A47
- Ge et al. (2018) Ge J., Yan R., Cappellari M., Mao S., Li H., Lu Y., 2018, MNRAS, 478, 2633
- González Delgado et al. (2015) González Delgado R. M., et al., 2015, A&A, 581, A103
- Hao et al. (2011) Hao C.-N., Kennicutt R. C., Johnson B. D., Calzetti D., Dale D. A., Moustakas J., 2011, ApJ, 741, 124
- Hawarden et al. (1986) Hawarden T. G., Mountain C. M., Leggett S. K., Puxley P. J., 1986, MNRAS, 221, 41P
- Haynes et al. (2018) Haynes M. P., et al., 2018, ApJ, 861, 49
- Ho et al. (1997) Ho L. C., Filippenko A. V., Sargent W. L. W., 1997, ApJ, 487, 591
- Jiang et al. (2015) Jiang X.-J., Wang Z., Gu Q., Wang J., Zhang Z.-Y., 2015, ApJ, 799, 92
- Jogee et al. (2005) Jogee S., Scoville N., Kenney J. D. P., 2005, ApJ, 630, 837
- Kaneko et al. (2013) Kaneko H., Kuno N., Iono D., Tamura Y., Tosaki T., Nakanishi K., Sawada T., 2013, PASJ, 65, 20
- Karachentsev (1972) Karachentsev I. D., 1972, Soobshcheniya Spetsial’noj Astrofizicheskoj Observatorii, 7
- Kauffmann et al. (2003a) Kauffmann G., et al., 2003a, MNRAS, 341, 33
- Kauffmann et al. (2003b) Kauffmann G., et al., 2003b, MNRAS, 341, 54
- Kauffmann et al. (2003c) Kauffmann G., et al., 2003c, MNRAS, 346, 1055
- Kelz et al. (2006) Kelz A., et al., 2006, PASP, 118, 129
- Kennicutt & Evans (2012) Kennicutt R. C., Evans N. J., 2012, ARA&A, 50, 531
- Kennicutt et al. (2007) Kennicutt Jr. R. C., et al., 2007, ApJ, 671, 333
- Kewley et al. (2001) Kewley L. J., Dopita M. A., Sutherland R. S., Heisler C. A., Trevena J., 2001, ApJ, 556, 121
- Kormendy & Kennicutt (2004) Kormendy J., Kennicutt Jr. R. C., 2004, ARA&A, 42, 603
- Kroupa & Weidner (2003) Kroupa P., Weidner C., 2003, ApJ, 598, 1076
- Krumholz & Kruijssen (2015) Krumholz M. R., Kruijssen J. M. D., 2015, MNRAS, 453, 739
- Kuno et al. (2007) Kuno N., et al., 2007, PASJ, 59, 117
- Leroy et al. (2009) Leroy A. K., et al., 2009, AJ, 137, 4670
- Li et al. (2008) Li C., Kauffmann G., Heckman T. M., Jing Y. P., White S. D. M., 2008, MNRAS, 385, 1903
- Li et al. (2015) Li C., et al., 2015, ApJ, 804, 125
- Lin et al. (2014) Lin Y., Cervantes Sodi B., Li C., Wang L., Wang E., 2014, ApJ, 796, 98
- Lin et al. (2017) Lin L., Li C., He Y., Xiao T., Wang E., 2017, ApJ, 838, 105
- Makarov et al. (2014) Makarov D., Prugniel P., Terekhova N., Courtois H., Vauglin I., 2014, A&A, 570, A13
- Martig et al. (2009) Martig M., Bournaud F., Teyssier R., Dekel A., 2009, ApJ, 707, 250
- Martin et al. (2005) Martin D. C., et al., 2005, ApJ, 619, L1
- Mok et al. (2017) Mok A., Wilson C. D., Knapen J. H., Sánchez-Gallego J. R., Brinks E., Rosolowsky E., 2017, MNRAS, 467, 4282
- Murphy et al. (2011) Murphy E. J., et al., 2011, ApJ, 737, 67
- Oh et al. (2012) Oh S., Oh K., Yi S. K., 2012, ApJS, 198, 4
- Osterbrock & Ferland (2006) Osterbrock D. E., Ferland G. J., 2006, Astrophysics of gaseous nebulae and active galactic nuclei. University Science Books
- Patton et al. (2013) Patton D. R., Torrey P., Ellison S. L., Mendel J. T., Scudder J. M., 2013, MNRAS, 433, L59
- Piner et al. (1995) Piner B. G., Stone J. M., Teuben P. J., 1995, ApJ, 449, 508
- Planck Collaboration et al. (2016) Planck Collaboration et al., 2016, A&A, 594, A7
- Puxley et al. (1988) Puxley P. J., Hawarden T. G., Mountain C. M., 1988, MNRAS, 234, 29P
- Regan et al. (2006) Regan M. W., et al., 2006, The Astrophysical Journal, 652, 1112
- Rodionov et al. (2017) Rodionov S. A., Athanassoula E., Peschken N., 2017, A&A, 600, A25
- Roth et al. (2005) Roth M. M., et al., 2005, PASP, 117, 620
- Saintonge et al. (2011) Saintonge A., et al., 2011, MNRAS, 415, 61
- Saintonge et al. (2012) Saintonge A., et al., 2012, ApJ, 758, 73
- Saintonge et al. (2017) Saintonge A., et al., 2017, ApJS, 233, 22
- Sakamoto (2000) Sakamoto K., 2000, in Combes F., Mamon G. A., Charmandaris V., eds, Astronomical Society of the Pacific Conference Series Vol. 197, Dynamics of Galaxies: from the Early Universe to the Present. p. 73 (arXiv:astro-ph/9910226)
- Sakamoto et al. (1999) Sakamoto K., Okumura S. K., Ishizuki S., Scoville N. Z., 1999, ApJ, 525, 691
- Sánchez et al. (2012) Sánchez S. F., et al., 2012, A&A, 538, A8
- Sánchez et al. (2016) Sánchez S. F., et al., 2016, A&A, 594, A36
- Sandstrom et al. (2013) Sandstrom K. M., et al., 2013, ApJ, 777, 5
- Scott et al. (2017) Scott N., et al., 2017, MNRAS, 472, 2833
- Sheth et al. (2005) Sheth K., Vogel S. N., Regan M. W., Thornley M. D., Teuben P. J., 2005, ApJ, 632, 217
- Sormani et al. (2015) Sormani M. C., Binney J., Magorrian J., 2015, MNRAS, 454, 1818
- Springel & Hernquist (2002) Springel V., Hernquist L., 2002, MNRAS, 333, 649
- Springel & Hernquist (2003) Springel V., Hernquist L., 2003, MNRAS, 339, 289
- Springel et al. (2005) Springel V., Di Matteo T., Hernquist L., 2005, ApJ, 620, L79
- Stark et al. (2013) Stark D. V., Kannappan S. J., Wei L. H., Baker A. J., Leroy A. K., Eckert K. D., Vogel S. N., 2013, ApJ, 769, 82
- Turner (1976) Turner E. L., 1976, ApJ, 208, 20
- Utomo et al. (2017) Utomo D., et al., 2017, ApJ, 849, 26
- Violino et al. (2018) Violino G., Ellison S. L., Sargent M., Coppin K. E. K., Scudder J. M., Mendel T. J., Saintonge A., 2018, MNRAS, 476, 2591
- Vorontsov-Velyaminov et al. (2001) Vorontsov-Velyaminov B. A., Noskova R. I., Arkhipova V. P., 2001, Astronomical and Astrophysical Transactions, 20, 717
- Walcher et al. (2014) Walcher C. J., et al., 2014, A&A, 569, A1
- Walter et al. (2008) Walter F., Brinks E., de Blok W. J. G., Bigiel F., Kennicutt Jr. R. C., Thornley M. D., Leroy A., 2008, AJ, 136, 2563
- Wang et al. (2012) Wang J., et al., 2012, MNRAS, 423, 3486
- Wang et al. (2018) Wang E., et al., 2018, ApJ, 856, 137
- Wenger et al. (2000) Wenger M., et al., 2000, Astronomy and Astrophysics Supplement Series, 143, 9
- Wilson et al. (2012) Wilson C. D., et al., 2012, MNRAS, 424, 3050
- York et al. (2000) York D. G., et al., 2000, AJ, 120, 1579
- Young et al. (1995) Young J. S., et al., 1995, ApJS, 98, 219
- Zhou et al. (2015) Zhou Z.-M., Cao C., Wu H., 2015, AJ, 149, 1
Appendix A Tables of galaxy properties
Table 3 shows basic properties of the galaxies in our sample, and Table 4 shows measurements derived from our analysis.
| Galaxy | No. | R.A. | Dec. | NUV- | Type | |||||
| (J2000) | (J2000) | (mag) | (″) | |||||||
| (1) | (2) | (3) | (4) | (5) | (6) | (7) | (8) | (9) | (10) | (11) |
| Barred | ||||||||||
| IC1683 | 2 | 20.66220 | 34.43713 | 0.016 | 10.4 | 4.1 | 13.1 | 9.2 | 9.5 | Sb |
| Unbarred | ||||||||||
| NGC7819 | 21 | 1.10211 | 31.47201 | 0.017 | 10.1 | 2.6 | 23.8 | 9.6 | 9.2 | Sc |
| Merger/pair | ||||||||||
| NGC0523 | 45 | 21.33649 | 34.02495 | 0.016 | 10.6 | 4.1 | 24.2 | 10.1 | 9.5 | Sd |
| (1): Galaxy name. | ||||||||||
| (3): Right ascension (degrees), from SDSS DR7. | ||||||||||
| (4): Declination (degrees), from SDSS DR7. | ||||||||||
| (5): Raw redshift measured from the CALIFA datacubes. | ||||||||||
| (6): Stellar mass from CALIFA DR3 reanalysis of SDSS DR7 ugriz growth curves (Walcher et al., 2014). | ||||||||||
| (7): NUV magnitude from the NASA-Sloan Atlas (NSA). | ||||||||||
| (8): -band half-light radius from the NSA. | ||||||||||
| (9): Neutral hydrogen mass from ALFALFA 100% catalog (Haynes et al., 2018) where available, or from the HyperLeda database. | ||||||||||
| (10): The total detected H2 mass in the whole CO image. | ||||||||||
| (11): The morphological type (RC3) provided in CALIFA DR3. | ||||||||||
| Galaxy | Upturn? | Dn(4000) | EW(H) | EW(H) | |||||
| Center | Disk | ||||||||
| (Å) | (″) | (yr) | (yr) | ||||||
| (1) | (2) | (3) | (4) | (5) | (6) | (7) | (8) | (9) | (10) |
| Barred | |||||||||
| IC1683 | Y | ||||||||
| Unbarred | |||||||||
| NGC7819 | N | ||||||||
| Merger/pair | |||||||||
| NGC0523 | N | ||||||||
| Note: galaxies that are not in the reduced sample (§2.2) have values of “n/a” in columns 8-10. | |||||||||
| (1): Galaxy name. | |||||||||
| (2): Does this galaxy have an upturn in EW(H)(§3.1)? (Y or N). | |||||||||
| (3): Dn(4000) turnover strength. | |||||||||
| (4): EW(HA) upturn strength. | |||||||||
| (5): EW(H) upturn strength. | |||||||||
| (6): Molecular gas half-mass radius. | |||||||||
| (7): Molecular gas concentration index (Eq. 3). | |||||||||
| (8): Molecular gas depletion time (Eq. 4) in the “center” (0.5 kpc semi-major axis). | |||||||||
| (9): Molecular gas depletion time in the “disk” (between 0.5 kpc and ). | |||||||||
| (10): Center-to-disk depletion time ratio. | |||||||||
A.1 Notes on individual galaxies
Here we mention a few galaxies which show unusual or extreme behaviours based on Figure 7. Their optical images, SFH indicators, molecular gas maps and radial profiles are shown in Fig. 12.
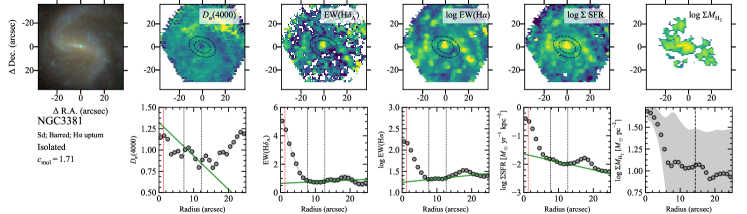

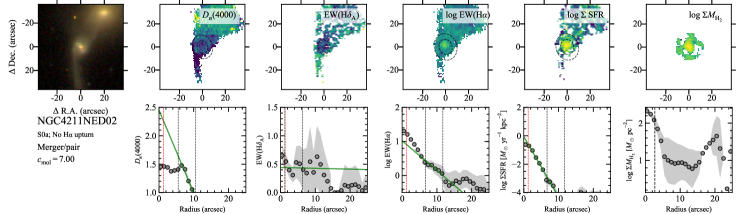
- NGC3381:
-
the barred galaxy with a very high EW(HA) but with only intermediate . This galaxy is blue in colour (NUV , the bluest of all our barred galaxies), and has a low stellar mass (; the lowest of all our barred galaxies). This galaxy has an observed value of EW(HA)Å, the highest in our sample (middle panel of Fig. 3), and is consistent with the definition of a post-starburst galaxy.
- NGC7819:
-
the unbarred galaxy with the highest . With an NUV of 2.1 mag (the bluest of the unbarred galaxies), this galaxy is clearly blue and star-forming. This galaxy has quite a large optical radius (23.8″), and a relatively small . Given this high concentration, why does it not show enhanced central star formation in any of our SFH indicators? With a central of pc-2 and central of yr-1kpc-2, which are not dissimilar from the central values of these quantities in barred upturn galaxies (Fig. 9), it appears that central SFR and H2 surface densities being similar to barred galaxies, and having a high molecular gas concentration are not sufficient conditions for enhanced central star formation. A bar or galaxy interaction appears to be needed too, as discussed above. It would be interesting to study the dense gas in this system – it could be that the gas is not sufficiently dense to form stars without a bar.
- NGC4211NED02:
-
the merger galaxy with the highest but no significant central upturn. This galaxy has NUV of 3.7, and stellar mass of . It is in a close pair with NGC4211A (not in our sample), with a projected separation of approximately 16 kpc. The CO emission for this galaxy is very compact, and since is less than twice the CARMA beam scale, should be considered a lower limit (as indicated in Table 4). This galaxy does not show an upturn, however it shows a significant Dn(4000) turnover (see the bottom-right panel of Fig. 7). The turnover strength for this particular galaxy should be interpreted with caution, because the size of the central region of this galaxy is quite close to the resolution of CALIFA. Although the optical radius of this galaxy is 19″, this is likely due to the irregular morphology. The size of the inner region is much smaller, which makes our fitting less reliable.