-
Citation
D. Temel, J. Lee, and G. AlRegib, “CURE-OR: Challenging unreal and real environments for object recognition,” 2018 17th IEEE International Conference on Machine Learning and Applications (ICMLA), Orlando, Florida, USA, 2018.
- Dataset
-
Bib
@INPROCEEDINGS{Temel2018_ICMLA,
author={D. Temel and J. Lee and G. AlRegib},
booktitle={2018 17th IEEE International Conference on Machine Learning and Applications (ICMLA)},
title={CURE-OR: Challenging unreal and real environments for object recognition}, year=2018,} -
Copyright
©2018 IEEE. Personal use of this material is permitted. Permission from IEEE must be obtained for all other uses, in any current or future media, including reprinting/republishing this material for advertising or promotional purposes, creating new collective works, for resale or redistribution to servers or lists, or reuse of any copyrighted component of this work in other works.
-
Contact
alregib@gatech.edu https://ghassanalregib.com/
dcantemel@gmail.com http://cantemel.com/
CURE-OR: Challenging Unreal and Real Environments for Object Recognition
Abstract
In this paper, we introduce a large-scale, controlled, and multi-platform object recognition dataset denoted as Challenging Unreal and Real Environments for Object Recognition (CURE-OR). In this dataset, there are 1,000,000 images of 100 objects with varying size, color, and texture that are positioned in five different orientations and captured using five devices including a webcam, a DSLR, and three smartphone cameras in real-world (real) and studio (unreal) environments. The controlled challenging conditions include underexposure, overexposure, blur, contrast, dirty lens, image noise, resizing, and loss of color information. We utilize CURE-OR dataset to test recognition APIs—Amazon Rekognition and Microsoft Azure Computer Vision—and show that their performance significantly degrades under challenging conditions. Moreover, we investigate the relationship between object recognition and image quality and show that objective quality algorithms can estimate recognition performance under certain photometric challenging conditions. The dataset is publicly available at https://ghassanalregib.com/cure-or/. ††*Equal contribution
Index Terms:
visual recognition, object recognition dataset, challenging conditions, deep learning, robustnessI Introduction
Recent advancements in algorithms and hardware platforms led to the development of state-of-the-art visual recognition methods that can achieve human-level performance in specific recognition tasks [1, 2]. Traditionally, these state-of-the-art recognition approaches were based on handcrafted features such as SIFT [3], SURF [4] and HoG [5]. However, recent data-driven methods started to outperform handcrafted methods as in the ImageNet Large Scale Visual Recognition Challenge (ILSVRC) [6]. There are numerous datasets similar to ImageNet [7, 8, 9, 10, 11, 12, 6, 13, 14], whose images were obtained through photo sharing platforms and search engines. Even though these datasets can be comprehensive in terms of number of samples per categories, it is not possible to identify the relationship between specific conditions and recognition performance because of their uncontrolled nature. However, challenging conditions can significantly degrade the recognition performance as discussed in Section IV. Therefore, to investigate the robustness of recognition algorithms with respect to challenging conditions, we need to perform controlled experiments that include a comprehensive set of challenging condition types and levels.
Recent studies started investigating the effect of challenging conditions in images in terms of recognition performance [15, 16, 17, 18, 19, 20]. Hosseini et al. [15] evaluated the recognition performance of Google Cloud Vision API under Gaussian and impulse noise and showed that the API is vulnerable to tested challenging conditions. Dodge and Karam [16] evaluated the recognition performance of deep neural networks under blur, noise, contrast, and compression and showed that deep learning-based approaches are susceptible to degradation, particularly to blur and noise. Zhou et al. [17] also studied the effect of blur and noise in deep network-based recognition and showed their vulnerabilities. Similarly, Lu et al. [18] and Das et al. [19] showed the vulnerability of traffic sign recognition and detection systems in case of adversarial examples. Even though these studies shed light on a subset of conditions that can significantly affect algorithmic performance, the investigated challenging conditions are relatively limited. Specifically, aforementioned studies [15, 16, 17, 18, 19] focus on simulated challenging conditions and they overlook the possible imperfections in the acquisition process. Moreover, adversarial examples investigated in [18, 19] are inherently different from realistic challenging scenarios because they are specifically tuned to bias the models. Temel et al. [20] focus on realistic challenging conditions but the application field is limited to traffic signs. Therefore, we need more comprehensive robustness analysis for generic object recognition tasks that considers realistic conditions as well as nonidealities in the acquisition processes.
This paper has three major components: the newly built CURE-OR dataset by which we eliminate the shortcomings of existing datasets; the performance benchmark of object recognition on the new dataset using the recognition APIs Amazon Rekognition and Microsoft Azure Computer Vision; and the investigation of the relationship between object recognition performance and full-reference image quality assessment, which measure the changes with respect to a challenge-free reference image. If we consider ideal conditions as reference conditions and non-ideal conditions as photometric challenging conditions, image quality should decrease under challenging conditions. Based on this assumption related to image quality, we hypothesize that object recognition performance under photometric challenging conditions can be estimated with objective image quality assessment algorithms. Specifically, we focus on photometric challenging conditions including blurriness, dirtiness of lens, contrast, overexposure, undersexposure, and sensor noise. The contributions of this paper are five folds.
-
▪
We introduce the most comprehensive publicly-available object recognition dataset acquired with multiple device types under controlled challenging conditions in real-world and photo studio environments.
-
▪
We provide a detailed description and a comparative study of existing object datasets, which can be used as a source of reference in further studies.
-
▪
We provide a detailed analysis of recognition APIs in terms of recognition performance under challenging conditions.
-
▪
We show that the performance of recognition applications significantly degrades under challenging conditions.
-
▪
We utilize full-reference objective image quality assessment algorithms to estimate the object recognition performance under photometric challenging conditions.
Outline: We briefly discuss existing object datasets in Section II. In Section III, we introduce and describe the CURE-OR dataset. We analyze the performance of recognition APIs under challenging conditions in Section IV, and we investigate the relationship between object recognition performance and objective quality assessment in Section V. Finally, we conclude our work in Section VI.
II Object Datasets
| Release year | Number of images | Resolution | Object classes | Number of images per class | Number of different objects per class | Number of images per same object | Controlled condition (level) | Background | Acquisition | |
|---|---|---|---|---|---|---|---|---|---|---|
| COIL100 | 1996 | 7,200 | 128x128 | household | all images | 100 | 72 | angle (72) | black | CCD cam. |
| SFU | 1998 | all images | 637x468 | household | 110 | 11 | 10 | lighting (5) position (2) | black | CCD cam. |
| SOIL-47 | 2002 | all images | 288x360 and 576x720 | household | 1,974 | 47 | 42 | angle (21) lighting (2) | black | CCD cam. |
| ETHZ Toys | 2004 | 63 | 720x576 | household | all images | 9 | 1-8 | angle (1-8) | black (model) generic (test) | - |
| NORB | 2004 | 194,400 | 640x480 | toys: airp., trucks cars, human fig. four-leg. anim. | 38,880 | 10 | 3,888 | angle (9) azimuth (18) lighting (6) | white textured | 2 CCD cameras |
| CalTech 101 | 2004 | 9,145 | 300x200 | 101 generic | 40-800 | - | - | NA | generic | Online search |
| PASCAL VOC | 2005 | 2,232 | 110x75 to 1,280x960 | motorcycles bicycles people cars | 168-547 | - | - | NA | generic | Online search ETHZ UIUC |
| GRAZ-02 | 2005 | 1,476 | 480x640 640x480 | person, bike cars, counter | 311-420 | - | - | NA | generic | - |
| ALOI | 2005 | 110,250 | 768x576 | small obj. | all images | 1,000 | 100 | angle (72) light. angle (24) light. color (12) | black | 3 CCD cameras |
| LabelME | 2008 | 11,845 pic. 18,524 fram. | high resolution | 4,210 Wordnet categories | up to 27,719 | - | - | NA | generic | Online search |
| Tiny | 2008 | 79,302,017 | 32x32 | 75,062 Wordnet nonabstract nouns | up to 3,000 | - | - | NA | generic | Online search |
| CIFAR10 CIFAR100 | 2009 | 60,000 | 32x32 | 10 subclass of vehic. and anim., 100 subclass of 20 superclass | 6,000, 600 | - | - | NA | generic | Online search |
| ImageNet | 2009 | 3,200,000 | 400x350 (avg.) | 5,247 Wordnet synsets | 600 (avg.) | - | - | NA | generic | Online search |
| BOSS | 2010 | 480 | 2,000x2,000 | household | all images | 480 | 1 | NA | white | - |
| Office | 2010 | 2,817 498 795 | 300x300 1,000x1,000 152x152 to 752x752 | 31 product categ. | 36-100 7-31 11-43 | - 4-6 4-6 | - 1-9 1-14 | NA | studio light office env. office env. | Amazon.com DSLR cam. webcam |
| BigBIRD | 2014 | 150,000 | 1,280x1,024 4,272x2,848 | household | all images | 125 | 1,200 | angle (120) | white | DSLR cam. depth sensors |
| MS-COCO | 2014 | 328,000 | 91 classes incl. PACAL VOC 2011 | 3,600 (avg) | - | - | NA | generic | Online search | |
| iLab-20M | 2016 | 21,798,480 | 960x720 | toys | all images | 704 | 1,320 | angle (8) azimuth (11) focus (3) lighting (5) backgr. (14) | textured backdr. (125), solid color backdr. (7) | webcam (11) |
| CURE-OR | 2018 | 1,000,000 | 648x968 756x1,008 480x640 460x816 726x1,292 | pers. belong. office supply household toy sports/entert. health/pers.care | 100,000- 270,000 | 10-27 | 10,000 | orientation (5) backgr. (5) challenge (79) | white backdr. textured backdr (2), living room office | DSLR cam. webcam phone(x3) |
There are numerous datasets in the literature that can be used to benchmark the performance of object recognition algorithms. We can classify these datasets into two categories as controlled datasets and uncontrolled datasets. In uncontrolled datasets [7, 8, 9, 10, 11, 12, 6, 13, 14], images are commonly acquired through search engines or photo sharing platforms. Uncontrolled datasets are advantageous because it is easier to obtain large-scale datasets that include varying environmental conditions. The variety of images in these uncontrolled datasets enables a large-scale performance assessment of algorithms. However, because of their uncontrolled nature, it is not possible to understand the specific factors that affect recognition performance in these datasets.
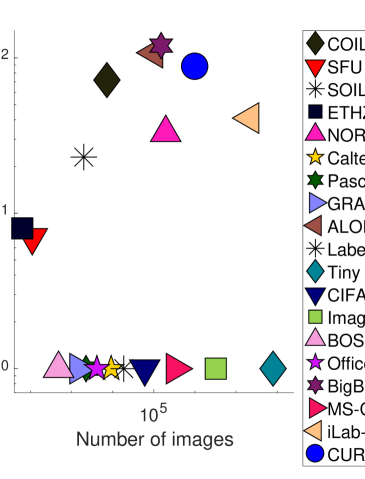
In controlled datasets [21, 22, 23, 24, 25, 26, 27, 28, 29], images are captured in a restricted setup under varying conditions. COIL-100 [21], SFU [22], SOIL-47 [23], and ETHZ Toy [24] datasets contain up to thousands of images, which are limited compared to uncontrolled recognition datasets. On the other hand, ALOI [26], NORB [25], RGB-D [27], and BigBIRD [28] datasets are large-scale but their controlled conditions are limited to relative camera location, rotation, or lighting. Among all aforementioned controlled datasets, iLab-20M [29] is the largest dataset with a variety of acquisition conditions including relative camera location, focus level, scale, and background. In iLab-20M, one type of camera is used in the data acquisition, which makes the study overlook the domain differences that can be caused by acquisition device type as shown in [13]. Moreover, iLab-20M is mainly used to test the invariance of learning-based approaches rather than analyzing factors that can affect the recognition performance, which is not possible to investigate until the data is publicly available. We summarize the main characteristics of existing datasets as well as introduced dataset CURE-OR in Table I and compare these datasets in terms of number of images and annotated controlled conditions in Fig. 2. Because of the significant difference between the number of images in different datasets, we visualize data points in log scale. Ideally, a test dataset should be located on the top right corner so that it will be large-scale in terms of the number of images and annotated challenge types and levels. iLab-20M and CURE-OR are closest to top right with respect to compared datasets.
III CURE-OR Dataset
Objects: CURE-OR dataset includes 100 objects of different color, size, and texture as shown in Fig. CURE-OR: Challenging Unreal and Real Environments for Object Recognition. The objects are grouped into 6 categories as toys, personal belongings, office supplies, household items, sports/entertainment items, and health/personal care items. The number of objects in each category varies between and . For more details, please refer to https://ghassanalregib.com/cure-or/.
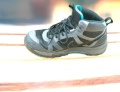
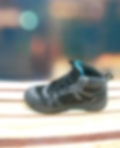
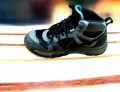
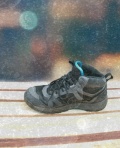
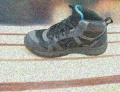
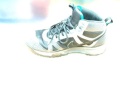
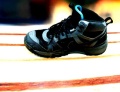
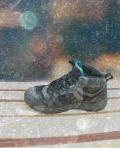
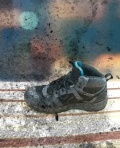
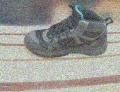
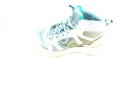
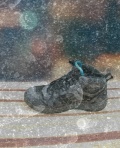
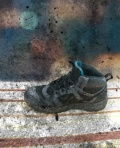
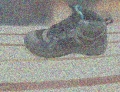
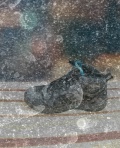
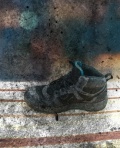
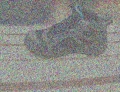
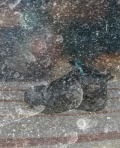
Acquisition setup and image format: The images in CURE-OR were captured with 5 devices including iPhone 6s, HTC One X, LG Leon, Logitech C920 HD Pro Webcam, and Nikon D80, which were mounted on a Vanguard multi-mount horizontal bar attached to a tripod and controlled with wireless remotes. Each device had a slightly different perspective because of their relative locations. Images were captured in real and unreal environments. First, images were captured in a photo studio setup (LITEBOX Pro-240) with a white backdrop and two realistic backdrops of living room and kitchen. Second, images were captured in real-world environments including a living room and an office setup. The sample images of an object in every background are shown in Fig. 3. Objects were captured at 5 different orientations: front, back, top, left-side, and right-side views. Originally, the width and height of captured images vary from to pixels with an average resolution of . These images were scaled down to 1/4 of their original resolution and stored as JPEG to reduce dataset size.
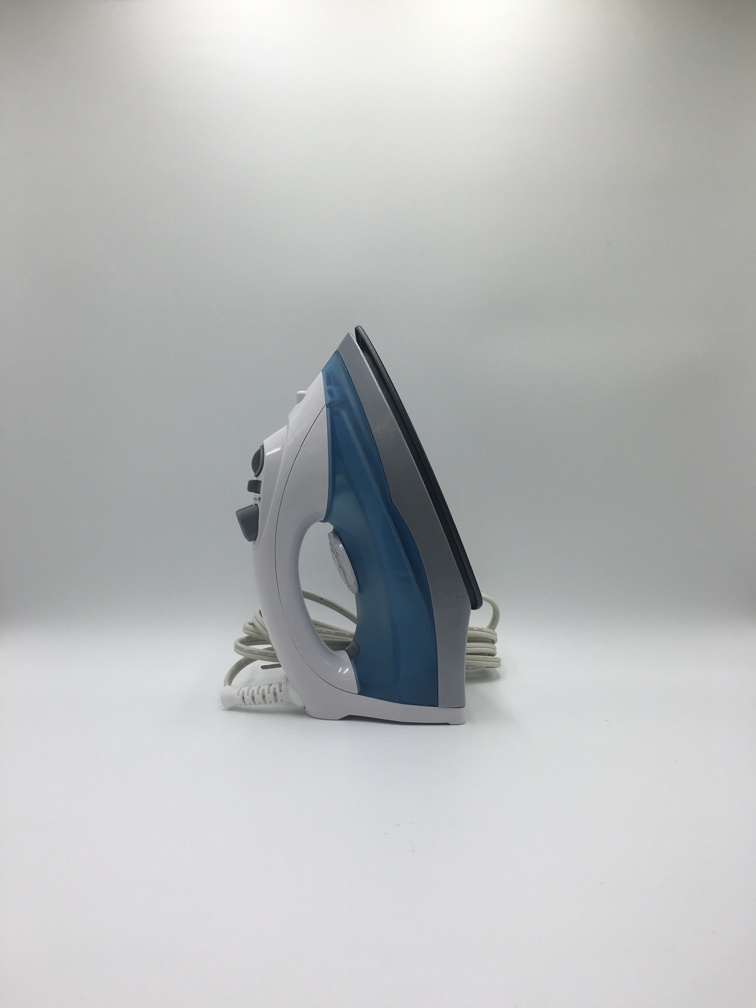
(a) White
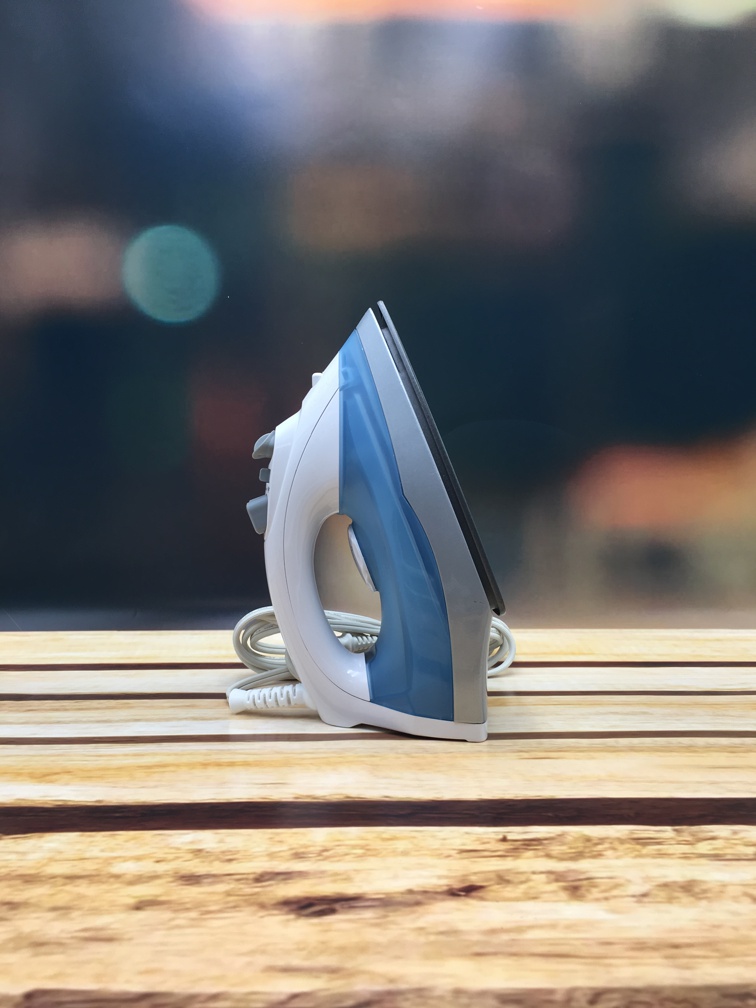
(b) Living Room

(c) Kitchen

(d) Living Room

(e) Office
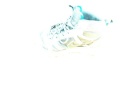
Underexposure
Overexposure
Blur
Contrast
Dirty Lens 1
Dirty Lens 2
Salt & Pepper
Level 1


Level 2


Level 3


Level 4


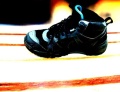


Level 5


Challenges types: Images in the CURE-OR dataset were separated into color and grayscale images to investigate the importance of color information in object recognition. We processed original images to simulate realistic challenging conditions including underexposure, overexposure, blur, contrast, dirty lens, salt and pepper noise, and resizing. Brightness of images was adjusted to obtain underexposure and overexposure images. Pixel values were remapped to obtain contrast images and smoothed out with a Gaussian operator to obtain blur images. Dirty lens images were obtained by overlaying dirty lens patterns over original images. In the first dirty lens category, a single dirt pattern was blended into images with weights that were proportional to challenge levels. In the second category, a distinct dirt pattern was overlaid for each challenge level. In the salt and pepper category, pixels were randomly replaced with zeros and ones. Salt and pepper noise was synthesized with scikit-image version 0.13.0 and all other challenging conditions were simulated with Python Imaging Library version 4.2.1.
Challenges levels: The number of distinct challenge levels is 4 in resizing category and 5 in all other categories. Challenge levels were adjusted based on visual inspection instead of numerical progression. Challenge level adjustment experiments were conducted by a group of three individuals, two experts and one intermediate in image processing, in an office space under standard lighting conditions. In the first experiment, we utilized a 65-inch LED TV display, whose settings were fixed to standard viewing conditions. We tuned the parameters in challenge generation such that challenges in level 1 were visible but they did not affect recognition, whereas in challenge level 5, objects were hardly recognizable or further changes in parameters did not correspond to significant perceivable difference. Mid challenge levels were linearly interpolated between min and max challenge levels. In the second experiment, we displayed level-1 and level-5 sample images on a 27-inch LCD PC monitor and observed that initial selection criteria still held in a different setup. In both experiments, subjects were located at a distance of twice the display size. Sample images corresponding to different challenge types and levels are shown in Fig. 4 with the API results that will be discussed in the following section.
IV Recognition under Challenging Conditions
There are numerous visual recognition applications that are publicly available, but it is not feasible to perform large-scale experiments in majority of these applications. After a preliminary feasibility study, we conducted our experiments using Amazon Rekognition API (AMZN) and Microsoft Azure Computer Vision API (MSFT). Rekognition is a deep learning-based image recognition system provided by Amazon Web Services. Microsoft Azure Computer Vision utilizes image processing algorithms to analyze visual contents. We use the object recognition feature from AMZN and the image tagging functionality from MSFT to assess their performance.
IV-A Experimental Setup
Test Set: For both APIs, we input challenge-free images of 100 objects from CURE-OR dataset to collect object labels, and analyzed the collected labels semantically to identify the labels that can be considered ground truth. For example, a Coca Cola bottle can be recognized as a beverage, a bottle, a drink, a coke, a soda, or a glass. We selected 4 objects from each object category based on the number of images that can be correctly identified by each API. If a selected object was similar to another object in the same category, the object with more correctly identified images was utilized. Microsoft identified only 3 objects in health/personal care category, so one object with the least number of correctly identified images from Amazon was excluded for a fair analysis, which led to 23 objects (top objects) selected for each API. For direct comparison of the platforms, we also analyzed the recognition performance on the 10 common objects between the 23 top objects of both APIs. In total, we tested the performance of each API with images. We limited the number of tested objects to minimize the total cost of the experiment using Amazon. However, we were able to test the recognition performance for the remaining images using Microsoft thanks to promotional credits. On average, testing per image took 1.3 seconds for Amazon and 0.2 seconds for Microsoft.
Performance Metrics: Top-5 accuracy metric was employed to measure the recognition performance. Outputs of both APIs were sorted based on their confidence levels and the highest 5 labels were selected for top-5 accuracy calculation. If multiple labels shared the same confidence level as the label, they were also included. If a ground truth label was among the top list, it was considered as a correct prediction. After repeating this procedure for all the images, we calculated the ratio between the number of correct predictions and the total number of object images to obtain the overall top-5 accuracy. In addition to the overall recognition performance in terms of top-5 accuracy, we also provided confusion matrices for different challenge levels to analyze misclassifications. Each row of the matrix corresponds to instances of actual categories and each column of the matrix corresponds to instances of predicted categories. An ideal classifier would have a confusion matrix with a highlighted main diagonal. Each element in the confusion matrix is colored based on the classification accuracy according to the legend next to each figure. Since both recognition APIs do not provide a comprehensive list of possible labels, the labels that did not belong to any categories were excluded.
IV-B Recognition Performance
In this section, we analyze the performance of both recognition platforms under challenging conditions. We report the recognition performance using color and grayscale images of top and common objects in Fig. 5. Moreover, we discuss the misclassification between object categories under varying challenge levels with confusion matrices in Fig. 6. Lastly, we report the overall recognition performance of both platforms in Table II.
Color versus Grayscale: To understand the contribution of color in terms of recognition performance, Fig. 5(a) can be compared with Fig. 5(b) for Amazon, and Fig. 5(d) with Fig. 5(e) for Microsoft. Based on the results in Fig. 5, we observe that both recognition platforms utilize color information. However, color information affects overall recognition performance more significantly for Microsoft compared to Amazon.
Challenging Conditions: For both platforms, resizing affects the performance the least for the 4 challenge levels present. Blur, salt & pepper noise, and dirty lens 1 challenging conditions are the most effective in degrading the performance, leading to less than 1% top-5 accuracy for Amazon and 0.1% for Microsoft. In general, the challenges that remove structural components in an image degrade the application performance significantly. Blur filters out high-frequency components and salt & pepper noise replaces random pixel values that corrupt structural components, which are critical for recognition task. Even though resizing also filters out high-frequency components, the level of smoothing is not as remarkable as blur and most structural components are preserved. Dirty lens 1 challenge overlays a dirty lens pattern with different weights corresponding to challenge levels, which effectively block edge and texture in an image. We also report the recognition performance using color images of 10 common objects in Fig. 5(c) and Fig. 5(f). Similar to top object performance, Amazon significantly outperforms Microsoft in all categories.
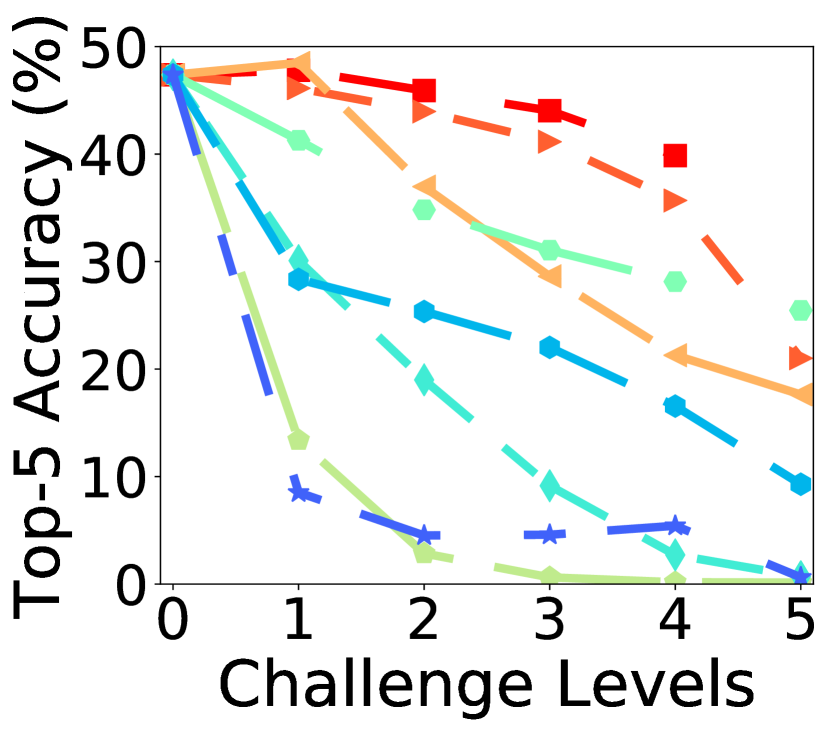
(a) AMZN: Top obj-C
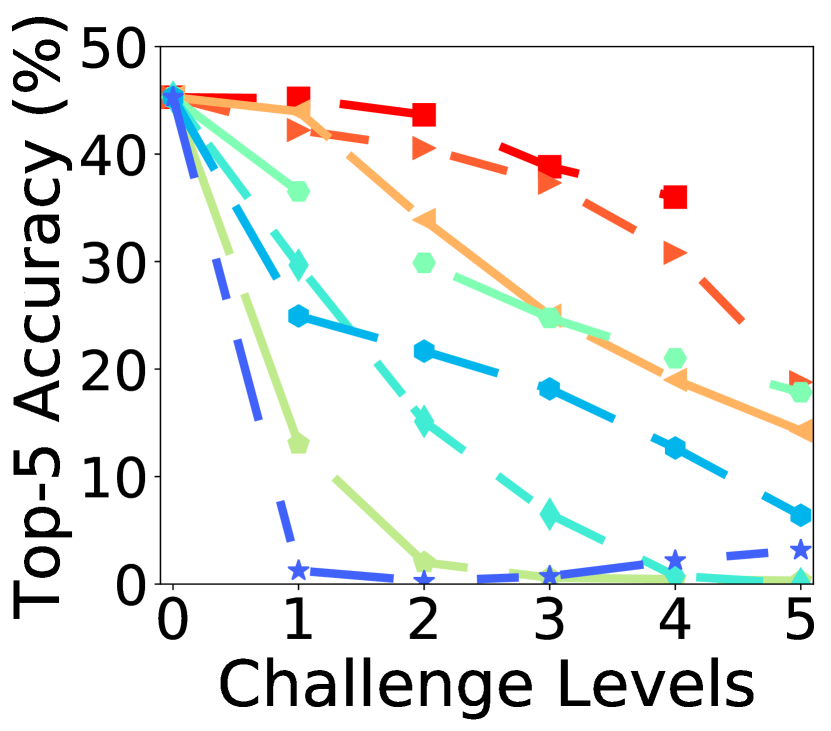
(b) AMZN: Top obj-G
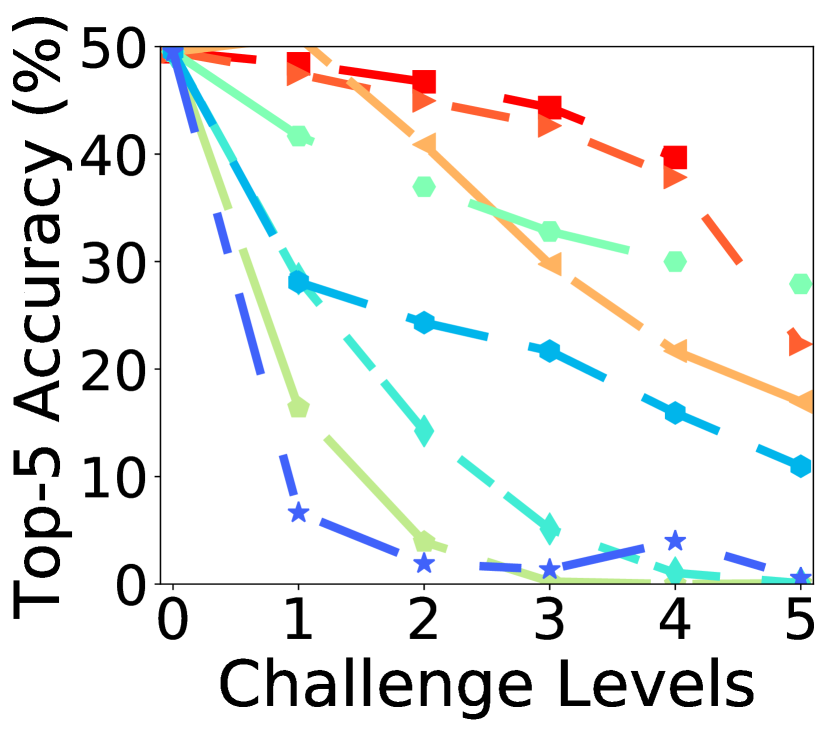
(c) AMZN: Common obj-C
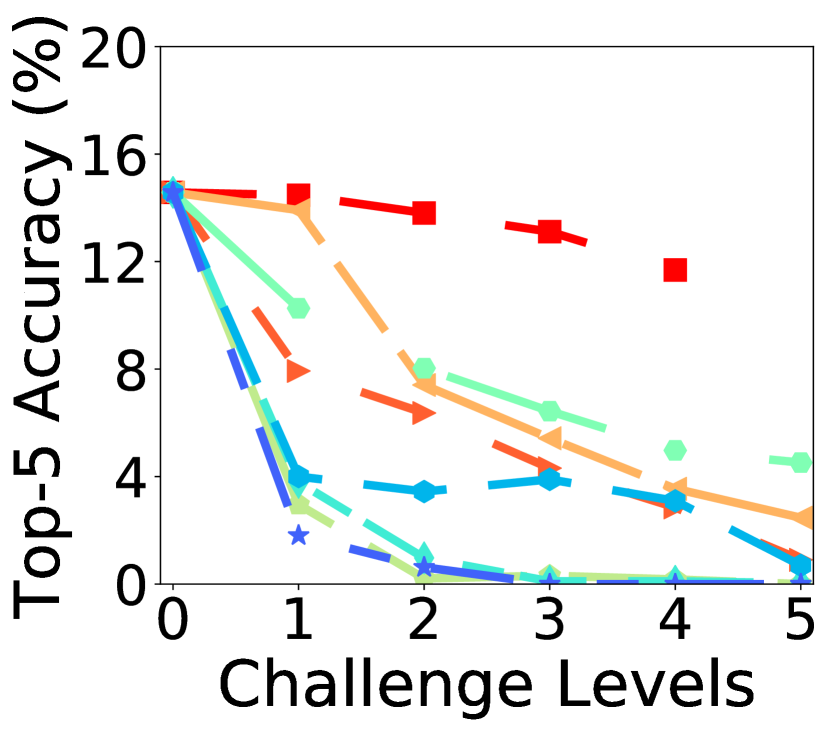
(d) MSFT: Top obj-C
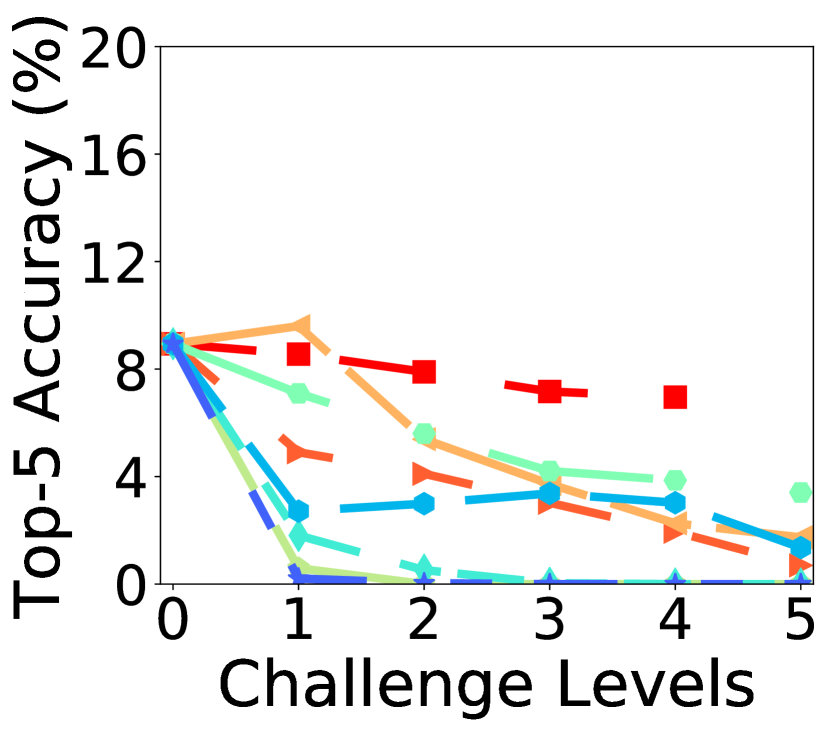
(e) MSFT: Top obj-G
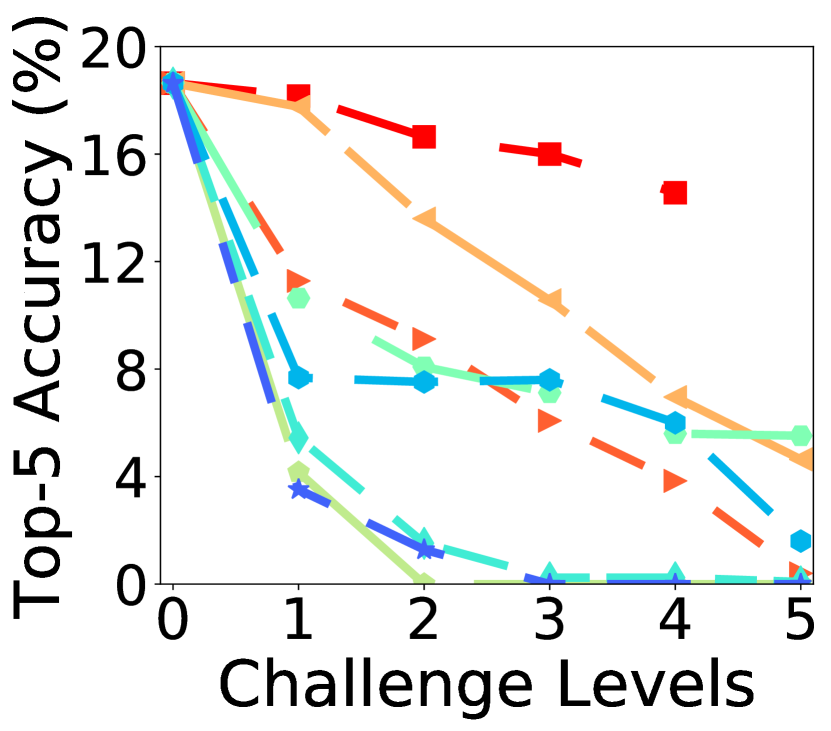
(f) MSFT: Common obj-C

Misclassification: We analyze the object categorical misclassifications at different challenge levels with confusion matrices as shown in Fig. 6, where the first row corresponds to Amazon Rekognition and the second row corresponds to Microsoft Azure. We observe that the main diagonals of Amazon Rekognition are more predominant than the diagonals of Microsoft Azure at every challenge level. As the challenge level increases, highlights in the main diagonals significantly diminish, which shows the vulnerabilities of the recognition platforms under challenging conditions.
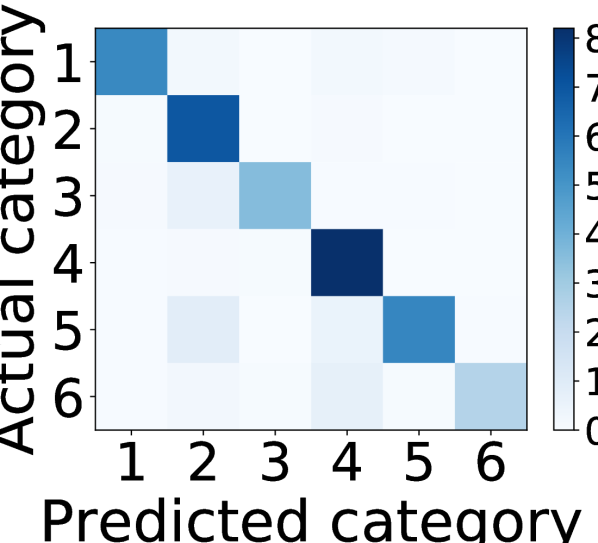
(a) AMZN: Lev_0
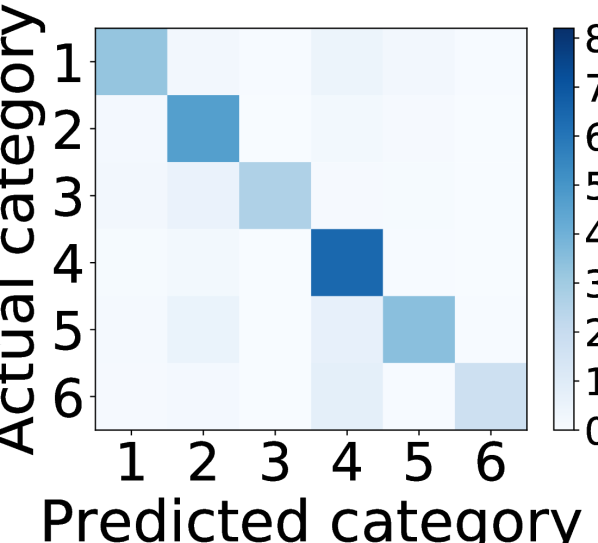
(b) AMZN: Lev_1
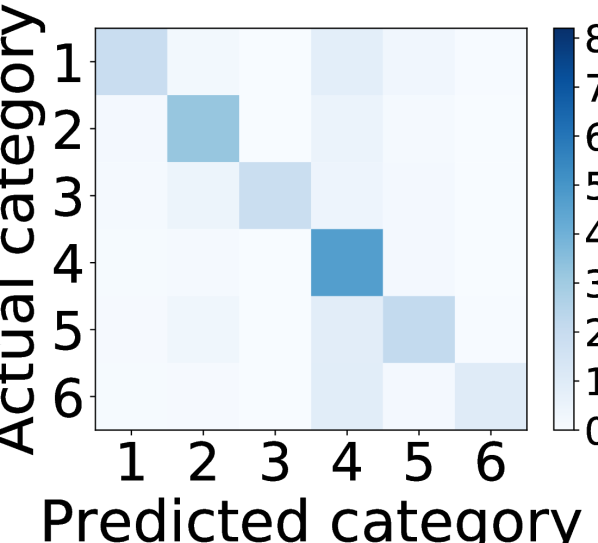
(c) AMZN: Lev_3
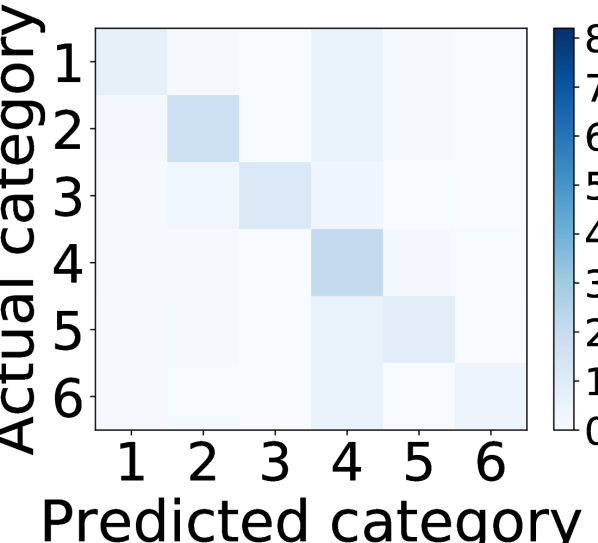
(d) AMZN: Lev_5
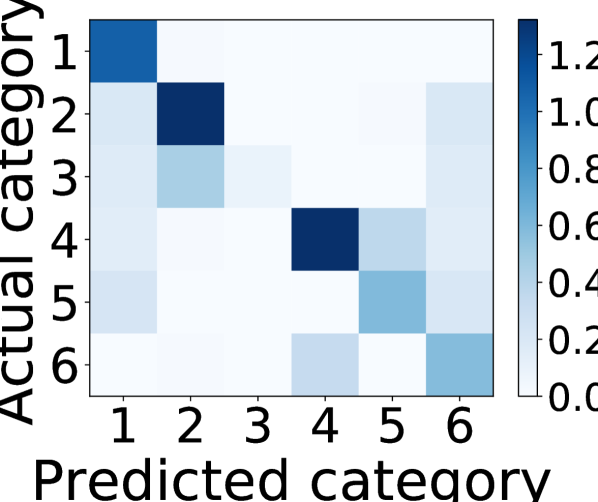
(e) MSFT: Lev_0
(f) MSFT: Lev_1
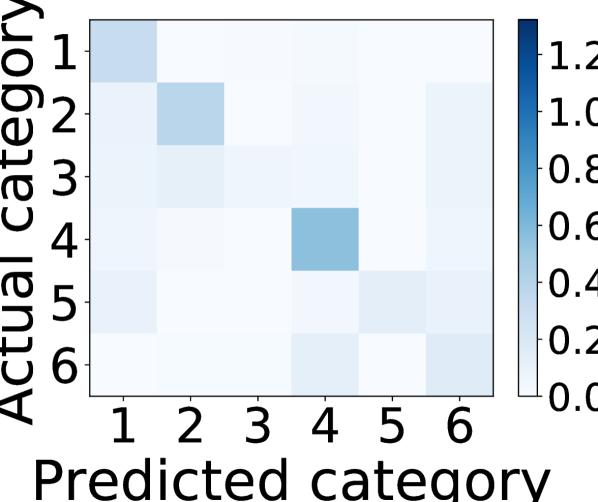
(g) MSFT: Lev_3
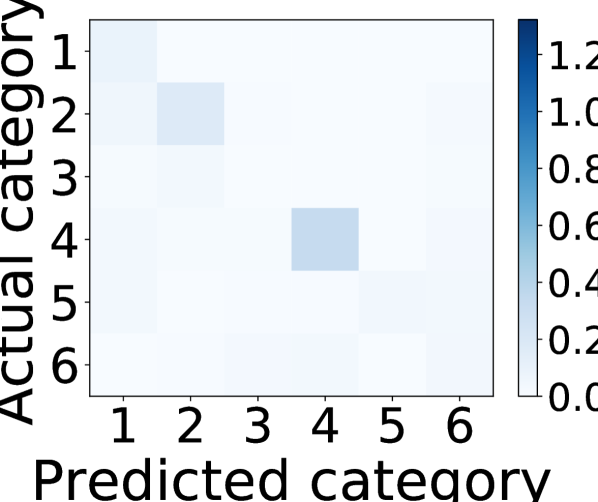
(h) MSFT: Lev_5
Overall Performance: We report the overall recognition performance of Amazon Rekognition and Microsoft Azure in Table II. Test sets include challenge images as well as original images and performance is reported in terms of top-5 accuracy. For Amazon Rekognition, we report the results for 10 common objects and 23 top objects as described in Section IV-A. For Microsoft Azure, we also report the results for the entire CURE-OR dataset. Amazon Rekognition shows significantly higher performance compared to Microsoft Azure for the top and common objects in both color and grayscale. Both recognition platforms show slightly better accuracy for the 10 common objects than the 23 top objects because the objects that can be recognized by both platform lead to a slightly higher average accuracy compared to remaining objects from top objects. When all objects are considered, Microsoft Azure’s performance degrades even more, getting closer to 1% top-5 accuracy because majority of the remaining 77 objects are not accurately recognized even when they are challenge-free.
| Color | Grayscale | ||||||
| Top | Common | All | Top | Common | All | ||
|
25.78 | 26.03 | - | 22.78 | 23.6 | - | |
|
5.66 | 7.62 | 1.83 | 3.58 | 5.17 | 1.01 | |
V Recognition Accuracy versus Image Quality
V-A Experimental Setup
Image Quality Algorithms, Databases and Distortions: We utilize three different types of full-reference image quality assessment algorithms including PSNR as a fidelity measure, SSIM [30] as a structural similarity measure, and UNIQUE [31] as a data-driven quality measure based on color and structure. We validate the subjective quality estimation performance over LIVE [32], MULTI [33], and TID13 [34] databases, which include images and distortion types. Distortion types in test databases can be grouped into 7 main categories as lossy compression, image noise, communication error, image blur, color artifacts, global distortions (intensity shift/contrast change), and local distortions.
Estimation Performance Calculation: In this study, we estimate the recognition accuracy with respect to changes in photometric conditions. The top-5 accuracy results from Amazon Rekognition and Microsoft Azure were averaged for this section. At first, we identify the challenge-free images as references, which lead to the highest recognition accuracy. Then, we investigate the relationship between image quality and recognition accuracy. Specifically, first, we group images that are captured with a particular device (5) in front of a specific backdrop (3) under a specific challenge level (6), which leads to 90 image groups for each challenge type. Each image group includes images of 10 common objects described in Section IV-A for all orientations. Second, we calculate average recognition performance and image quality scores for each image group. Overall, for each challenge category, we obtain 90 image quality and recognition accuracy scores, which correspond to the average of image groups. Real-world living room and office backgrounds are excluded because performance in these backgrounds are significantly different from other backgrounds, which cannot be captured with quality estimators that require pixel-to-pixel correspondence. Third, we calculate the Spearman correlation between objective quality and recognition accuracy scores to obtain recognition accuracy estimation performance. Moreover, we calculate the Spearman correlation between objective and subjective scores in image quality databases (LIVE, MULTI, and TID13) to obtain subjective quality assessment performance of image quality assessment (IQA) algorithms.
| Challenge Type | PSNR | SSIM | UNIQUE |
|---|---|---|---|
| Resize | 0.755 | 0.382 | 0.312 |
| Underexposure | 0.722 | 0.807 | 0.407 |
| Overexposure | 0.642 | 0.432 | 0.576 |
| Blur | 0.782 | 0.749 | 0.876 |
| Contrast | 0.813 | 0.644 | 0.767 |
| Dirty lens 1 | 0.915 | 0.872 | 0.841 |
| Dirty lens 2 | 0.911 | 0.667 | 0.643 |
| Salt & Pepper | 0.792 | 0.791 | 0.780 |
V-B Recognition Accuracy and Subjective Quality Estimation
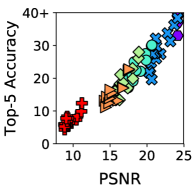
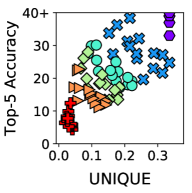
We report the recognition accuracy estimation in Table III and subjective quality estimation in Table IV. In terms of challenge categories, PSNR is leading in majority of the categories whereas SSIM is leading in underexposure category and UNIQUE in blur category. Overall, fidelity-based PSNR has the highest correlation, SSIM is the second measure, and UNIQUE is the third measure. Moreover, the relationship between the average recognition accuracy of both APIs on common objects and the quality scores can be observed from the scatter plots in Fig. 7. Scatter point distribution has a linear characteristic in PSNR whereas scatter points are more spread out for other quality measures. Even though SSIM and UNIQUE do not show a linear behavior, we can observe that scatter points corresponding to different challenge levels form distinct clusters. Therefore, UNIQUE and SSIM scores combined with top-5 accuracy scores can be informative in terms of identifying challenge level of the scenes.


According to subjective quality estimation performances in the image quality databases reported in Table IV, UNIQUE leads to highest correlation in majority of the distortion types and SSIM leads in compression and global categories. SSIM and UNIQUE are specifically designed for estimating subjective quality of images whereas PSNR is used for calculating the fidelity of a general signal representation based on the ratio of maximum signal power and noise power. Therefore, UNIQUE and SSIM outperform PSNR in the application they are designed for whereas they underperform in estimating recognition accuracy. Even though objective quality assessment algorithms can estimate the recognition performance in certain scenarios, they are inherently limited because significant perceptual changes captured by quality assessment algorithms may not be critical for recognition algorithms.
| Challenge Type | PSNR | SSIM | UNIQUE |
|---|---|---|---|
| Compression | 0.871 | 0.938 | 0.934 |
| Noise | 0.774 | 0.862 | 0.875 |
| Communication | 0.863 | 0.931 | 0.933 |
| Blur | 0.803 | 0.905 | 0.909 |
| Color | 0.815 | 0.235 | 0.909 |
| Global | 0.340 | 0.499 | 0.356 |
| Local | 0.543 | 0.288 | 0.645 |
VI Conclusion
In this paper, we have introduced a large-scale object recognition dataset denoted as CURE-OR whose images were captured with multiple devices in different backgrounds and orientations. We have utilized the introduced dataset to test the robustness of recognition APIs—Amazon Rekognition and Microsoft Azure Computer Vision—under challenging conditions. Based on the experiments, we have shown that both APIs are significantly vulnerable to challenging conditions that corrupt or eliminate high frequency components of an image and less vulnerable to conditions that affect pixel range. We have further analyzed the categorical misclassifications and concluded that recognition performance degrades for each challenge category as the challenge level increases. Overall, tested APIs resulted in a relatively low performance, which indicates the need for more accurate and robust solutions that are less sensitive to challenging conditions. Moreover, we also investigated the relationship between object recognition and image quality and showed that objective quality algorithms can estimate recognition performance under certain photometric challenging conditions if environmental conditions do not change significantly in terms of orientation and background.
References
- [1] K. He et al., “Delving Deep into Rectifiers: Surpassing Human-Level Performance on ImageNet Classification,” in arXiv:1502.01852, 2015.
- [2] R. Wu et al., “Deep Image: Scaling up Image Recognition,” in arXiv:1501.02876, 2015.
- [3] D. G. Lowe, “Distinctive image features from scale-invariant keypoints,” IJCV, vol. 60, no. 2, pp. 91–110, Nov. 2004.
- [4] H. Bay, T. Tuytelaars, and L. Van Gool, SURF: Speeded Up Robust Features, Springer Berlin Heidelberg, 2006.
- [5] N. Dalal and B. Triggs, “Histograms of oriented gradients for human detection,” in IEEE CVPR, June 2005, vol. 1, pp. 886–893 vol. 1.
- [6] J. Deng et al., “ImageNet: A large-scale hierarchical image database,” in IEEE CVPR, June 2009, pp. 248–255.
- [7] L. Fei-Fei, R. Fergus, and P. Perona, “Learning generative visual models from few training examples: An incremental bayesian approach tested on 101 object categories,” in IEEE CVPRW, June 2004, pp. 178–178.
- [8] A. Opelt and A. Pinz, Object Localization with Boosting and Weak Supervision for Generic Object Recognition, pp. 862–871, Springer Berlin Heidelberg, 2005.
- [9] M. Everingham et al., “The Pascal visual object classes challenge: A Retrospective”,” IJCV, vol. 111, no. 1, pp. 98–136, 2015.
- [10] B. C. Russell et al. , “Labelme: A database and web-based tool for image annotation,” IJCV, vol. 77, no. 1, pp. 157–173, 2008.
- [11] A. Torralba, R. Fergus, and W. T. Freeman, “80 million tiny images: A large data set for nonparametric object and scene recognition,” IEEE Trans. PAMI, vol. 30, no. 11, pp. 1958–1970, Nov 2008.
- [12] A. Krizhevsky, “Learning multiple layers of features from tiny images,” Tech. Rep., 2009.
- [13] K. Saenko et al., “Adapting visual category models to new domains,” in ECCV, Berlin, Heidelberg, 2010, pp. 213–226, Springer-Verlag.
- [14] T.-Y. Lin et al., “Microsoft COCO: Common objects in context,” in arXiv:1405.0312, 2014.
- [15] H. Hosseini, B. Xiao, and R. Poovendran, “Google’s cloud vision api is not robust to noise,” in IEEE ICMLA, Dec 2017, pp. 101–105.
- [16] S. Dodge and L. Karam, “Understanding how image quality affects deep neural networks,” in QoMEX, June 2016, pp. 1–6.
- [17] Y. Zhou, S. Song, and N-M. Cheung, “On classification of distorted images with deep convolutional neural networks,” in arXiv:1701.01924, 2017.
- [18] J. Lu et al., “No need to worry about adversarial examples in object detection in autonomous vehicles,” in arXiv:1707.03501, 2017.
- [19] N. Das et al, “Keeping the bad guys out: Protecting and vaccinating deep learning with jpeg compression,” in arXiv:1705.02900, 2017.
- [20] D. Temel, G. Kwon, M. Prabhushankar, and G. AlRegib, “CURE-TSR: Challenging unreal and real environments for traffic sign recognition,” in NIPS MLITS Workshop, 2017.
- [21] S. A. Nene, S. K. Nayar, and H. Murase, “Columbia object image library (COIL-100),” in Tech. Rep. CUCS-006-96, 1996.
- [22] B. Funt, K. Barnard, and L. Martin, Is machine colour constancy good enough?, pp. 445–459, Springer Berlin Heidelberg, Berlin, Heidelberg, 1998.
- [23] D. Koubaroulis, J. Matas, and J. Kittler, “Evaluating colour-based object recognition algorithms using the SOIL-47 database,” in ACCV, 2002, pp. 840–845.
- [24] V. Ferrari, T. Tuytelaars, and L. Van Gool, Simultaneous object recognition and segmentation by image exploration, pp. 40–54, Springer Berlin Heidelberg, Berlin, Heidelberg, 2004.
- [25] Y. LeCun, F. J. Huang, and L. Bottou, “Learning methods for generic object recognition with invariance to pose and lighting,” in IEEE CVPR, June 2004, vol. 2, pp. II–97–104 Vol.2.
- [26] J.-M. Geusebroek, G. J. Burghouts, and A. W.M. Smeulders, “The amsterdam library of object images,” IJCV, vol. 61, no. 1, pp. 103–112, Jan 2005.
- [27] K. Lai et al., “A large-scale hierarchical multi-view rgb-d object dataset,” in IEEE ICRA, May 2011, pp. 1817–1824.
- [28] A. Singh et al., “BigBIRD: A Large-scale 3d database of object instances,” in IEEE ICRA, 2014, pp. 509–516.
- [29] A. Borji, S. Izadi, and L. Itti, “iLab-20M: A Large-scale controlled object dataset to investigate deep learning,” in IEEE CVPR, June 2016, pp. 2221–2230.
- [30] Z. Wang et al., “Image quality assessment: From error visibility to structural similarity.,” IEEE Trans. on Imag. Proc., vol. 13, no. 4, pp. 600–12, Apr. 2004.
- [31] D. Temel, M. Prabhushankar, and G. AlRegib, “UNIQUE: Unsupervised image quality estimation,” IEEE Sig. Proc. Let., vol. 23, no. 10, pp. 1414–1418, Oct 2016.
- [32] H. R. Sheikh, M. F. Sabir, and A. C. Bovik, “A statistical evaluation of recent full reference image quality assessment algorithms,” IEEE Trans. Ima. Proc., vol. 15, no. 11, pp. 3440–3451, Nov 2006.
- [33] D. Jayaraman et al., “Objective quality assessment of multiply distorted images,” in Asilomar Conf. Sig., Sys. and Comp., Nov 2012, pp. 1693–1697.
- [34] N. Ponomarenko et al., “Image database TID2013: Peculiarities, results and perspectives ,” Sig. Proc.: Ima. Comm., vol. 30, pp. 57 – 77, 2015.