Caitlin M. Casey1, Desika Narayanan2,3, Chris Carilli4, Jaclyn Champagne1, Chao-Ling Hung1, Romeel Davé5, Roberto Decarli6, Eric J. Murphy7, Gergo Popping8, Dominik Riechers9, Rachel S. Somerville10,11, Fabian Walter8
1 Department of Astronomy, The University of Texas at Austin, 2515 Speedway Blvd, Austin, TX 78712, USA
2 Department of Astronomy, University of Florida, 211 Bryant Space Science Center, P.O. Box 112055, Gainesville, FL 32611, USA
3 Cosmic Dawn Center (DAWN), Niels Bohr Institute, University of Copenhagen, DK-2100 Copenhagen ; DTU-Space, Technical University of Denmark, DK-2800 Kgs. Lyngby
4 National Radio Astronomy Observatory, 1003 Lopezville Rd, Socorro, NM 87801, USA
5 Institute for Astronomy, University of Edinburgh, Royal Observatory, Blackford Hill, Edinburgh EH9 3HJ, UK
6 INAF - Osservatorio di Astrofisica e Scienza dello Spazio di Bologna, via Cobetti 93/3, 40129 Bologna, Italy
7 National Radio Astronomy Observatory, 1180 Boxwood Estate Rd, Charlottesville, VA 22903, USA
8 Max Planck Institute for Astronomy, Königstuhl 17, 69117 Heidelberg, Germany
9 Department of Astronomy, Cornell University, 616A Space Science Building, Ithaca, NY 14850, USA
10 Department of Physics & Astronomy, Rutgers University, 136 Frelinghuysen Rd, Piscataway, NJ 08854, USA
11 Center for Computational Astrophysics, 162 5th Ave, New York, NY 10010, USA
Abstract The next generation Very Large Array (ngVLA) will revolutionize our understanding of the distant Universe via the detection of cold molecular gas in the first galaxies. Its impact on studies of galaxy characterization via detailed gas dynamics will provide crucial insight on dominant physical drivers for star-formation in high redshift galaxies, including the exchange of gas from scales of the circumgalactic medium down to resolved clouds on mass scales of 105 M⊙. In this study, we employ a series of high-resolution, cosmological, hydrodynamic zoom simulations from the Mufasa simulation suite and a CASA simulator to generate mock ngVLA observations of a gas-rich star-forming galaxy. Using the Despotic radiative transfer code that encompasses simultaneous thermal, chemical, and statistical equilibrium in calculating the molecular and atomic level populations, we generate parallel mock observations of low-J to high-J transitions of CO from ALMA for comparison. We find that observations of CO(1-0) are especially important for tracing the systemic redshift of the galaxy and the total mass of the well-shielded molecular gas reservoir, while even CO(2-1) can predominantly trace denser gas regions distinct from CO(1-0). The factor of 100 times improvement in mapping speed for the ngVLA beyond the Jansky VLA and the proposed ALMA Band 1 will make these detailed, high-resolution imaging and kinematic studies of CO(1-0) routine at .
1 Introduction
Cold molecular gas is the fuel for cosmic star-formation (Solomon & Vanden Bout, 2005; Carilli & Walter, 2013). This gas is most commonly probed through observations of CO, the most abundant molecule after molecular hydrogen, and a molecule which is easily excitable at low temperatures. Resolved CO studies of distant galaxies can not only provide the basic measurement of a galaxy’s total molecular gas mass, but one can also extract detailed kinematics of that cold gas reservoir. The kinematics give direct constraints on the internal dynamics of galaxies out to high- and insight into the physics of the interstellar medium (e.g. Engel et al., 2010; Bothwell et al., 2010; Ivison et al., 2012): whether or not they are dispersion dominated, agitated by a dynamical interaction, or rotating in a disk. Ideally, these kinematic tracers would be available for a large sample of early Universe galaxies to address important questions in galaxy formation and evolution, like assessing the relative role of major mergers in driving the growth of massive galaxies over cosmic time.
It is not immediately clear that all tracers of molecular gas in distant galaxies would lead to the same observational conclusions about galaxy dynamics, as each traces fundamentally different physical states of the gas. For example, the lowest ground state transition of CO, CO(1-0), should trace the most diffuse and massive gas reservoir in galaxies, while higher-J transitions probe sequentially denser environments. Very few galaxies in the early Universe have resolved observations from multiple molecular gas tracers, because the time required to spatially map each transition is currently prohibitive for large samples of galaxies, even on the most sensitive interferometers like ALMA. And yet, there is some indication that different tracers do point to fundamentally different gas reservoirs, that could lead to differences of interpretation of their dynamics (Bothwell et al., 2013; Hodge et al., 2012).
In this study, we investigate quantitative differences in observations of different CO transitions in a hydrodynamic simulation of a early Universe massive galaxy. Based on a direct comparison between the inferred results from our mock observations and the cosmological simulations, we investigate the capabilities of ALMA and the proposed next generation Very Large Array (ngVLA Carilli, 2015) to constrain the mode of star formation, dynamical mass, and molecular gas kinematics in individual high-redshift galaxies (see Casey et al., 2015, for a broader discussion of ngVLA’s use in high- extragalactic astrophysics). This work highlights the complexity in inferring these important quantities in early Universe galaxies, and the need for the next generation facilities.
2 Hydrodynamic Zoom-In Simulation Case Study
We employ a series of high-resolution, cosmological, hydrodynamic zoom simulations (Narayanan et al., 2018, 2018) from the Mufasa simulation suite (Davé, Thompson & Hopkins, 2016; Davé et al., 2017) and a CASA simulator to generate mock ngVLA observations. Using the Despotic radiative transfer code (Krumholz, 2014) that encompasses simultaneous thermal, chemical and statistical equilibrium in calculating the molecular and atomic level populations (Narayanan & Krumholz, 2017), we generate parallel mock observations of low-J to high-J transitions of CO. For this study we take a single snapshot of one zoom simulation. The galaxy being formed is an extremely massive M⊙ at ; the zoom in itself is only run from high- down to , at which point the stellar mass is already 21011 M⊙, which is at . The system undergoes two ‘starbursting’ episodes during its history at and ; the first is driven by the infall of several small galaxies (i.e. minor mergers) while the later burst is driven by a major merger. We have chosen to focus our study on the earlier snapshot, which represents the strongest starburst episode of the galaxy’s history. The galaxy’s star formation history and evolving molecular gas mass is shown in Figure 1. At the sampled snapshot, the galaxy’s total stellar mass is 71010 M⊙, its mass of molecular hydrogen is 21010 M⊙, and its 50 Myr-averaged SFR is 415 M⊙ yr-1. The simulated galaxy’s gas kinematic structure is inherently complex owing to the minor interactions, though morphologically the galaxy presents as a stable disk (consistent with what is found observationally for similar galaxies at in dust continuum, Hodge et al., 2016).
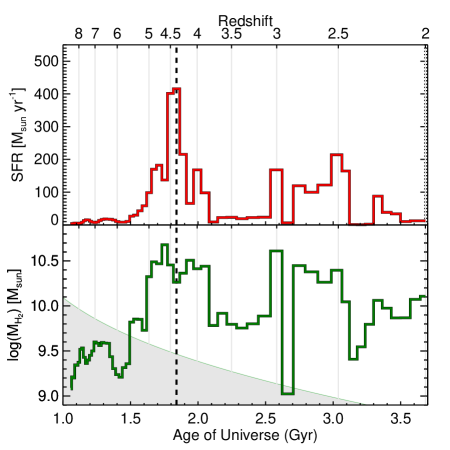
We note that this source sampled at this particular time is expected to be among the brighter galaxies detectable with the ngVLA. Figure 1 shows the effective 5 detection limit as a function of redshift for a 1 hour ngVLA observation on CO(1-0). This limit is determined by working backward from a target RMS of 10Jy/beam per 2 MHz channel in 1 hour of observations, an assumed average 200 km/s line width, and a CO-to-H2 conversion factor of M⊙ (K km/s pc2)-1. In other words, this is the limit at which the total integrated CO(1-0) line would have a 5 significance if it were 200 km/s wide. The galaxy snapshot studied here would be detectable with a total SNR of 32 in 1 hour with the ngVLA. In contrast, GN20, at a similar luminosity and redshift, at required a total of 120 hours with the current VLA. If, as in this study, one wishes to spatially resolve the CO line across 10 beams, 10 hours of integration are required to reach gas masses at this limit. If this signal needs to be further resolved spectrally into spectral bins (where has a minimum value of 4 to kinematically resolve rotation), the RMS per channel goes up as and the required observing time scales with .
For this particular galaxy snapshot, the integrated CO luminosity is 21010 L⊙. Distributed across 10 beams and 7 spectral bins, the average SNR per beam is anticipated to be 10 in a 1 hour ngVLA integration of CO(1-0). The required observing time would be approximately 30 minutes for the 4 brighter CO(2-1) transition. The same system as observed with ALMA in CO(4-3) at matched SNR per spatial and spectral bin would require 12 hours of on-source integration.
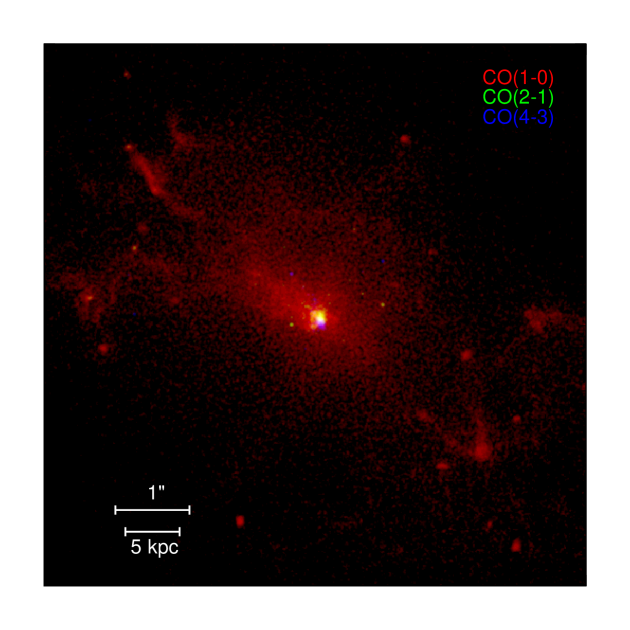
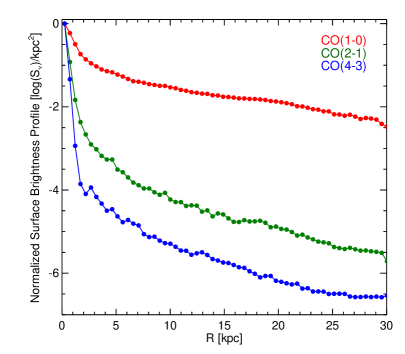
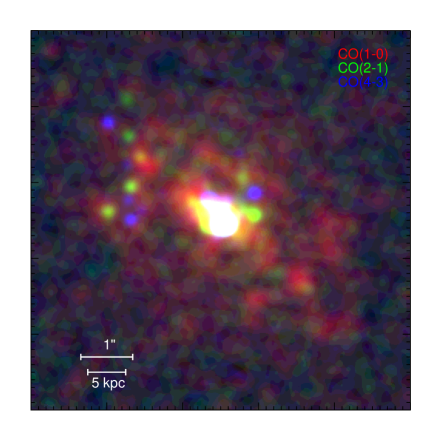
Figure 2 shows a false-color image tracing the molecular gas luminosity of the simulated galaxy itself, where CO(1-0) emission is shown in red, relative to CO(2-1) in green and CO(4-3) in blue111Note that at this redshift, CO(3-2) is not observable as its frequency falls in an opaque atmospheric frequency range.. The entire gas reservoir emits somewhat uniformly in CO(1-0), indicative of diffuse gas in the galaxy’s interstellar and circumgalactic mediums, rendering this tri-color image largely red over most of the galaxy’s observed surface area. The radial surface brightness profiles of CO emission is shown in Figure 3; the contrast of peak emission at the core to diffuse in the outskirts is only a factor of 10-100 in CO(1-0) while it is 104-6 for higher-J CO lines, including CO(2-1).
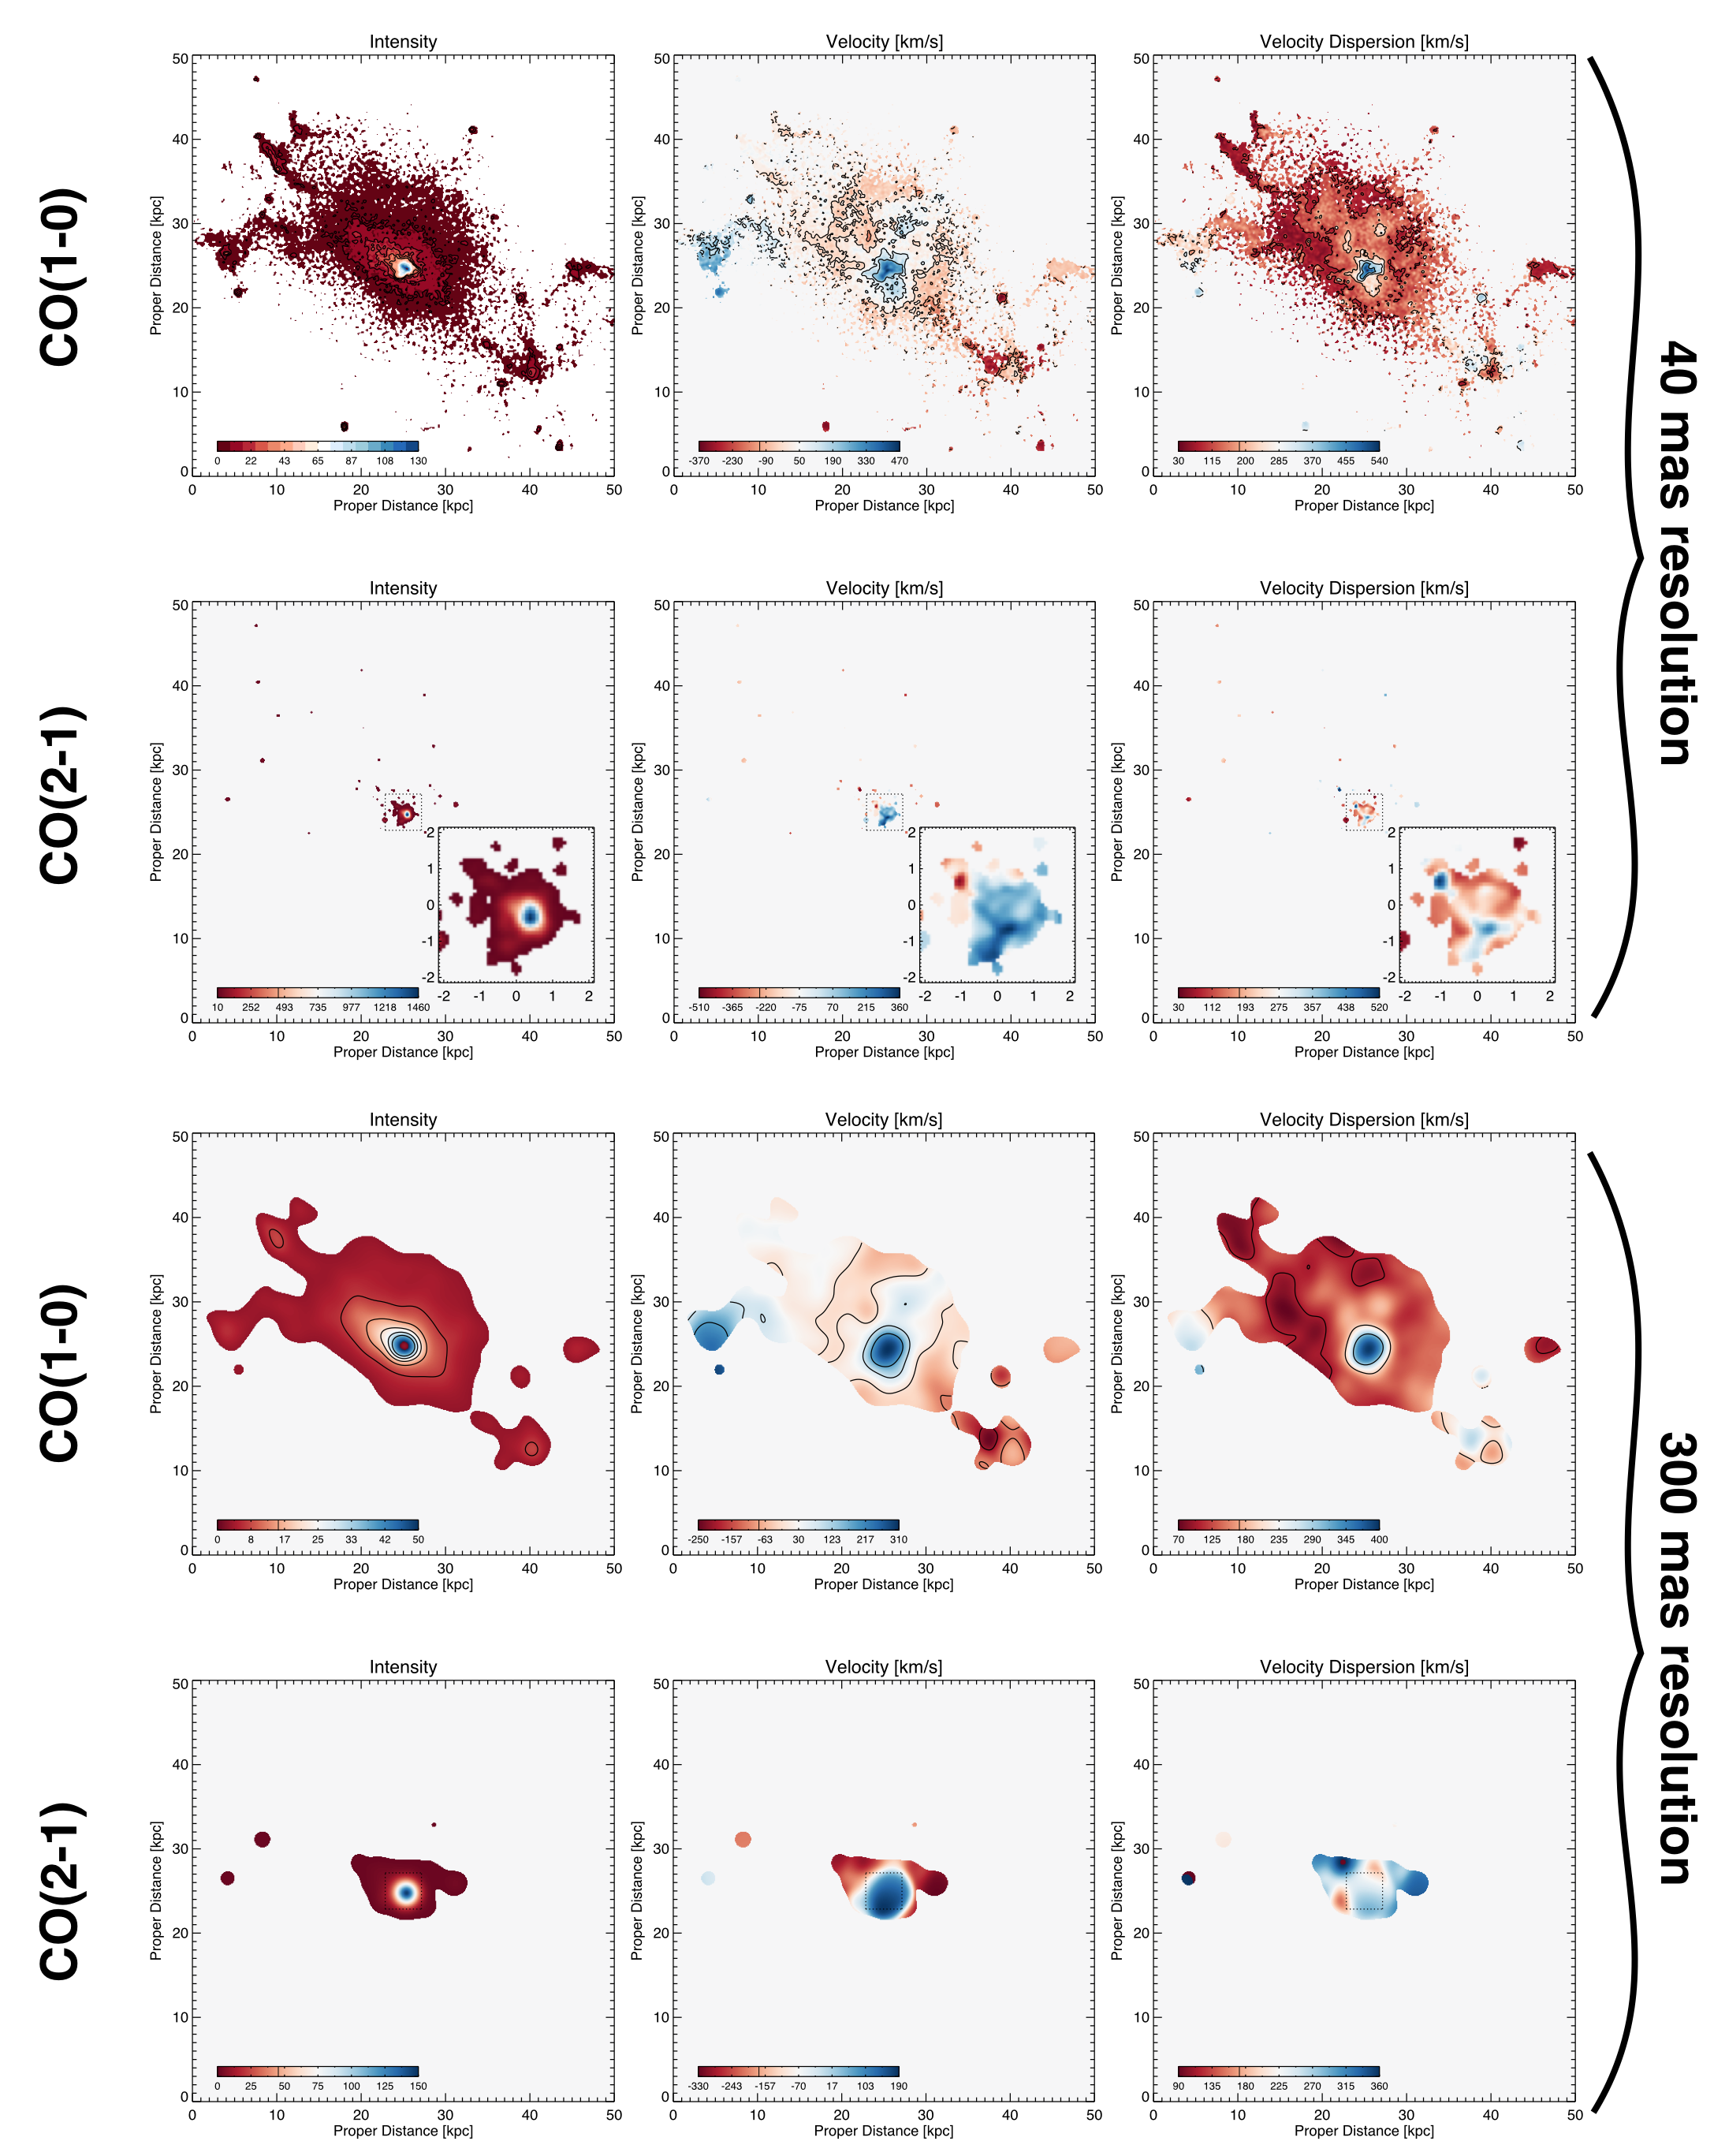
The kinematic breakdown of the gas in this galaxy is shown at two different angular resolutions in both CO(1-0) and CO(2-1) in Figure 4. The simulated kinematic breakdown in CO(4-3) is very similar to the CO(2-1) profile. All diagrams are limited to a dynamic range of 150 from peak intensity, which not only mimics realistic user-limited depths of future datasets, but avoids complex calibration needed for high dynamic range interferometric datasets. In other words, even though there is an extended component of emission in CO(2-1) and higher J transitions, they are unlikely to be detected given the significant surface brightness discrepancy between the core and extended disk, as shown in Figure 3. The first two rows show the gas profile at 40 mas resolution, equivalent to a physical resolution scale of 270 pc at this redshift. Without any simulated noise, these diagrams represent the intrinsic kinematic structure of the simulated galaxy. Certainly the complexity of the gas reservoir is quite clear: this system is not a smoothly rotating disk, but rather a turbulent, gas-rich, dispersion dominated system. The difference between the kinematic profiles in CO(1-0) vs CO(2-1) is striking. The compact CO(2-1), which would only be observable on spatial scales 1′′, probes the galaxy’s core on 2-3 kpc scales. Though one would conclude that this galaxy is dominated by gas turbulence from both CO(1-0) and CO(2-1) kinematics, only the CO(1-0) data shed light on the more diffuse gas on large physical scales.
The third and forth rows of Figure 4 show lower resolution maps of the same kinematic structure, with a 0′′.3 beam. It is reassuring that the underlying kinematics are intact at this low resolution, and the same physical conclusions would be reached in analyzing these maps as those with much higher spatial resolution: that the system is dispersion dominated. While the two views of this system at different resolutions may provide consistent interpretations, it is important to emphasize that work on artificially redshifting high-SNR, high-resolution galaxy CO data cubes to the same resolution and SNR as typical high- galaxies has shown that it is easy to draw different conclusions as to the physical drivers of a galaxy’s evolution (Hung et al., 2015). Much like the higher resolution images, the CO(2-1) fails to probe the total underlying gas reservoir.
3 Simulating Observables with CASA
We pass the simulated position-position-velocity maps (with very high spatial resolution and velocity resolution) through CASA to simulate the imaging capabilities of the ngVLA. Imaging for these high-redshift galaxies is needed on 0′′.1 scales and so does not require the extremely long ngVLA baselines. However, diffuse gas emission on large scales is of general interest and so the more compact baselines, in concert with the extended baselines on the plateau, will be crucial to the recovery of good image quality.
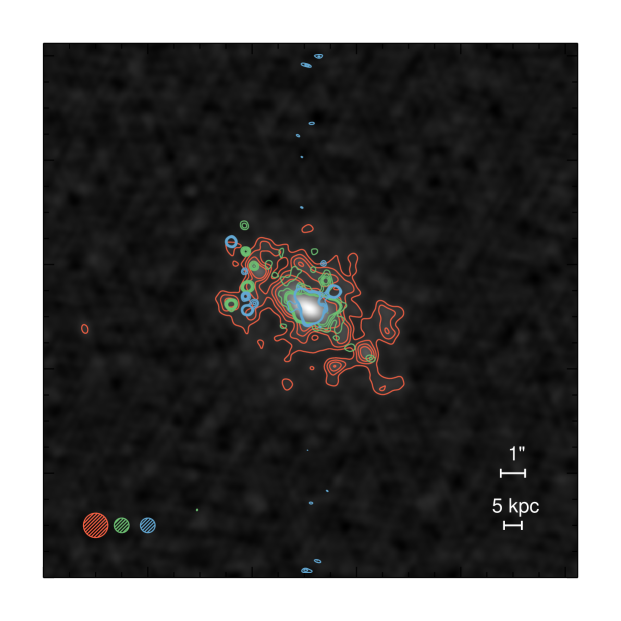
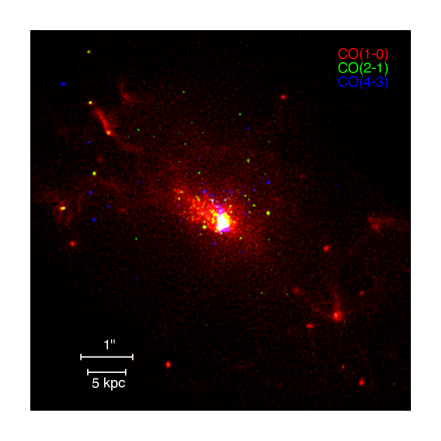
Figure 5 shows a direct comparison between the observable molecular gas reservoir in the three transitions and tri-color and the underlying intrinsic gas distribution. The mock ngVLA observations mimic the simulated data, also showing the extended reservoir of CO(1-0) beyond the core that is quite luminous in CO(2-1) and CO(4-3). The ngVLA images also show detection of several knots of higher-J CO emission, which trace smaller molecular gas complexes in the galaxy’s halo.
4 Kinematically Distinct Gas Reservoirs
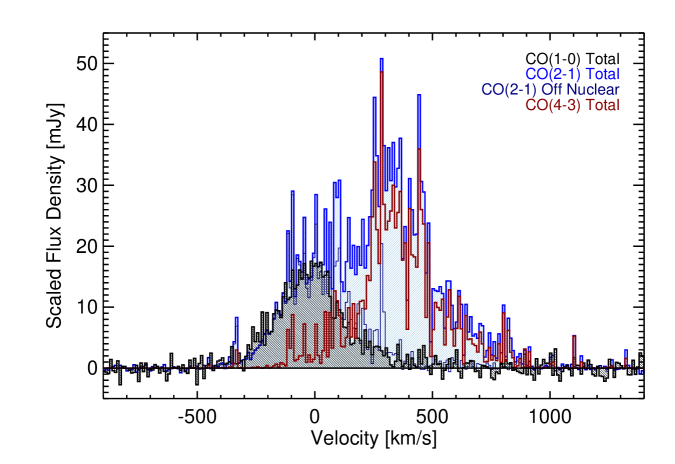
In this particular case study, the moment zero line intensity maps shown above already highlight fundamental differences between different CO tracers in a high-z starbursting system. However, these differences are not isolated to the spatial extent of the gas. Figure 6 shows the spectra for each of the three lines and highlight how they are also kinematically distinct. The ground-state transition of CO, extended 13 kpc along the semi-major axis of the galaxy, is centered on 0 km/s with a 300 km/s FWHM. CO(2-1) exhibits a very different kinematic signature, comprised of two components – gas that is kinematically aligned with the CO(1-0) emission and gas that is substantially offset at +350 km/s, as well as significantly brighter. Higher-J lines, like the ALMA-observed CO(4-3) traces only this offset component, which is perfectly aligned with the galaxy’s nucleus.
This has very important implications on deriving dynamical masses, inferring kinematics of galaxies, and measuring gas masses, depletion times, and star-formation efficiencies for galaxies at high-z, because the vast majority of high-z galaxies are and will be characterized by their high-J CO tracers, and not CO(1-0). This demonstrates a key need for the ngVLA: tracing the fundamental cold gas reservoir in high-z galaxies as a core focus of extragalactic astrophysics.
Acknowledgments
This work was completed with the generous support of the National Radio Astronomy Observatory next generation VLA community students program grant. CMC, JBC, and CLH thank UT Austin for support through the College of Natural Sciences.
References
- Bothwell et al. (2013) Bothwell, M. S. et al. 2013, ApJ, 779, 67.
- Bothwell et al. (2010) Bothwell, M. S. et al. 2010, MNRAS, 405, 219.
- Carilli (2015) Carilli, C. 2015, Advancing Astrophysics with the Square Kilometre Array (AASKA14), 171.
- Carilli & Walter (2013) Carilli, C. L. and Walter, F. 2013, ARA&A, 51, 105.
- Casey et al. (2015) Casey, C. M. et al. 2015, ArXiv e-prints.
- Davé et al. (2017) Davé, R. et al. 2017, MNRAS, 467, 115.
- Davé, Thompson & Hopkins (2016) Davé, R., Thompson, R., and Hopkins, P. F. 2016, MNRAS, 462, 3265.
- Engel et al. (2010) Engel, H. et al. 2010, ApJ, 724, 233.
- Hodge et al. (2012) Hodge, J. A. et al. 2012, ApJ, 760, 11.
- Hodge et al. (2016) Hodge, J. A. et al. 2016, ApJ, 833, 103.
- Hung et al. (2015) Hung, C.-L. et al. 2015, ApJ, 803, 62.
- Ivison et al. (2012) Ivison, R. J. et al. 2012, MNRAS, 425, 1320.
- Krumholz (2014) Krumholz, M. R. 2014, MNRAS, 437, 1662.
- Narayanan et al. (2018) Narayanan, D. et al. 2018a, ArXiv e-prints.
- Narayanan et al. (2018) Narayanan, D. et al. 2018b, MNRAS, 474, 1718.
- Narayanan & Krumholz (2017) Narayanan, D. and Krumholz, M. R. 2017, MNRAS, 467, 50.
- Solomon & Vanden Bout (2005) Solomon, P. M. and Vanden Bout, P. A. 2005, ARA&A, 43, 677.