Phase separation and effect of strain on magnetic properties of Mn3Ga1-xSnxC
Abstract
While the unit cell volume of compounds belonging to the Mn3Ga1-xSnxC, (0 1) series shows a conformity with Vegard’s law, their magnetic and magnetocaloric properties behave differently from those of parent compounds Mn3GaC and Mn3SnC. A correlation between the observed magnetic properties and underlying magnetic and local structure suggests that replacing Ga atoms by larger atoms of Sn results in the formation of Ga-rich and Sn-rich clusters. As a result, even though the long range structure appears to be cubic, Mn atoms find themselves in two different local environments. The packing of these two different local structures into a single global structure induces tensile/compressive strains on the Mn6C functional unit and is responsible for the observed magnetic properties across the entire solid solution range.
pacs:
75.30.Sg; 61.05.cj; 75.30.KzI Introduction
Doping in a compound is generally used as an effective strategy to improve or even completely change properties of a material. Doping creates a local positive or negative pressure, known as chemical pressure which alters the interatomic distances, bond angles or even the crystal structure of a material affecting its properties. Even in Mn based antiperovskites of type ABMn3 which exhibit a variety of phase transitions and technologically significant phenomena, doping has been used quite effectively to improve the properties or render a material functional Takenaka and Takagi (2005); Takenaka et al. (2008); Lin et al. (2018); Iikubo et al. (2008); Kodama et al. (2010); Lin et al. (2015); Zhang et al. (2014); Lin et al. (2012); Li et al. (2011); Lin et al. (2014); Shao et al. (2015); Born et al. (2018); Wang et al. (2011); Sun et al. (2010); Wang et al. (2009a); Sun et al. (2009).
Among these geometrically frustrated compounds that adopt the cubic (Space group: Pmm) structure, antiperovskites Mn3GaC and Mn3SnC exhibiting first order, volume discontinuous magnetostructural transitions (at ) have been studied for their giant magnetocaloric properties . Çakir and Acet (2012); Wang et al. (2009b). While both compounds are known to exhibit ferromagnetic (FM) as well as antiferromagnetic (AFM) orders, a remarkable contrast observed in their magnetostructural properties Fruchart and Bertaut (1978) extended the interest in these materials. Recent reports suggest that the discrepancies basically arise from distortions that are restricted to the local structure surrounding the Mn6C octahedra Dias et al. (2017a, 2015). In particular, x-ray absorption fine structure spectroscopy (XAFS) study on Mn3GaC illustrated a splitting of the Mn–Mn correlation into long and short bond distances. While the longer Mn–Mn bond distances aid the ferromagnetic transition ( = 242 K) from a room temperature paramagnetic (PM) state in Mn3GaC, an abrupt decrease in the shorter Mn–Mn distances at = 178 K explains the first order magnetostructural transition to the AFM ground state described by propagation vector = []Fruchart et al. (1970); Dias et al. (2017a).
On the other hand Mn3SnC, though it exhibits a single volume discontinuous transition from the PM state to a state with complex magnetic order at about 279 K, time dependent magnetization measurements at the first order transition temperature illustrate an early development of FM order on all three Mn spins along the 001 direction followed by a flipping of spins of two of the Mn atoms to give an additional AFM order at a later time Çakir . et al. (2017). Local structure reports have demonstrated that the Mn6C octahedron in Mn3SnC elongates along one direction and shrinks along the other two while preserving the overall cubic symmetry of the unit cell. As a result, the magnetic propagation vector changes to = [] and allows the existence of AFM order along with a weak FM component l’Héritier et al. (1977); Dias et al. (2015).
Such a difference in properties of isostructural Mn3GaC and Mn3SnC can be attributed to the size of A-site atom (Ga and Sn). Larger Sn atoms create a chemical pressure on the Mn6C functional unit to alter the nature of magnetic properties. To further understand the role of the A-site atom in the magnetostructural transition in such antiperovskites, a study of the evolution of the magnetic transformations was carried out using solid solutions of the type Mn3Ga1-xSnxC, (0 1) Dias et al. (2014a). Herein, though the unit cell volume of the doped compounds, at room temperature, showed a conformity with Vegard’s law, their magnetic and magnetocaloric properties behave differently. Increase in cell volume causes the functional units to experience a negative chemical (tensile) pressure in Mn3GaC whereas a positive chemical (compressive) pressure is experienced by Mn6C octahedra in Mn3SnC with Ga doping. Taking a cue from pressure studies on Mn3GaC and Mn3SnC, Sn doping in Mn3GaC, should result in a decrease of and an increase in while a decrease in should be observed due to Ga doping in Mn3SnC Bouchaud et al. (1966); Shao et al. (2015); Jing-Yu et al. (2012). Though a decrease in is observed upon Sn doping in the Ga-rich compositions (), follows a opposite trend. In the Sn-rich compositions () Ga doping results in expected decrease in . However, the compounds with intermediate concentrations () present signatures of more than one type of magnetic order Dias et al. (2014a). Presence of a magnetic phase separation was indeed shown in Mn3Ga0.45Sn0.55C Dias et al. (2017b). The magnetic phase separation occurs due to different local structures of the Mn atoms residing in Ga-rich and Sn-rich regions. However, there are still some unanswered questions. Why are the magnetic and magnetocaloric properties of phase separated Mn3Ga1-xSnxC compounds completely different from those of Mn3GaC or Mn3SnC? and Is this magnetic phase separation limited only to intermediate doping region or is it over the entire solid solution range? Therefore it is pertinent to study the underlying magnetic structure and local structure around the constituent atoms and correlate them with the magnetic properties of these solid solutions. In the present study, using neutron diffraction and x-ray absorption fine structure techniques, we show that even in low doping region of Sn in Mn3GaC or Ga in Mn3SnC, the local structure around Mn can be differentiated into two types, one similar to that in Mn3GaC and other to Mn3SnC. The packing of different local structures into a single global structure results in tensile/compressive strain in the two local structures. Thus the local phase separation is responsible for the observed magnetic properties of Mn3Ga1-xSnxC over the entire solid solution range.
II Experimental
Synthesis of polycrystalline Mn3Ga1-xSnxC, (0 1) samples using the solid state reaction technique first involved mixing of stoichiometric weights of Mn, Ga, Sn and C with excess graphite powder (about 15 wt.%) as described in Ref. [Dias et al., 2014a]. This was followed by pelletising and annealing the resulting mixtures in evacuated quartz tubes at 1073 K and 1150 K Dias et al. (2014a). On cooling to room temperature, the compounds were characterized for their phase formation and purity by x-ray diffraction (XRD) using Cu Kα radiation. Magnetization measurements as a function of temperature were carried out between the 5 K to 300 K temperature range during the zero field cooled (ZFC) and field cooled cooling and warming (FCC and FCW) protocols in an applied field of H = 0.01 T. Neutron diffraction experiments as a function of temperature were performed between 6 K and 300 K on the PD2 neutron powder diffractometer ( = 1.2443 Å) at the Dhruva Reactor (Bhabha Atomic Research Center, Mumbai, India) on three of the samples, each belonging to (a) Ga-rich region (), (b) intermediate region () and (c) Sn-rich region (). The diffraction patterns were Rietveld refined using the FULLPROF suite software package Carvajal (1993); Rodríguez-Carvajal . In order to extract the magnetic contribution more precisely, neutron diffraction experiments were also performed on E6 diffractometer at BER-II reactor (Helmholtz Zentrum Berlin) using neutrons of 2.4 Å. Extended x-ray absorption fine structure (EXAFS) spectra were recorded in transmission mode at the Mn (6539 eV), Ga (10367 eV) and Sn (29200 eV) K edges using beamlines BL-9C, NW10A at Photon Factory, Japan and P-65 beamline at PETRA-III synchrotron source, DESY, Hamburg, Germany for a few samples spanning over the entire range of solid solution Mn3Ga1-xSnxC. The data were fitted to theoretically modeled spectra using the Demeter program Ravel and Newville (2005).
III Results and Discussion
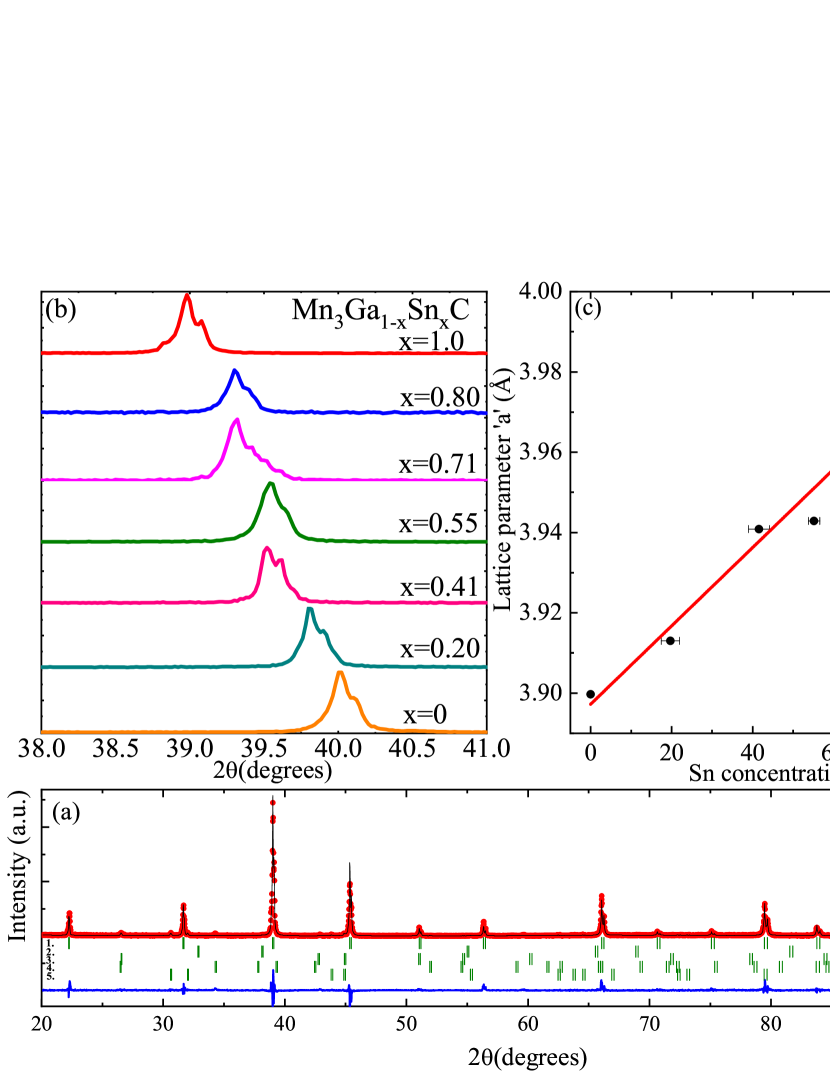
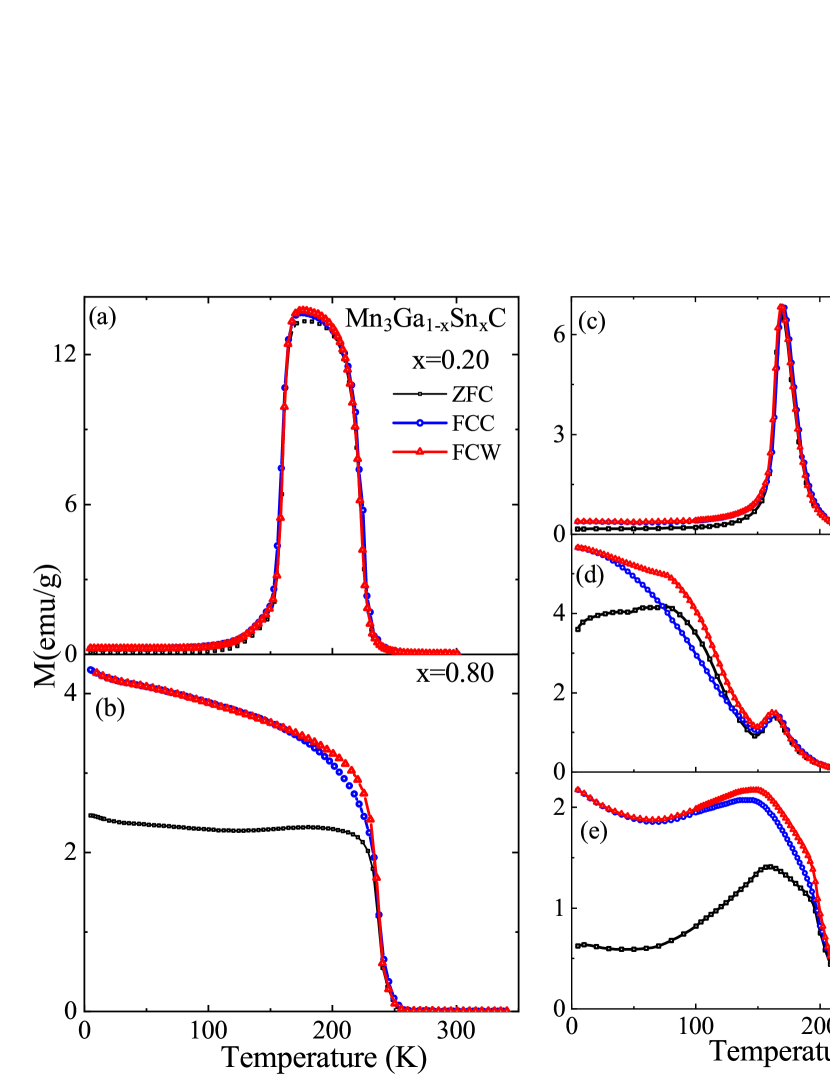
All the compounds under study crystallized in a cubic phase within the space group and have been reported earlier in Ref. Dias et al. (2014a). The antiperovskite structure has Ga or Sn atoms occupying the Wyckoff position at the corners of the cube while Mn atoms occupy the face centered positions forming a corner sharing Mn6C octahedra with the C atom positioned at the center ( position) of the cube Howe and Myers (1957); Bouchaud et al. (1966). The Rietveld refined diffraction pattern for one of the members of the series, Mn3Ga1-xSnxC ( = 1) is displayed in Fig. 1(a) for clarity. The evolution of maximum intensity peak with changing values of is shown in Fig. 1(b). A clear shift to higher values of 2 can be seen as the value of decreases from 1 to 0. The corresponding change in the unit cell volume presented in Fig. 1(c) also shows a conformity with Vegard’s Law. Such an evolution of lattice volume clearly indicates presence of compressive stress on Mn3SnC or a tensile stress on Mn3GaC. Hence the variation of magnetic properties with doping should have been similar to those observed under pressure. However, the temperature dependent magnetization measurements in Fig. 2 present a completely different picture.
It can be seen that the Ga-rich compound, ( = 0.2), has magnetization similar to Mn3GaC (Fig. 2(a)) while the Sn-rich compound, ( = 0.8) exhibits similarity with magnetization behavior of Mn3SnC (Fig. 2(b)). The intermediate compositions, (0.41 0.71) whose magnetization behaviors are presented in Figs. 2(c), 2(d) and 2(e) highlight the coexistence of two magnetic phases.
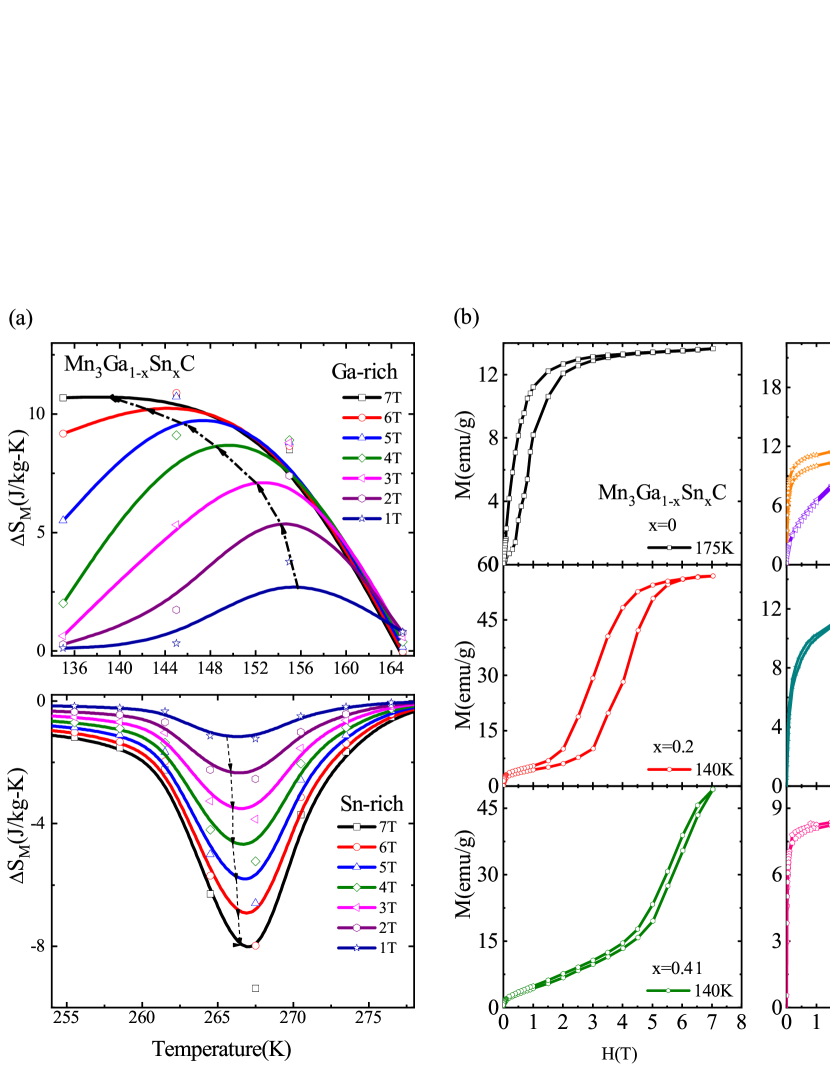
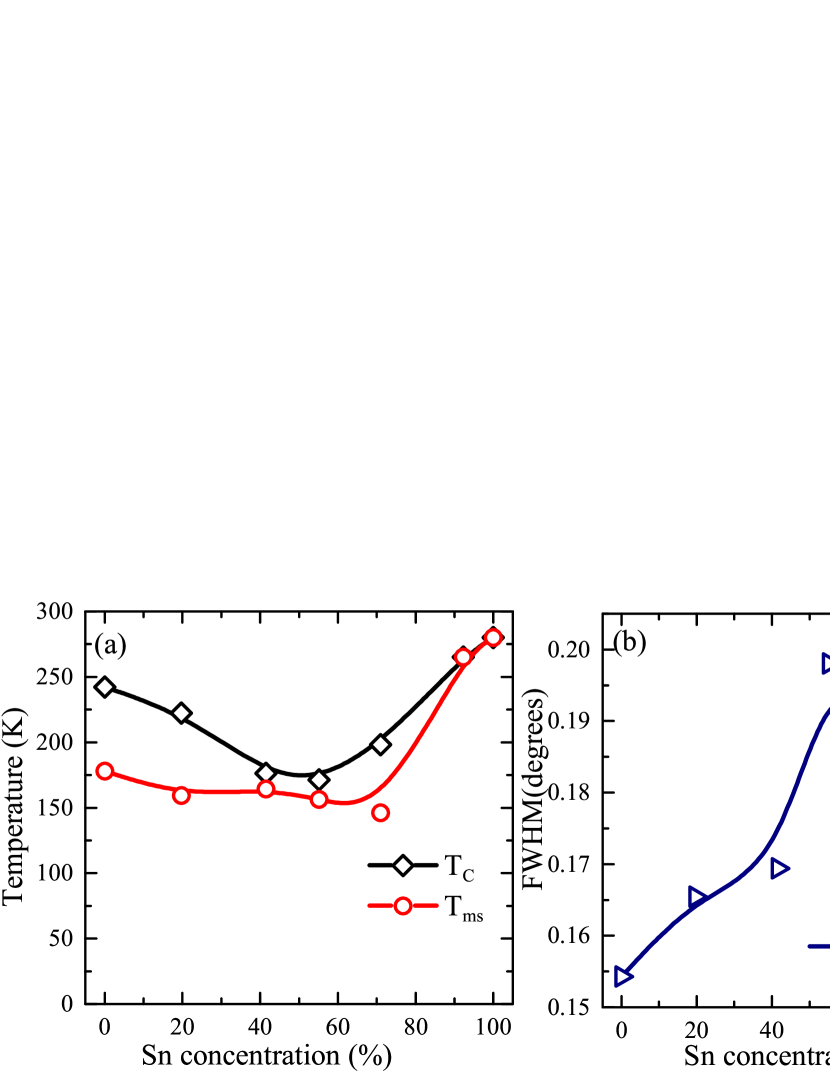
Further, as observed in Fig. 3(a) the magnetocaloric properties of Mn3Ga1-xSnxC also show a change in character with addition of Sn for Ga. Detailed analysis in Ref. [E. T. Dias and K. R. Priolkar and . Çakir. and M. Acet, and A. K. Nigam, 2015] attributes these changes to strain on the Mn6C octahedra due to comparatively larger Sn in place of Ga atom at the A-site. This strain is also believed to affect the metamagnetic transition seen in Mn3GaC Dias et al. (2014b, 2017a). With increasing Sn doping, Fig. 3(b)illustrates requirement of a higher and higher magnetic field to induce the metamagnetic transition indicating increase in stiffness of the Mn6C octahedra with increasing Sn doping E. T. Dias and K. R. Priolkar and . Çakir. and M. Acet, and A. K. Nigam (2015). The stiffness will affect the ferromagnetic and antiferromagnetic interactions present in these Sn doped Mn3GaC compounds. The values of the magnetic transition temperatures are plotted in Fig. 4(a). It can be seen that with Sn doping in Mn3GaC, decreases rapidly, while the first order antiferromagnetic transition temperature, shows only a marginal decrease from 175 K in = 0 to 155 K in = 0.55. On the Sn-rich side, decreases quite rapidly (about 30 K per 10% change in concentration) with increasing Ga substitution. It has been shown earlier that Mn3Ga0.45Sn0.55C presents a magnetically phase separated ground state consisting of Ga-rich and Sn-rich regions Dias et al. (2017b). Despite such a ground state, its magnetostructural transition temperature of 155 K is quite different from that of Mn3GaC ( = 175 K) and Mn3SnC ( = 279 K) due to strain experienced by these Ga-rich and Sn-rich regions. Presence of strain is because Mn3Ga0.45Sn0.55C has a single phase cubic crystal structure with lattice parameter distinctly different from Mn3GaC and Mn3SnC. Such a lattice strain is present across the entire solid solution range is confirmed from the plot of width (FWHM) of main diffraction peak as a function of Sn content in Fig. 4(b). It can be seen that the width of the diffraction peaks of the two end members is minimum and increase with doping on the either side and reaches a maximum value around = 0.6. To understand the cause of this lattice strain as well as its effect on long range magnetic ordering, XAFS and neutron diffraction studies on some of the members of this series have been carried out.
Neutron diffraction patterns at several temperatures in the range 6 K to 300 K were recorded and analyzed for three representative compounds, each belonging to the three regions, Ga-rich ( = 0.2), Sn-rich ( = 0.8) and intermediate region ( = 0.55) using neutrons of wavelength = 1.2443 Å. Additionally in case of = 0.55 compound, neutron diffraction patterns were also recorded using longer wavelength neutrons ( = 2.4 Å) in the temperature range of 2 K – 300 K and especially with a close temperature interval between 2 K – 50 K. Rietveld refinement of 300 K neutron diffraction patterns belonging to all the three compounds confirmed the structure to be cubic with space group and yielded lattice parameters similar to those obtained from x-ray diffraction experiments.
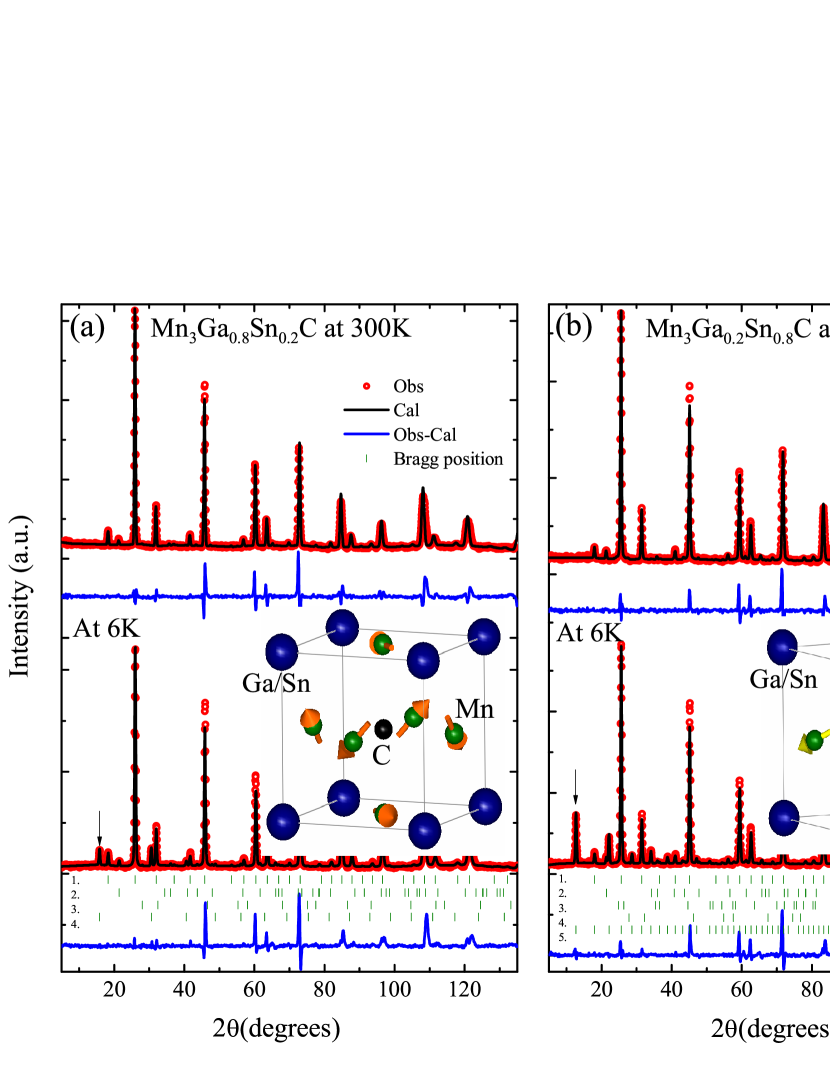
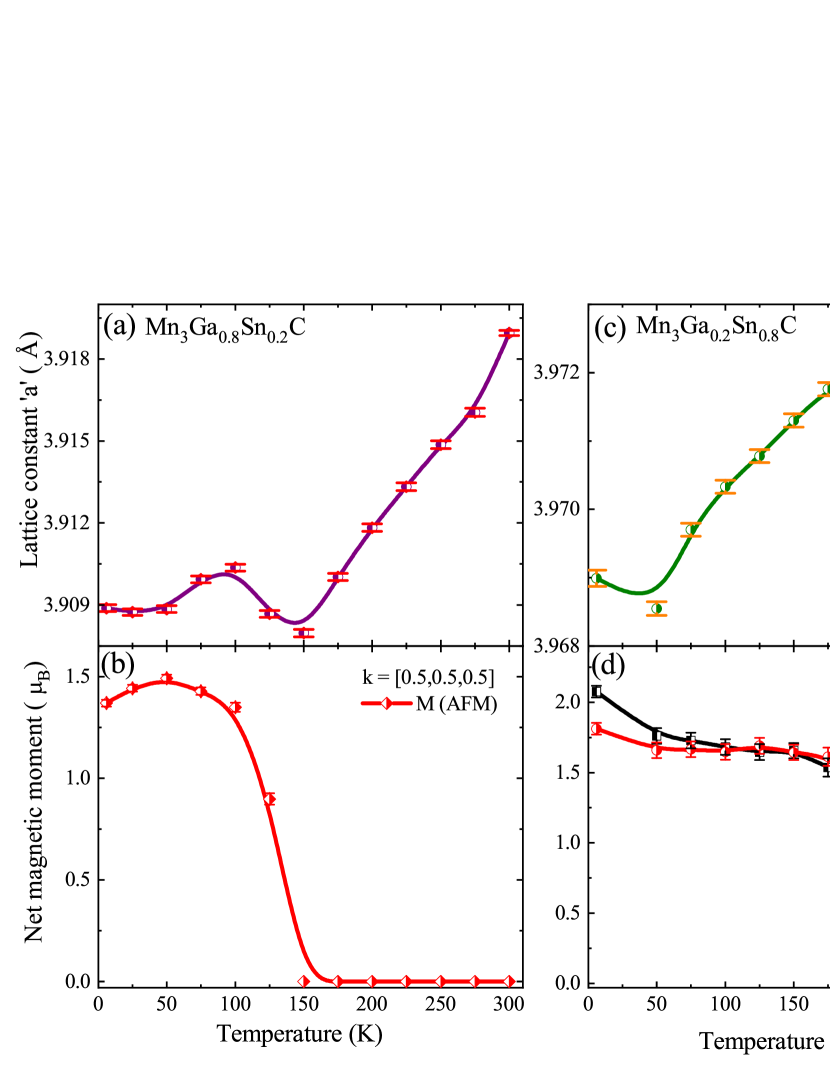
A comparison between 300 K and 6 K diffraction patterns of = 0.2 and = 0.8 compounds in Fig. 5 emphasizes on the presence of magnetic reflections that are associated with magnetic structures developing below their respective ordering temperatures. Fixing the magnetic reflections to an absolute scale determined by nuclear reflections in the chemical unit cell at 300 K, a systematic study of the thermal evolution of lattice parameters and magnetic moments was carried out for both the compounds. Predictably, the search for a suitable magnetic propagation vector ( vector) and corresponding magnetic model that results in an excellent fit to the strongest magnetic Bragg peak (2 = 15.8∘) in the Ga-rich sample at 6 K gave rise to the magnetic structure pictorially represented as an inset in Fig. 5(a). Clearly, the structure generated by propagation vector having ferromagnetic layers stacked antiferromagnetically along the [111] direction and a net AFM moment of 1.37 0.02 per Mn atom is comparable with the structure reported for Mn3GaC in zero applied field Fruchart and Bertaut (1978); . Çakir et al. (2014). Effect of doped Sn atom is mainly seen on the orientation of Mn spins. Compared to Mn3GaC, wherein Mn moments have all three, Mx, My and Mz components, in = 0.2 compound, the Mn moments are oriented within the respective planes and thus have only two of the three magnetic components. The thermal variations in refined lattice parameter and ordered magnetic moment presented in Fig. 6(a) highlight the existence of a magnetostructural transition. With decreasing temperature, the lattice constant decreases linearly down to 150 K with a slight change of slope near = 250 K marking the onset of a transition from the PM–FM state. With further decrease in temperature, an abrupt increase in lattice parameter ( 0.06%) accompanied by simultaneous appearance of the ordered AFM moment in Fig. 6(b) illustrates the reported Dias et al. (2014a) first order transition from a low volume FM state to a higher volume AFM state. Once the AFM phase is established, the lattice parameter shows no further variation with decrease in temperature.
A similar approach of adopting a larger magnetic unit cell generated by the propagation vector that describes the magnetic structure of Mn3SnC resulted in a good fit to the most intense magnetic Bragg peak (2 =12.7∘) of the Sn-rich sample. The complex magnetic structure obtained at 6 K and depicted within the chemical unit cell in the inset of Fig. 5(b) has spins on two of the Mn (indicated by yellow arrows) atoms arranged in a square plane to give a net antiferromagnetic moment of 2.08 0.04 . The spin on the third Mn atom (indicated by red arrows) has a slightly canted FM alignment in the crystallographic unit cell and a net moment of 1.81 0.04 . Here there are significant changes not only in the orientation of Mn moments but also in their magnitudes. In Mn3SnC, the Mn(2) moments were ferromagnetic and oriented along the 001 direction with a magnitude of 0.7 , while in the case of Mn3Sn0.8Ga0.2C they are tilted away from the axis resulting in canted arrangement along the direction, resulting in a net ferromagnetic moment of at 6 K. This net ferromagnetic moment also explains the rise in magnetization below (see Fig. 2(a)) whereas the compressive strain produced by smaller Ga leads to a change in spin alignment. The thermal evolution of the Sn-rich cell parameter is very similar to that of Mn3SnC. Fig. 6(c) shows that the monotonous decrease in down to 225 K is followed by an abrupt increase of about 0.08%, characteristic of the first order magnetic transition from the PM to a complex magnetically ordered ground state. Magnetic moments for both Mn1 and Mn2 atoms also appear at the same temperature as the lattice anomaly as shown in Fig. 6(d).
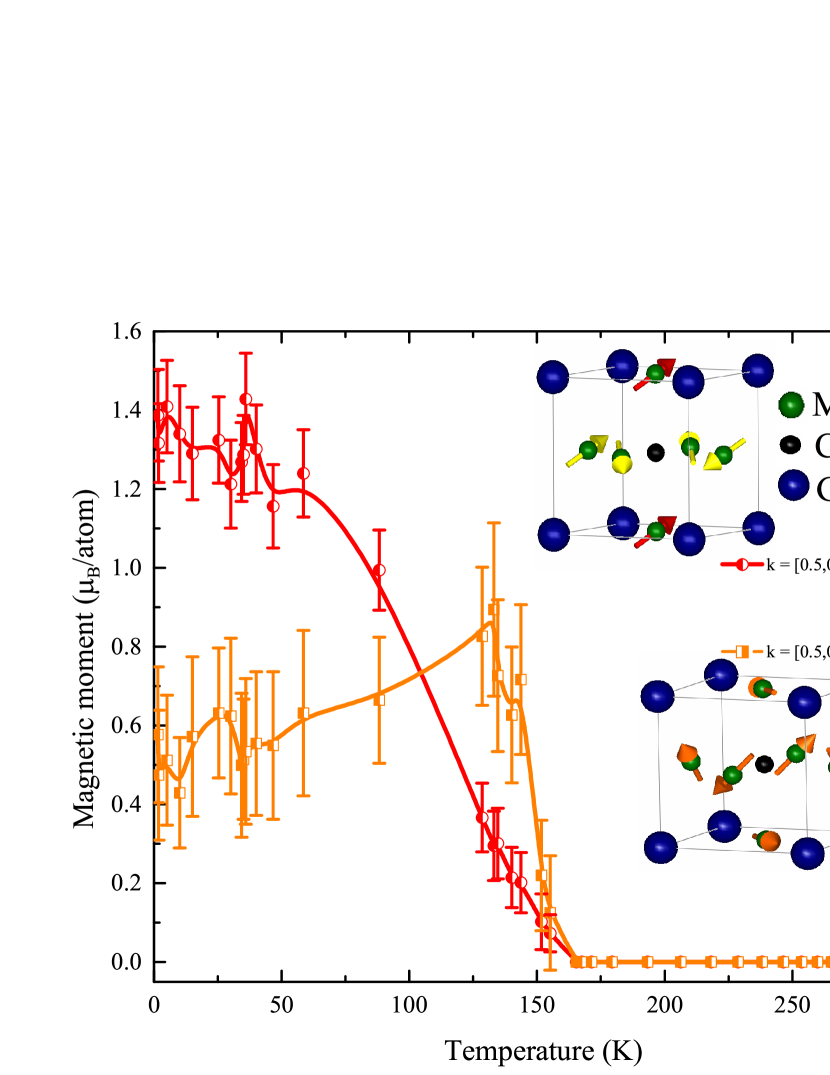
Neutron diffraction measurements on = 0.55 though were reported earlier Dias et al. (2017b), have been repeated again on a powder diffractometer with a better resolution (E6 at HMI, Berlin) and at a much closer temperature interval especially in the temperature range from 2 K to 50 K as 30 K was identified as the cluster glass transition temperature Dias et al. (2017b). The need of second set of measurements on = 0.55 arose in order to understand its completely different bulk magnetic properties compared to the two end members, despite sustaining two independent magnetic spin alignments identical to that in Mn3GaC and Mn3SnC respectively. However, not much difference was noticed between the two neutron diffraction studies performed at Dhruva earlier Dias et al. (2017b) and HMI Berlin. Two long range AFM orders, described by propagation vectors and respectively appear at the same temperature ( = 155 K) concomitant with abrupt change in lattice volume. The magnetic moments estimated from these measurements are presented in Fig. 7 which is more or less similar to that reported earlier Dias et al. (2017b). Magnetic moment evolution of the two magnetic phases also do not show any significant change from the previous measurements and especially around the reported cluster glass transition temperature of = 30 K. This indicates that the dip in magnetization obtained in bulk magnetic measurements is indeed due to a glassy transition and not due to any magnetic interaction between the two magnetic phases.
Despite solving magnetic structures, the exact cause of strain and its effect on the magnetic properties of the doped compounds, especially those belonging to the intermediate region is still unclear. Since all compounds crystallize in a single cubic phase implying long range order, the key to understanding strain and its effect on magnetic properties could be in studying the local structures around the metal atoms. Therefore to investigate the role of short range interactions in these compounds, temperature dependent EXAFS spectra recorded at the Ga, Sn and Mn K edges in few select compounds were independently analyzed. At first, contributions from the various near neighbor atoms at different distances were isolated by Fourier transforming the weighted XAFS signal from to space. While considering Ga or Sn as the absorbing atom, scattering from the eight nearest Mn atoms in the first coordination shell at bond distance R′ 2.8 Å is well separated from all other correlations (Ga–C/Sn–C at R′ 3.38 Å and Ga–Ga/Sn–Sn at R′ 3.90 Å) and solely contribute to the main peak centered around phase uncorrected radial distance R 2.5 Å in Figs. 8 (a) and 8 (b). Analysis of Ga or Sn K XAFS are effective in unambiguously providing Ga/Sn–Mn bond distance.
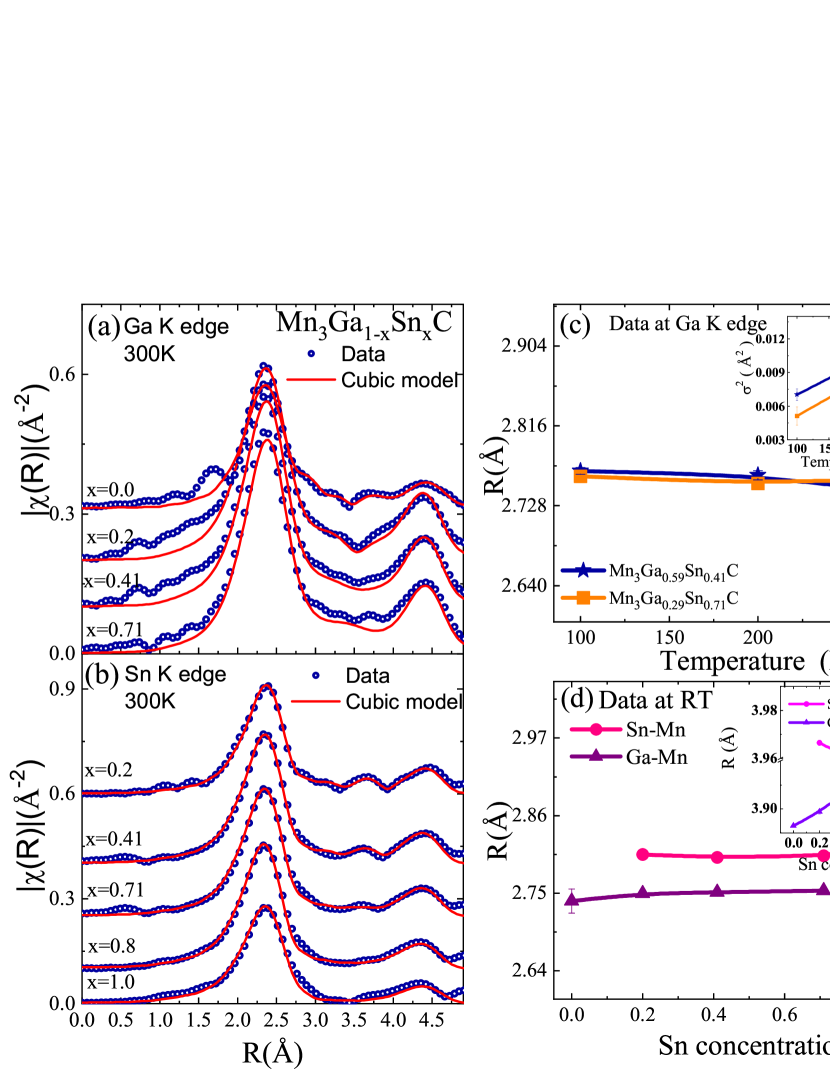
The analysis of Ga and Sn K XAFS indicates two interesting aspects. Firstly, the cubic long range order requires Ga–Mn and Sn–Mn bond distances to be equal in a given compound. Secondly, the Vegard’s law behavior of lattice constants demands an increase in Ga–Mn or Sn–Mn distance with . However, the obtained Ga–Mn distances for = 0.2, 0.41 and 0.71 are nearly equal to Ga–Mn distance in Mn3GaC (2.74 Å) as illustrated in Fig. 8(d). Similarly the Sn–Mn distance in all the doped compounds studied here is 2.81 Å which is equal to the Sn–Mn distance in Mn3SnC. From the context of XAFS, such a situation suggests that local symmetry is maintained even though the compounds possess long range structural order. Another interesting aspect is that the Ga– Mn and Sn–Mn bond distances show negligible temperature dependence across the magnetostructural transition but the mean-square relative displacement () in these distances do show an abrupt increase at the first order transitions as can be seen in the inset of Fig. 8(c).
Further the nonequivalence of Ga–Mn and Sn–Mn bond distances in the doped compounds is also seen in Ga–Ga and Sn–Sn distances. The inset of Fig 8(d) depicts variation of Ga–Ga and Sn–Sn distances in all doped compounds along with Mn3GaC and Mn3SnC. The variation of Ga–Ga and Sn–Sn distances reflect two important aspects. First, Ga–Ga or Sn–Sn distance is the same as lattice constant and hence should have been identical to each other and to the respective lattice constants of doped compounds. Their non equivalence hints towards a possibility of existence of Ga-rich and Sn-rich regions in all doped compounds. Second, their variation with suggests that in all the doped compounds, these Ga-rich regions and Sn-rich regions try to match their lattice constants with each other in order to preserve the long range structural order. The apparent failure of the two regions to match their lattice constants as indicated by non equivalent Ga–Ga and Sn–Sn distances causes strain and it increases as one moves away from the two undoped end members.
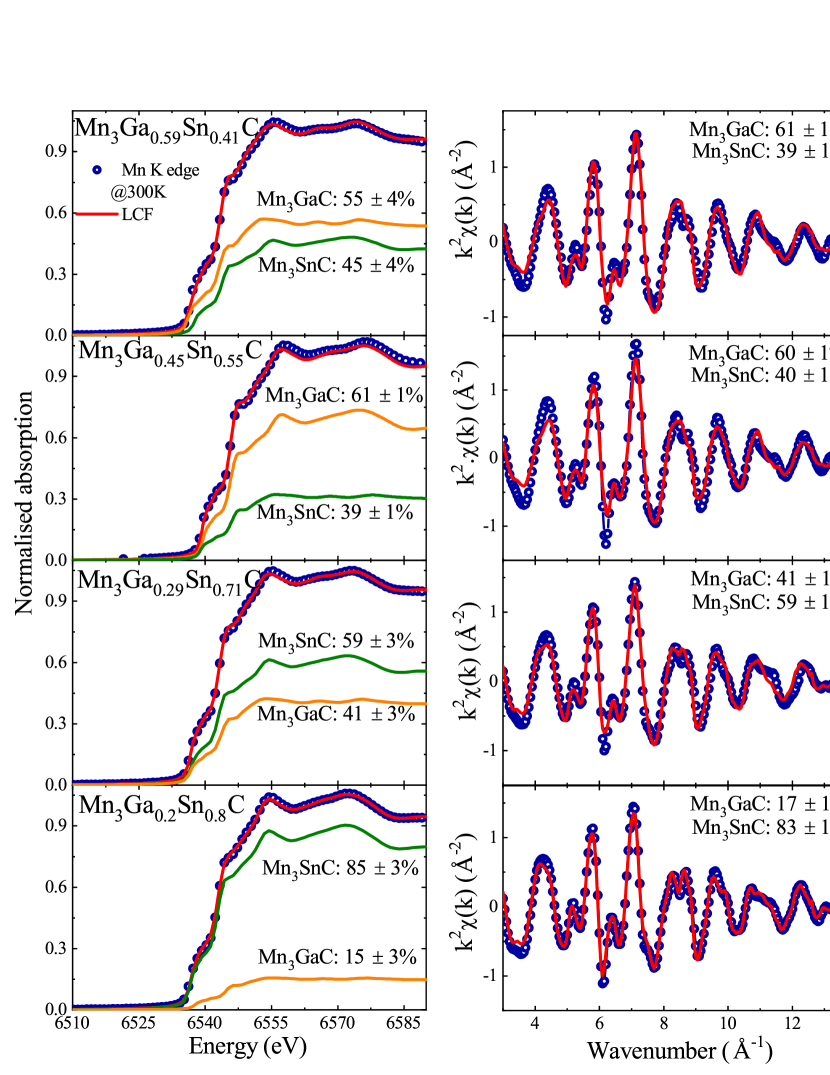
Furthermore information is revealed from the analysis of Mn K edge XAFS. It comprises of contribution from two nearest neighbor carbon atoms to the weak first peak in the Fourier transform of XAFS spectra. The second and the strongest peak has contributions of scattering from eight Mn and four Ga or Sn atoms which have the identical bond length. In any of the doped Mn3Ga1-xSnxC (0 1) compounds, the second peak therefore, will have contributions from Mn–Ga, Mn–Sn as well as Mn–Mn scattering. This makes number of fitting parameters quite large. Therefore, an attempt to understand the type of distortions present in these compounds was first made by utilizing the linear combination fitting (LCF) subroutine available in the ATHENA software package Ravel and Newville (2005). The method involves the modeling of a spectrum (LCF fit) as a sum of the constituent spectra of more than one model compounds. In the present case, experimental spectra of all doped compounds were attempted to be described as the sum of experimental spectra of Mn3GaC and Mn3SnC.
The resulting fittings to room temperature XANES spectra described in the -20 to +30 eV (with respect to the edge energy) energy range as well as XAFS spectra in the range of 3.0 – 14.0 Å-1 are shown in Fig. 9. A perfect fit to both the XANES and weighted XAFS signals recorded for all compositions using a linear combination ratio that matches the starting compositions gives further evidence to the presence of Ga-rich and Sn-rich clusters in varying proportion over the entire solid solution range.
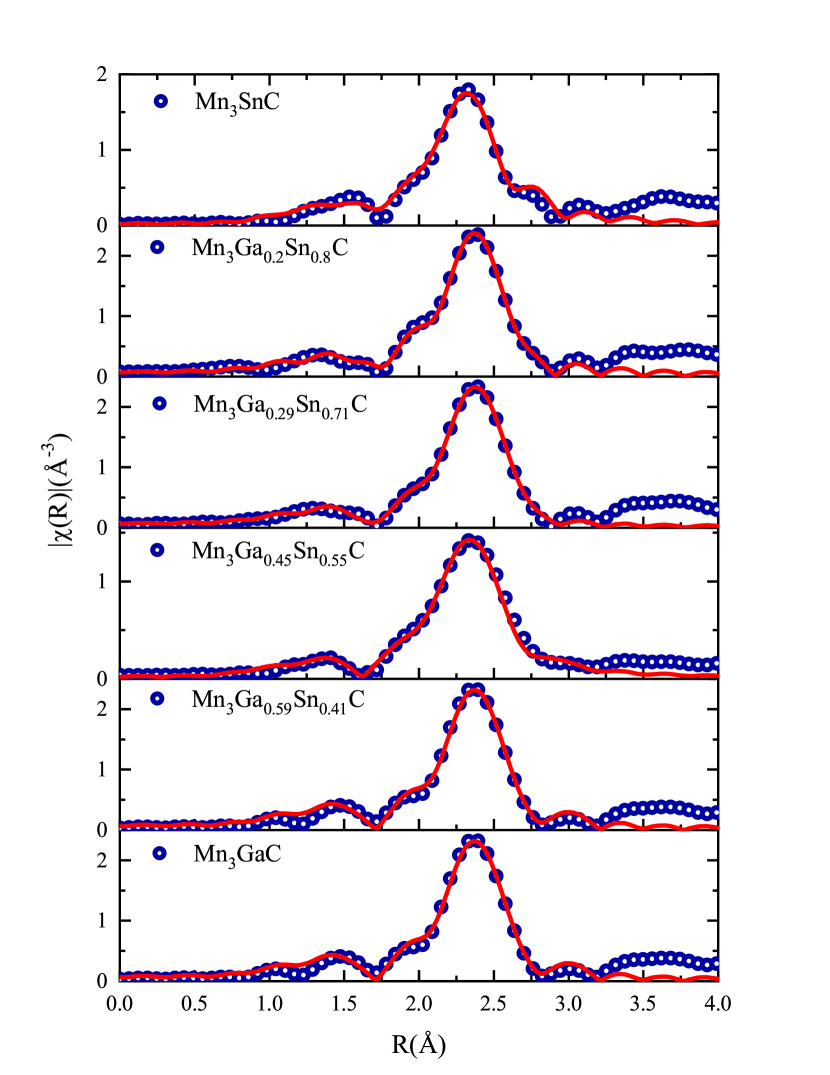
With the help of Ga–Mn and Sn–Mn distances obtained from Ga and Sn XAFS analysis respectively, all important Mn–Mn distances were obtained from fitting the Mn EXAFS up to 3 Å in space. Fittings to data taken at 100 K are shown in Fig. 10. A good fit was obtained at all temperatures for all the compounds. XAFS analysis of Mn K edge revealed that the Mn–Mn correlation in all these compounds are split into two, short and long distances.
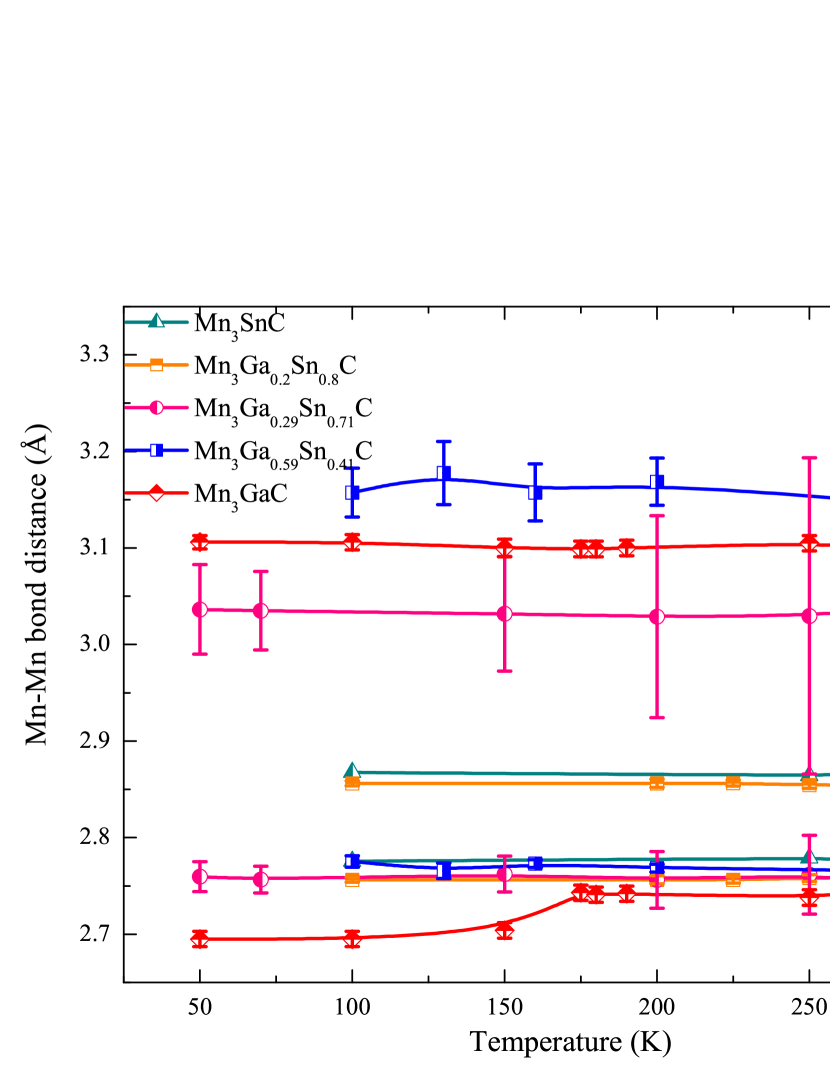
The separation between Mn–Mn long and short distances across the solid solution as well as their temperature variation is presented in Fig. 11. The separation between these long and short bond lengths seems to be dependent on effective size of the A-site atom. As can be seen from Fig. 11, the difference between Mn–Mnshort and Mn–Mnlong bond distances is largest for Ga-rich compounds (smaller effective size) and it decreases for Sn-rich compounds (bigger effective size). The larger the Mn–Mnlong bond distance ( 2.8 Å), stronger are the ferromagnetic interactions. Similarly smaller the Mn–Mnshort distance ( 2.8 Å) stronger is the antiferromagnetism. Mn3GaC which has one of the widest variation of Mn–Mn distances shows both magnetic orders and even in the antiferromagnetic state, ferromagnetism can be induced by application of magnetic field or hydrostatic pressure. In Mn3Ga0.59Sn0.41C compound, Mn–Mnlong is longest but at the same time, Mn–Mnshort is also quite small and hence it presents a strong competition between ferromagnetic and antiferromagnetic interactions. This compound neither orders ferromagnetically nor antiferromagnetically (Fig. 2(c)) but presents signatures of both orders. Sn-rich compounds ( 0.7) exhibit comparatively smaller difference between the two Mn–Mn distances and though have a high magnetic ordering temperature, but present a complex magnetic order. Here the two distances are quite close to the critical Mn–Mn distance of 2.8 Å and hence explains the complex magnetic order. The reason for differing distortions in Mn6C octahedra can also be understood from this plot. For A-site atom of smaller size like Ga, the Mn6C octahedra are less strained and therefore can distort freely resulting in larger difference between the long and short Mn–Mn distances. With increase in the effective size of A-site atom, the octahedra become more and more strained and the distortions are restricted and also result in higher magnetostructural transformation temperature.
Conclusion
In conclusion the above studies highlight the importance of the role of A-site atom in magnetostructural transformations in Mn3Ga1-xSnxC compounds. Replacement of Ga by larger Sn results in formation of Ga-rich or Sn-rich clusters. Although the long range structure is cubic, locally Mn atoms find themselves either in Ga-rich or Sn-rich environments. Mn6C octahedra which are surrounded by Sn are tensile strained which affect their magnetic and magnetocaloric properties. Furthermore the formation of Ga-rich and Sn-rich clusters results in a non-ergodic ground state as found in Mn3Ga0.45Sn0.55C.
Acknowledgements
Authors thank Photon Factory, KEK, Japan for beamtime on beamlines 9C and NW10A for the proposal No. 2014G042. Portions of this research were carried out at the light source PETRA III at DESY, a member of the Helmholtz Association (HGF). We would like to thank Edmund Welter and Roman Chernikov for assistance at beamline P65. Financial support by the Department of Science and Technology, (Government of India) provided within the framework of India@DESY collaboration is gratefully acknowledged.
References
- Takenaka and Takagi (2005) K. Takenaka and H. Takagi, Appl. Phys. Lett. 87, 261902 (2005).
- Takenaka et al. (2008) K. Takenaka, K. Asano, M. Misawa, and H. Takagi, Appl. Phys. Lett. 92, 011927 (2008).
- Lin et al. (2018) J. Lin, P. Tong, W. Tong, Y. Zou, C. Yang, F. Zhu, X. Zhang, L. Li, M. Wang, Y. Wu, S. Lin, W. Song, X. Zhu, and Y. Sun, Scripta Mater. 152, 6 (2018).
- Iikubo et al. (2008) S. Iikubo, K. Kodama, K. Takenaka, H. Takagi, and S. Shamoto, Phys. Rev. B 77, 020409 (2008).
- Kodama et al. (2010) K. Kodama, S. Iikubo, K. Takenaka, M. Takigawa, H. Takagi, and S. Shamoto, Phys. Rev. B 81, 224419 (2010).
- Lin et al. (2015) J. C. Lin, P. Tong, W. Tong, S. Lin, B. S. Wang, W. H. Song, Y. M. Zou, and Y. P. Sun, Appl. Phys. Lett. 106, 082405 (2015).
- Zhang et al. (2014) X. H. Zhang, Y. Yin, Q. Yuan, J. C. Han, Z. H. Zhang, J. K. Jian, J. G. Zhao, and B. Song, J. Appl. Phys. 115, 123905 (2014).
- Lin et al. (2012) S. Lin, B. S. Wang, J. C. Lin, Y. N. Huang, W. J. Lu, B. C. Zhao, P. Tong, W. H. Song, and Y. P. Sun, Appl. Phys. Lett. 101, 011908 (2012).
- Li et al. (2011) C. C. Li, B. Wang, S. Lin, J. Lin, P. Tong, W. Lu, and Y. Sun, J. Magn. Magn. Mater. 323, 2233 (2011).
- Lin et al. (2014) J. C. Lin, P. Tong, S. Lin, B. S. Wang, W. H. Song, and Y. P. Sun, J. Appl. Phys. 116, 213912 (2014).
- Shao et al. (2015) Q. Shao, Q. Lv, X. Yang, Z. Han, S. Dong, B. Qian, L. Zhang, C. Zhang, Y. Fang, and X. Jiang, J. Magn. Magn. Mater. 396, 160 (2015).
- Born et al. (2018) N.-O. Born, L. Caron, F. Seeler, and C. Felser, J. Alloys Compd. 749, 926 (2018).
- Wang et al. (2011) B. Wang, C. Li, S. Lin, J. Lin, L. Li, P. Tong, W. Lu, X. Zhu, Z. Yang, W. Song, J. Dai, and Y. Sun, J. Magn. Magn. Mater. 323, 2017 (2011).
- Sun et al. (2010) Y. Sun, C. Wang, Y. Wen, L. Chu, H. Pan, M. Nie, and M. Tang, J. Am. Ceram. Soc. 93, 2178 (2010).
- Wang et al. (2009a) B. S. Wang, P. Tong, Y. P. Sun, L. J. Li, W. Tang, W. J. Lu, X. B. Zhu, Z. R. Yang, and W. H. Song, Appl. Phys. Lett. 95, 222509 (2009a).
- Sun et al. (2009) Z. H. Sun, X. Y. Song, F. X. Yin, L. X. Sun, X. K. Yuan, and X. M. Liu, J. Phys. D: Appl. Phys. 42, 122004 (2009).
- . Çakir and Acet (2012) . Çakir and M. Acet, Appl. Phys. Lett. 100, 202404 (2012).
- Wang et al. (2009b) B. S. Wang, P. Tong, Y. P. Sun, X. Luo, X. B. Zhu, G. Li, X. D. Zhu, S. B. Zhang, Z. R. Yang, W. H. Song, and J. M. Dai, Europhys. Lett. 85, 47004 (2009b).
- Fruchart and Bertaut (1978) D. Fruchart and E. F. Bertaut, J. Phys. Soc. Jpn. 44, 781 (1978).
- Dias et al. (2017a) E. T. Dias, K. R. Priolkar, R. Ranjan, A. K. Nigam, and S. Emura, J. Appl. Phys. 122, 103906 (2017a).
- Dias et al. (2015) E. T. Dias, K. R. Priolkar, A. Das, G. Aquilanti, . Çakir, M. Acet, and A. K. Nigam, J. Phys. D: Appl. Phys. 48, 295001 (2015).
- Fruchart et al. (1970) D. Fruchart, E. F. Bertaut, F. Sayetat, M. N. Eddine, R. Fruchart, and J. P. Sénateur, Solid State Commun. 8, 91 (1970).
- Çakir . et al. (2017) Çakir ., F. Cugini, M. Solzi, K. Priolkar, M. Acet, and M. Farle, Phys. Rev. B 96, 014436 (2017).
- l’Héritier et al. (1977) P. l’Héritier, J. P. Senateur, R. Fruchart, D. Fruchart, and E. F. Bertaut, Mater. Res. Bull. 12, 533 (1977).
- Dias et al. (2014a) E. T. Dias, K. R. Priolkar, and A. K. Nigam, Mater. Res. Express 1, 026106 (2014a).
- Bouchaud et al. (1966) J. P. Bouchaud, R. Fruchart, R. Pauthenet, M. Guillot, H. Bartholin, and F. Chaissé, J. Appl. Phys. 37, 971 (1966).
- Jing-Yu et al. (2012) H. Jing-Yu, W. Yong-Chun, Y. Yuan, W. Cong, Z. Qing, J. Chang-Qing, and Y. Ri-Cheng, Chin. Phys. Lett. 29, 086201 (2012).
- Dias et al. (2017b) E. T. Dias, K. R. Priolkar, A. K. Nigam, R. Singh, A. Das, and G. Aquilanti, Phys. Rev. B 95, 144418 (2017b).
- Carvajal (1993) J. R. Carvajal, Phys. B 192, 55 (1993).
- (30) J. Rodríguez-Carvajal, .
- Ravel and Newville (2005) B. Ravel and M. Newville, J. Synchrotron Radiat. 12, 537 (2005).
- Howe and Myers (1957) L. Howe and H. P. Myers, Philos. Mag. 2, 554 (1957).
- E. T. Dias and K. R. Priolkar and . Çakir. and M. Acet, and A. K. Nigam (2015) E. T. Dias and K. R. Priolkar and . Çakir. and M. Acet, and A. K. Nigam, J. Appl. Phys. 117, 123901 (2015).
- Dias et al. (2014b) E. T. Dias, K. R. Priolkar, and A. K. Nigam, J. Magn. Magn. Mater. 363, 140 (2014b).
- . Çakir et al. (2014) . Çakir, M. Acet, M. Farle, and A. Senyshyn, J. Appl. Phys. 115, 043913 (2014).