Star clusters and young populations in
the dwarf irregular galaxy Leo A
Abstract
We have studied young stellar populations and star clusters in the dwarf irregular galaxy Leo A using multicolor (, , , , ) photometry data obtained with the Subaru Suprime-Cam and two-color photometry results measured on archival HST/ACS & frames. The analysis of the main sequence (MS) and blue supergiant (BSG – “blue loop”) stars enabled us to study the star formation history in the Leo A galaxy during the last 200 Myr. Also, we have discovered 5 low-mass (400 M⊙) star clusters within the ACS field. This finding, taking into account a low metallicity environment and a yet-undetected molecular gas in Leo A, constrains star formation efficiency estimates and scenarios. Inside the well known “hole” in the H i column density map ([Hunter et al. (2012), Hunter et al. 2012]) we found a shock front (prominent in ), implying an unseen progenitor and reminding the “hole” problems widely discussed by [Warren et al. (2011), Warren et al. (2011)].
keywords:
galaxies: dwarf, galaxies: individual Leo A, galaxies: star clusters1 Introduction
Leo A is an isolated dwarf irregular galaxy in the Local Group. It is a gas-rich ([Young & Lo (1996), Young & Lo 1996]; [Hunter et al. (2012), Hunter et al. 2012]) dark-matter-dominated stellar system ([Brown2007, Brown et al. 2007]; [Kirby2017, Kirby et al. 2017]) of low metallicity ([vanZee2006, van Zee et al. 2006]; [Kirby2017, Kirby et al. 2017]).
The present-day star formation activity is indicated by few H ii regions, while the existence of an old stellar population is proved by the detection of RR Lyr stars ([Dolphin et al. (2002), Dolphin et al. 2002]; [Bernard et al. (2013), Bernard et al. 2013]). Detailed studies of stellar content in Leo A were performed with the Hubble Space Telescope (HST) Wide Field and Planetary Camera 2 (WFPC2) ([Tolstoy et al. (1998), Tolstoy et al. 1998]; [Schulte-Ladbeck et al. (2002), Schulte-Ladbeck et al. 2002]) and Advanced Camera for Surveys (ACS) ([Cole et al. (2007), Cole et al. 2007]) by the imaging of the central part. The outer parts of the galaxy were studied with the Subaru Suprime-Cam by [Vansevičius et al. (2004), Vansevičius et al. (2004)], and with the HST Wide Field Camera 3 (WFC3) by [Stonkutė et al. (2018), Stonkutė et al. (2018)].
2 Data
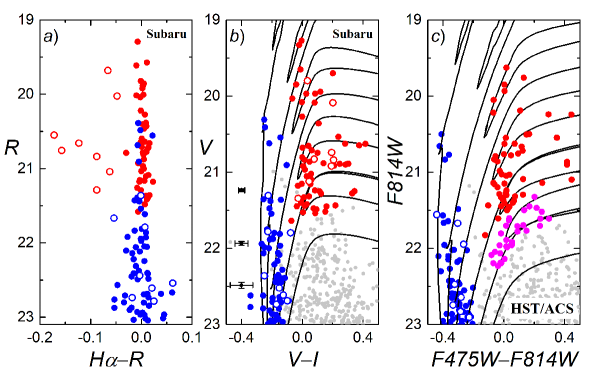
We used the stellar photometry catalog ([Stonkutė et al. (2014), Stonkutė et al. 2014]) based on the Subaru Suprime-Cam imaging data of the Leo A galaxy. To study young populations, we selected only bright blue stars in the color-magnitude diagrams (CMDs) shown in Fig. 1: , , , . These objects were visually inspected using multicolor Subaru and HST/ACS images.
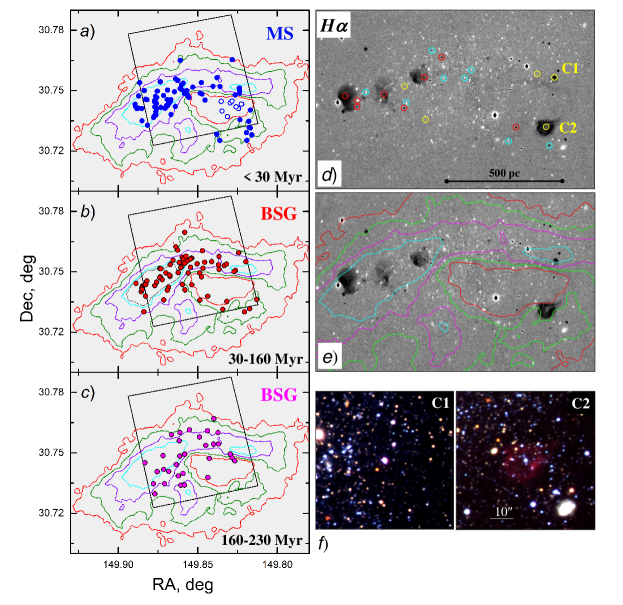
Based on the PARSEC isochrones [Marigo et al. (2017), Marigo et al. (2017)], we estimate that selected MS stars are younger than 30 Myr and BSG star ages are from 30 to 230 Myr (Fig. 1). We selected the following objects: 88 MS stars, 9 out of them fall into the H i “hole” area (Fig. 2a); 69 BSG stars (Fig. 2b), 8 out of them show emission (Fig. 1a); 31 BSG stars from deep HST/ACS photometry data (Figs. 1c & 2c, filled magenta circles).
Additionally, we used the (width of the passband 20 nm) map made by subtracting a reference frame obtained in the passband (Fig. 2d & e).
The integrated H i column density map ([Hunter et al. (2012), Hunter et al. 2012]) was employed for the analysis of young stellar population distributions and for the “hole’s” dynamics and morphology study (Fig. 2a-c).
3 Results and Discussion
The analysis of the MS and BSG star distributions enabled us (by assuming there is no star migration across the disk) to visualize the 2D star formation history in the Leo A galaxy over the last 200 Myr (Fig. 2). The analysis of young stellar populations within and around the “hole” seen in the H i map revealed a number of interesting features:
-
•
by inspecting the H i column density distribution map, we found that the column density inside the “hole” and in the “hole’s” walls comes as 1 to 10; to “inflate” the “hole” of 500 pc in size from a single center assuming an average gas velocity dispersion of 7 km/s ([Hunter et al. (2012), Hunter et al. 2012]), it would take 40 Myr; therefore, this estimate could be set as an upper age limit of the “hole”;
-
•
number densities of stars in the eastern and western parts of the “hole” differ strongly; however, stellar populations of ages from 30 to 230 Myr are lacking in both parts (Fig. 2a-c);
-
•
regions of star formation seem to avoid the “hole” for 200 Myr; the “hole’s” western part has started to fill with a new generation of stars only recently (30 Myr, Fig. 2a) and, probably, this population produces the shock front seen in the map (Fig. 2d) and induces star formation well ahead of the shock front (20 pc); see, e.g., clusters C1 & C2 and stars younger than 20 Myr to the South of the cluster C2;
-
•
remarkably, the form of the shock front closely resembles the H i column density distribution morphology (Fig. 2e), implying that the western part of the “hole”, in principle, could be swept out of H i gas by the young MS stellar population; however, the distribution of MS stars (younger than 30 Myr), projecting onto the H i “hole’s” western part, does not resemble its form and there is no increase in the number density of the young MS stars within the H i “hole” (Fig. 2a); therefore, the problem of which objects or processes are responsible for shaping the eastern part of the “hole” remains unsolved.
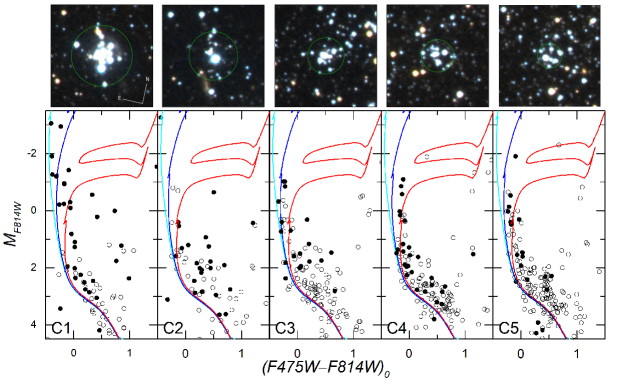
By employing HST/ACS resolved stellar photometry data, we discovered 5 low-mass (400 M⊙) star clusters residing in the central part of the Leo A galaxy (Fig. 3). All clusters are distributed around the H i “hole” (Fig. 2d). Note, however, that these clusters are too compact to be resolved on Subaru images. Therefore, for the complete census of star clusters in the Leo A galaxy high quality wide field HST observations are needed.
Also, we discovered 8 BSG stars with enhanced emission (Fig. 1a & Fig. 2d), which indicate Be stars in the Leo A galaxy. However, 5 of them are located nearby to H ii zones and their photometry could be contaminated by a diffuse emission.
. This research was funded by a grant No. LAT-09/2016 from the Research Council of Lithuania.
References
- [Bernard et al. (2013)] Bernard, E.J., Monelli, M., Gallart, C., et al. 2013, MNRAS, 432, 3047
- [Brown et al. (2007)] Brown, W.R., Geller, M.J., Kenyon, S.J., & Kurtz, M.J. 2007, ApJ, 666, 231
- [Cole et al. (2007)] Cole, A.A., Skillman, E.D., Tolstoy, E., et al. 2007, ApJ, 659, L17
- [Dolphin et al. (2002)] Dolphin, A.E., Saha, A., Claver, J., et al. 2002, AJ, 123, 3154
- [Hunter et al. (2012)] Hunter, D.A., Ficut-Vicas, D., Ashley, T., et al. 2012, AJ, 144, 134
- [Kirby et al. (2017)] Kirby, E.N., Rizzi, L., Held, E.V., et al. 2017, ApJ, 834, 9
- [Marigo et al. (2017)] Marigo, P., Girardi, L., Bressan, A., et al. 2017, ApJ, 835, 77
- [Schlafly & Finkbeiner (2011)] Schlafly, E.F., & Finkbeiner, D.P. 2011, ApJ, 737, 103
- [Schulte-Ladbeck et al. (2002)] Schulte-Ladbeck, R.E., Hopp, U., Drozdovsky, I.O., et al. 2002, AJ, 124, 896
- [Stonkutė et al. (2014)] Stonkutė, R., Arimoto, N., Hasegawa, T., et al. 2014, ApJSS, 214, 19
- [Stonkutė et al. (2018)] Stonkutė, R., Čeponis, M., Leščinskaitė, A. et al. 2018, AA, 614, 144
- [Tolstoy et al. (1998)] Tolstoy, E., Gallagher, J.S., Cole, A.A., et al. 1998, AJ, 116, 1244
- [van Zee et al. (2006)] van Zee, L., Skillman, E.D., & Haynes, M.P. 2006, ApJ, 637, 269
- [Vansevičius et al. (2004)] Vansevičius, V., Arimoto, N., Hasegawa, T., et al. 2004, ApJ, 611, L93
- [Warren et al. (2011)] Warren, S.R., Weisz, D.R., Skillman, E.D., et al. 2011, ApJ, 738, 10
- [Young & Lo (1996)] Young, L.M., & Lo, K.Y. 1996, ApJ, 462, 203