Impact of Plasma Instability on Constraint of the Intergalactic Magnetic Field
Abstract
A relativistic electron-positron pair beam can be produced in the interaction of TeV photons from a blazar with the extragalactic background light (EBL). The relativistic pairs would loss energy through inverse-Compton scattering (ICS) photons of cosmic microwave background (CMB) or plasma instabilities. The dominant energy-loss process is under debate. Based on the assumption that the dominant energy-loss process is ICS, the resulted cascade GeV radiation is usually used to constrain the intergalactic magnetic field (IGMF). Here, we include the energy-loss due to plasma oblique instability in the calculation of cascade gamma-ray flux, and investigate the impact of the plasma instability on the constraint of IGMF. The up-to-date GeV data and archival TeV data of the blazar 1ES 0229+200 are used. The results indicate that even if the oblique instability cooling is dominating over ICS cooling, the cascade flux could be still used to constrain the IGMF. It is found that with the ratio between the cooling rates of the oblique instability and the ICS varying from 0.1, 1 to 10, the lower limit of the IGMF putted by the cascade flux and the gamma-ray data changes from G, G to G. If the ratio between the two cooling rates is 30, the estimate of IGMF based on the cascade flux is invalid.
1 Introduction
Extragalactic TeV sky is dominated by blazars. TeV photons from blazars interact with photons of the extragalactic background light (EBL) to create pairs. These pairs are relativistic with the Lorentz factors of .
It is usually assumed that the dominant energy-loss process of the pairs is inverse-Compton scattering (ICS) photons of cosmic microwave background (CMB) to produce secondary cascade GeV emissions (e.g., Aharonian et al., 1994; Dai et al., 2002; Fan et al., 2004). The intergalactic magnetic field (IGMF) can deflect these pairs, and then modulate the secondary GeV emissions. Therefore, gamma-ray astronomy is thought to provide a useful probe to the IGMF through investigations on cascade-radiation spectra of blazars (e.g., Murase et al., 2008; Neronov & Vovk, 2010; Tavecchio et al., 2010; Taylor et al., 2011; Dermer et al., 2011; Finke et al., 2015), cascade-radiation contribution to extragalactic diffuse gamma-ray background (EGRB) (e.g., Yan et al., 2012; Venters & Pavlidou, 2013), and gamma-ray halos (e.g., Elyiv et al., 2009; Ackermann et al., 2013, 2018; Chen et al., 2015).
However, it was recently proposed that as the blazar-induced pair beam moves through the intergalactic medium (IGM), plasma instabilities would be triggered (e.g., Bret, 2009). As a result, the energy-loss of the pairs would be dominated by plasma instabilities, thereby suppressing ICS (e.g., Broderick et al., 2012). In this case, the kinetic energy of the pairs are efficiently converted into heat in the IGM, rather than GeV radiations. This would rewrite thermal history of the IGM (e.g., Chang et al., 2012; Pfrommer et al., 2012). Broderick et al. (2012) argued that the measurements of the IGMF through gamma-ray emissions would be invalidated in this situation.
So far, the fate of the pairs evolution is still under debate (e.g., Schlickeiser et al., 2012a, b, 2013; Miniati & Elyiv, 2013; Chang et al., 2014; Sironi & Giannios, 2014; Kempf et al., 2016; Shalaby et al., 2018; Vafin et al., 2018). These authors studied plasma instabilities through analytical methods and particle-in-cell (PIC) simulations. In this work, we aim to investigate the impact of the plasma instabilities on measurement of IGMF.
2 Fermi-LAT data analysis
The TeV blazar 1ES 0229+200, at redshift z = 0.1396, was observed with HESS in 2006 and 2007 (Aharonian et al., 2007) and VERITAS in 2009 - 2012 (Aliu et al., 2014). Hints of moderate variability on yearly and monthly timescales were found in its TeV emissions (Aliu et al., 2014; Cologna et al., 2015). The observed TeV spectrum extends to 10 TeV, with the photon index . The EBL-corrected TeV spectrum has the photon index (e.g., Finke et al., 2015)
At GeV energies, weak emissions from 1ES 0229+200 have been detected by Fermi-LAT. We reanalyze the Fermi-LAT data for 1ES 0229+200 collected from 2008 August to 2018 August, with energies between 100 MeV and 300 GeV. The events of PASS8 SOURCE class, within a region of interest (ROI) centered at 1ES 0229+200, are used. Analysis is performed with the ScienceTools v10r0p5 and the instrument response function (IRF) P8R2_SOURCE_V6. To avoid contamination from the Earth’s albedo, we exclude the events with the zenith angles . Furthermore, we exclude data when the source was within the degrees region of the Sun and moon, since the gamma-ray emission from 1ES 0229+200 is possibly affected by -rays from the Sun and moon(e.g., Finke et al., 2015; Inoue & Tanaka, 2016).
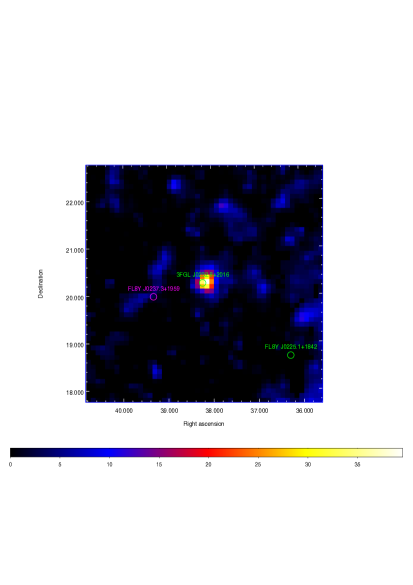
The standard likelihood analysis by gtlike is performed through this work. In addition to Galactic and extragalactic gamma-ray diffuse background components, the background we consider includes all sources in 3FGL(Acero et al., 2015) within the ROI and a preliminary LAT 8-year source list111https://fermi.gsfc.nasa.gov/ssc/data/access/lat/fl8y/ (see Figure 1). According to the global fitting results, parameters of all sources (except for target source and prefactors of variable sources222Variable sources are defined as the ones having Variability_Index 72.44 (Acero et al., 2015). Since there is no variability information for FL8Y source yet, and these FL8Y sources in ROI are faint, we fix their parameters in calculating light curve. Four FL8Y sources involved here are FL8Y J0225.1+1842, FL8Y J0230.2+1714, FL8Y J0237.3+1959 and FL8Y J0242.8+1733. Paliya et al. (2016) analyzed the Fermi-LAT data of FL8Y J0225.1+1842.) are fixed to the best-fitting values in constructing light curves. For spectral energy distribution analysis, models are just modified by fixing the spectral shapes, i.e., remaining the prefactors free. Upper limits at 95% confidence level are given when the flux with TS 4 is obtained.
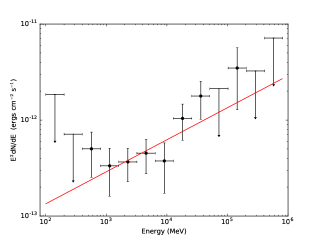
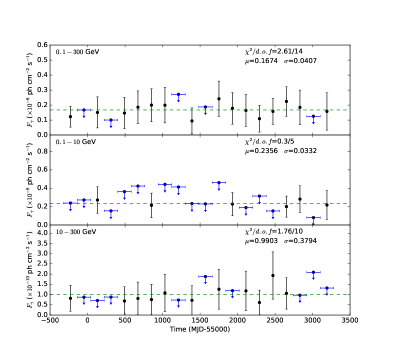
In Figure 2, we show the ten-year average Fermi-LAT spectrum for 1ES 0229+200. This spectrum can be described by a power-law function, with the photon index . No variability is found in the LAT data (Figure 3).
3 Results
3.1 Calculation of cascade gamma-ray flux including plasma instability cooling
The steady-state electron continuity equation that governs the pair evolution is333We reasonably assume no escape and advection, like Broderick et al. (2012).
| (1) |
where is the energy-loss of the pairs and is the injection rate of the pairs. The solution to this equation is
| (2) |
The pairs injection rate is (Dermer, 2013)
| (3) |
where is the luminosity distance and is the EBL absorption depth for gamma-rays with energy of emitted at redshift . The primary gamma-ray spectrum is
| (4) |
where is photon index of the primary spectrum, is a normalization flux, and is a high-energy cut-off. is the EBL-absorbed primary spectrum.
We consider the energy-losses of the pairs due to ICS and plasma instabilities. The energy-loss rate due to inverse-Compton scattering photons of CMB in the Thomson regime is
| (5) |
where is the CMB energy density at low redshifts. For the energy-loss due to plasma instabilities, we consider the oblique instability which has the most powerful growth (e.g., Bret, 2009). Its energy-loss rate can be simply written as (Broderick et al., 2012)
| (6) |
The total energy-loss rate is , where . Using this total energy-loss rate and the formula of Dermer (2013), we calculate the cascade GeV flux .
In Dermer et al. (2011) and Dermer (2013) , the calculation of the cascade flux only considered the energy-loss due to ICS. As we show above, when the energy-loss due to the oblique instability is taken into account, the cascade flux in Dermer et al. (2011) and Dermer (2013) is simply modified by a factor of .
In addition to the parameters of the primary spectrum, the other parameters that can effect cascade flux are IGMF strength , IGMF coherence length , jet opening angle , and the blazar active time with constant flux .
3.2 Constraining in different cooling regimes
In the following calculations, we choose 0.1 rad, 1 Mpc, years, 5 TeV, , , and the best-fit EBL model of Kneiske et al. (2004).
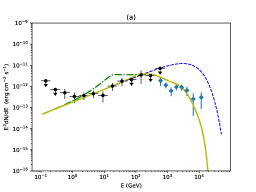
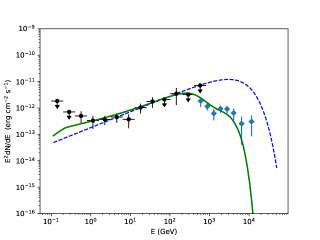
We first consider the case of ICS cooling dominating over the oblique instability cooling through using . The result is shown in Figure 4. One can see that in order to avoid the cascade flux exceeding the LAT flux, is required to be larger than G.
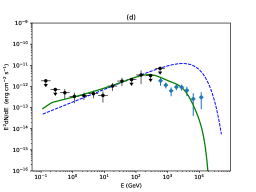
In Figure 6, we give the results with . It is found that the contribution of the cascade flux to LAT data is negligible even an extremely low (G) is assumed.


4 CONCLUSIONS
Given that plasma instabilities may play an important role in the evolution of a blazar-induced pair beam (e.g., Broderick et al., 2012; Shalaby et al., 2018; Vafin et al., 2018), we take the plasma oblique instability (with the fastest growth) cooling into account in considering the evolution of relativistic electron-positron pairs created in propagation of TeV photons from a blazar. This would alter the density of pairs per unit Lorentz factor, and then the cascade gamma-ray flux produced by the pairs ICS CMB photons.
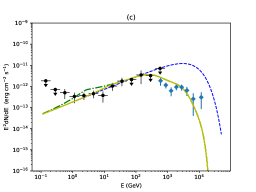
Using the up-to-date Fermi-LAT observations and archival HESS observations of 1ES 0229+200, we constrain IGMF strength in different cooling processes. The results suggest that the gamma-ray data still put effective constraint on , even if the oblique instability cooling strongly dominating over the ICS cooling, e.g., the ratio between the cooling rates of the oblique instability and the ICS . We find that with this ratio varying from 0.1, 1 to 10, the lower limit of putted by the cascade flux and gamma-ray data changes from G, G to G. From the ICS cooling dominating to the oblique instability cooling dominating, the lower limit of changes by a factor of .
Compared with that obtained in the case of ICS cooling dominating, the lower limit of is slightly changed in the case of the two cooling processes comparable.
It is also noted that with , the cascade flux is negligible compared with the LAT data. This means the gamma-ray astronomy cannot be considered as a useful probe to IGMF any more.
In Appendix, we perform the analyses with the EBL model (“Model C”) of Finke et al. (2010) 444This EBL model is similar to the EBL models of Franceschini et al. (2008) and Domínguez et al. (2011).. The results (Figure 8) are quite similar to that calculated by using the EBL model of Kneiske et al. (2004).
Acknowledgements
We thank the referee for the constructive suggestions. We acknowledge financial supports from the National Natural Science Foundation of China (NSFC-11803081, NSFC-11573060, NSFC-11573026, NSFC-U1738124, NSFC-11603059 and NSFC-11661161010) and the joint foundation of Department of Science and Technology of Yunnan Province and Yunnan University [2018FY001(-003)]. The work of D. H. Yan is also supported by the CAS “Light of West China” Program.
References
- Acero et al. (2015) Acero, F., Ackermann, M., Ajello, M., et al. 2015, ApJS, 218, 23
- Ackermann et al. (2013) Ackermann, M., Ajello, M., & Allafort, A., et al., 2013, ApJ, 765, 54
- Ackermann et al. (2018) Ackermann, M., Ajello, M., & Baldini, L., et al., 2018, ApJS, 237, 32
- Aharonian et al. (1994) Aharonian, F. A., Coppi, P. S., & Völk, H. J. 1994, ApJ, 423, L5
- Aharonian et al. (2007) Aharonian, F., Akhperjanian, A. G., Barres de Almeida, U., et al. 2007, A&A, 475, L9
- Aliu et al. (2014) Aliu, E., Archambault, S., Arlen, T., et al. 2014, ApJ, 782, 13
- Bret (2009) Bret, A. 2009, ApJ, 699, 990
- Broderick et al. (2012) Broderick, A. E., Chang, P., & Pfrommer, C. 2012, ApJ, 752, 22
- Chang et al. (2012) Chang, P., Broderick, A. E., & Pfrommer, C. 2012, ApJ, 752, 23
- Chang et al. (2014) Chang, P., Broderick, A. E., Pfrommer, C., et al. 2014, ApJ, 797, 110
- Chen et al. (2015) Chen, W., Buckley, J. H., & Ferrer, F. 2015, PhRvL, 115, 211103
- Cologna et al. (2015) Cologna, G., Mohamed, M., Wagner, S. J., et al. 2015, Proc. ICRC, 34, 762
- Dai et al. (2002) Dai, Z. G., Zhang, B., Gou, L. J., Mészáros, P., & Waxman, E. 2002, ApJ, 580, L7
- Dermer et al. (2011) Dermer, C. D., Cavadini, M., Razzaque, S., et al. 2011, ApJL, 733, L21
- Dermer (2013) Dermer, C. D. 2013, in Astrophysics at Very High Energies, Saas-Fee Advanced Course 40, ed. F. Aharonian, L. Bergström & C. Dermer (Berlin: Springer), 225
- Domínguez et al. (2011) Domínguez, A., Primack, J. R., Rosario, D. J., et al. 2011, MNRAS, 410, 2556
- Elyiv et al. (2009) Elyiv, A., Neronov, A., & Semikoz, D. V. 2009, PhRvD, 80, 023010
- Fan et al. (2004) Fan, Y. Z., Dai, Z. G., & Wei, D. M. 2004, A&A, 415, 483
- Finke et al. (2010) Finke, J. D., Razzaque, S., & Dermer, C. D. 2010, ApJ, 712, 238
- Finke et al. (2015) Finke, J. D., Reyes, L. C., Georganopoulos, M., et al. 2015, ApJ, 814, 20
- Franceschini et al. (2008) Franceschini, A., Rodighiero, G., & Vaccari, M. 2008, A&A, 487, 837
- Inoue & Tanaka (2016) Inoue, Y., & Tanaka, Y. T. 2016, ApJ, 828, 13
- Kempf et al. (2016) Kempf, A., Kilian, P., & Spanier, F. 2016, A&A, 585, A132
- Kneiske et al. (2004) Kneiske, T. M., Bretz, T., Mannheim, K., & Hartmann, D. H. 2004, A&A, 413, 807
- Miniati & Elyiv (2013) Miniati, F., & Elyiv, A. 2013, ApJ, 770, 54
- Murase et al. (2008) Murase, K., Takahashi, K., Inoue, S., Ichiki, K., & Nagataki, S. 2008, ApJL, 686, L67
- Neronov & Vovk (2010) Neronov, A., & Vovk, I. 2010, Sci, 328, 73
- Paliya et al. (2016) Paliya, V. S., Parker, M. L., Fabian, A. C., & Stalin, C. S. 2016, ApJ, 825, 74
- Pfrommer et al. (2012) Pfrommer, C., Chang, P., & Broderick, A. E. 2012, ApJ, 752, 24
- Schlickeiser et al. (2012a) Schlickeiser, R., Elyiv, A., Ibscher, D., & Miniati, F. 2012a, ApJ, 758, 101
- Schlickeiser et al. (2012b) Schlickeiser, R., Ibscher, D., & Supsar, M. 2012b, ApJ, 758, 102
- Schlickeiser et al. (2013) Schlickeiser, R., Krakau, S., & Supsar, M. 2013, ApJ, 777, 49
- Shalaby et al. (2018) Shalaby, M., Broderick, A. E., Chang, P., et al., 2018, ApJ, 859, 45
- Sironi & Giannios (2014) Sironi, L., & Giannios, D. 2014, ApJ, 787, 49
- Tavecchio et al. (2010) Tavecchio, F., Ghibellini, G., Foschini, L., et al. 2010, MNRAS, 406, L70
- Taylor et al. (2011) Taylor, A. M., Vovk, I., & Neronov, A. 2011, A&A, 529, A144
- Vafin et al. (2018) Vafin, S., Rafighi, I., Pohl, M., & Niemiec, J. 2018, ApJ, 857, 43
- Venters & Pavlidou (2013) Venters, T., & Pavlidou, V., 2013, MNRAS, 432, 3485
- Yan et al. (2012) Yan, D. H., Zeng, H. D., & Zhang, L., 2012, MNRAS, 422, 1779
Appendix A Impact of EBL uncertainty on the results
In Figure 8, we give the results with the EBL model of Finke et al. (2010). The other parameters are the same as that in Figures 4-7, respectively. One can see that with this EBL model we cannot reproduce the HESS data below 1 TeV well, and the differences in the constraints on the IGMF caused by the two EBL models are negligible.