A Supra-galactic Conundrum: The Globular Clusters Colour Pattern in Virgo Galaxies
Abstract
The presence of systematic modulations in the colour distributions in composite samples of globular clusters associated with galaxies in the Virgo and Fornax clusters has been reported in a previous work. In this paper we focus on the 27 brightest galaxies in Virgo, and in particular on , the dominant system in terms of globular cluster population. The new analysis includes 7600 cluster candidates brighter than 24.5 (or 23.70). The results indicate the presence of the characteristic Virgo pattern in these galaxies and that this pattern is detectable over a galactocentric range from 3 to 30 in . This finding gives more support to the idea that the pattern has been the result of an external, still not identified phenomenon, capable of synchronizing the cluster formation in a kind of viral process, and on supra-galactic scales (also having, presumably, an impact on the overall star formation history in the entire Virgo cluster).
keywords:
galaxies: star clusters: general1 Introduction
The so called globular clusters () colour "bi-modality" has been a dominant paradigm for almost 25 years. In short, the term describes that in general, and with a few exceptions (see, for example, Sesto et al., 2016) the integrated colour distributions of in bright galaxies are dominated by two cluster populations: "blue" and "red" (e.g. Brodie & Strader, 2006; Harris et al., 2017).
A first step towards exploring this issue beyond bi-modality was presented in Forte (2017) ( in what follows), who performed an analysis of composite samples associated with galaxies in the Virgo and Fornax galaxy clusters. That work introduced an elementary pattern recognition technique, based on the frequency of given colours in composite samples of in different galaxies.
This approach, using the photometry by Jordán et al. (2009) and Jordán et al. (2015), led to the discovery of distinct modulations in the (reddening corrected) colours in both galaxy clusters, that were termed as the and ( and , respectively). The Virgo pattern is characterized by the colours listed in Table LABEL:table_1 of F2017 (namely, 0.74, 0.85, 0.95, 1.05, 1.13, 1.21, 1.29, 1.39, 1.48, 1.60 and 1.72). Values in brackets along the following text identify a given colour in the .
The basic idea is that composite samples may enhance the presence of possible common features as, for example, "peaks" or "valleys" in the colour distribution ( in what follows). The colour modulations are most evident for in moderately bright early type galaxies, with from -20.2 to -19.2, but they were also found in some of the brightest galaxies in these clusters (e.g. and in Virgo; and in Fornax). The is in fact a "die-hard" feature as it survives after splitting the sample in terms of cluster brightness, galaxy brightness or spatial position as described in .
After rejecting the incidence of field contamination, instrumental, and statistical effects, the conclusion in was that the colour patterns are not spurious but have a . On statistical grounds, Monte Carlo models along the lines described in Forte, Faifer & Geisler (2007) ( in what follows), indicate that the probability of having a colour pattern with the properties of the as the result of statistical fluctuations in a sample with 1500 objects, is practically null (i.e., below 0.001).
This paper focusses on in the brightest Virgo cluster galaxies and extends the previous uni-dimensional analysis (colour) to a bi-dimensional space (colour-magnitude). In particular, we study the 27 brightest galaxies in Virgo ( from -23.0 to -19.2 ) since, for fainter galaxies, the colour pattern is not evident and appears only marginally in some cases.
The galaxy sample now includes 12 giant galaxies (brighter than -20.2), not discussed in , and among them, , the dominant system in terms of the population. The outer regions of this system are explored using previously published Washington photometry ().
2 Revisiting the Template Virgo Pattern.
In this section we revisit the so called using the same pattern recognition technique presented in although introducing two changes in the strategy of the data analysis.
First, by performing an analysis of the photometric errors given in Jordán et al. (2009), we found that the colour pattern can be more clearly detected adopting a limiting magnitude 24.5, i.e., half a magnitude brighter than the cut-off in . With this magnitude limit, the "colour spread function" (; the function that results after combining photometric errors and the smoothing gaussian kernel), allows the resolution of colour peaks at a level of 0.07 mags. in .
Second, the finding routine was run on each of the 27 brightest galaxies in Virgo, instead of grouping galaxies within a sampling window defined in the colour vs. absolute magnitude diagram. This approach eventually removes the chance that the observed pattern is a result of the type of adopted sampling.
The galaxy sample is listed in Table LABEL:table_1 and is ordered by decreasing brightness, as in Table 1 of Ferrarese et al. (2006), who present structural photometric parameters for these galaxies. Table LABEL:table_1 gives the galaxy identification, colour shifts (see below), galactocentric range, and number of sampled with =20.0 to 24.5.
We remark that the sample in Table LABEL:table_1 is a factor of three times larger than that defined by clusters in the moderately bright galaxies ( from -20.2 to -19.2) discussed in .
Running the colour peak finding routine ( in what follows) on each individual galaxy shows that, as a general trend in giant galaxies, the colour patterns are difficult to find within galactocentric radii () smaller than 40. For these galaxies we set a galactocentric search range from 40″to 100″. For the remaining ones, the galactocentric domain was set from 0″to 100″.
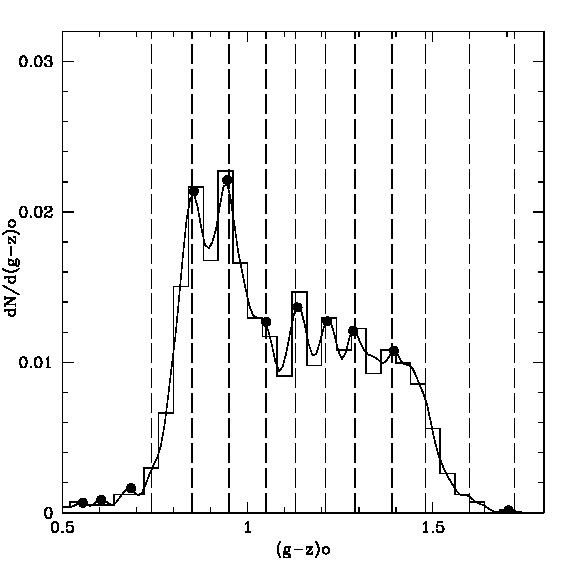
The results from the reveals the presence of 311 colour peaks (corresponding to a total of 4289 GCs) whose smoothed distribution, adopting a Gaussian kernel of 0.015 mag. (as in ), is shown in Fig. 1. This diagram, normalized by the total number of colour peaks, indicates the relative frequency of each colour peak (irrespective of the number of with that colour) and shows nine coincidences with the . The differences between each colour peak and that of the nearest colour in the , leads to a 0.016.
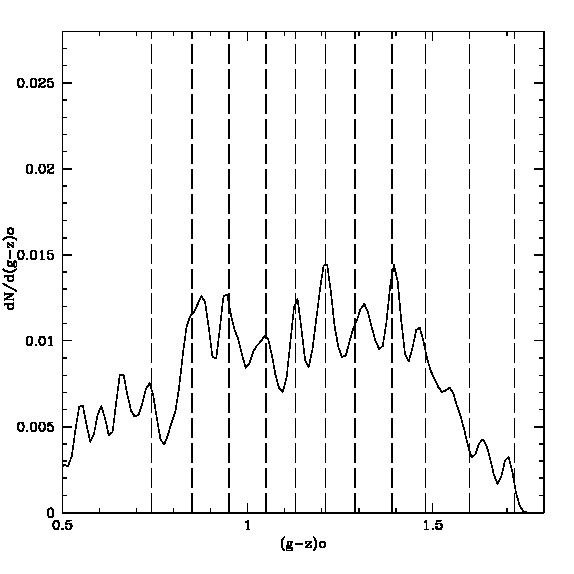
The situation is poorly defined regarding the reddest features, at [1.60] and [1.72].
The nature of the peaks outside the colour range is difficult to asses. In an speculative way, these features could arise in field objects as they do not show any obvious spatial concentration towards the galaxy centres.
The outputs from the also indicate that, in some cases, the whole is detectable although with some small shifts in colour. , the brightest Virgo galaxy, is a good example as its shows all the features, although shifted by +0.05 mag in . Similar systematic shifts are also detectable in other galaxies with well populated systems.
The shifts that bring a given pattern into agreement with the (by minimizing the of the differences between each colour peak and the nearest one in the ), are listed in Table LABEL:table_1.
As noted in , these shifts are within the uncertainties in the adopted interstellar reddening. In fact, the of the original infra-red emission colour excess map calibration by Schlafly & Finkbeiner (2011) is close to 0.03 mag. in that corresponds to 0.05 mag. in .
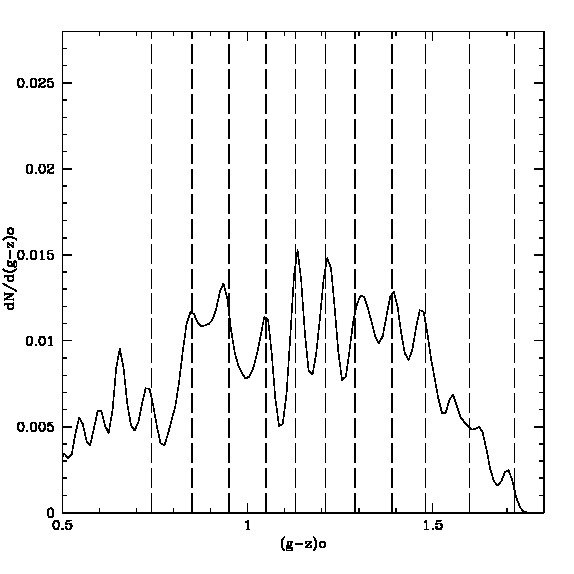
The results from the , after adopting the colour shifts listed in Table LABEL:table_1, lead to the relative frequency distribution displayed in Fig. 2. This diagram, compared to the previous one, shows an overall increase of the contrast of the peaks and also a decrease of the value to 0.010.
3 The composite Globular Clusters Colour Distributions in the 27 brightest Virgo galaxies.
In what follows we present the (normalized by total numbers of ), both in the discrete and smoothed histogram versions. The colour-bin size (0.04 mag) and the Gaussian kernel (0.015 mag) are those discussed in .
The differences between the colour peaks found by the pattern recognition routine and those of the nearest colour in the definition, leads to a value that is an indicator of the agreement between both patterns. This is calculated for colour peaks within the colour range from 0.80 to 1.60, characteristic of old .
In order to derive the composite , the clusters belonging to the galaxies listed in Table LABEL:table_1 were combined in three different groups (separated by blank lines in the table) containing approximately the same number of each.
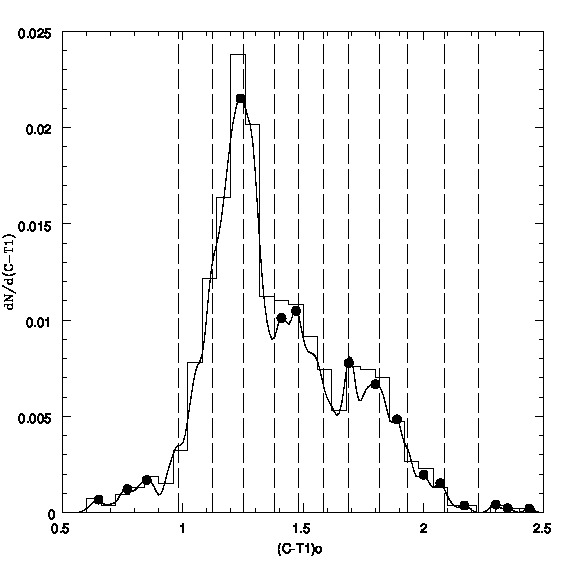
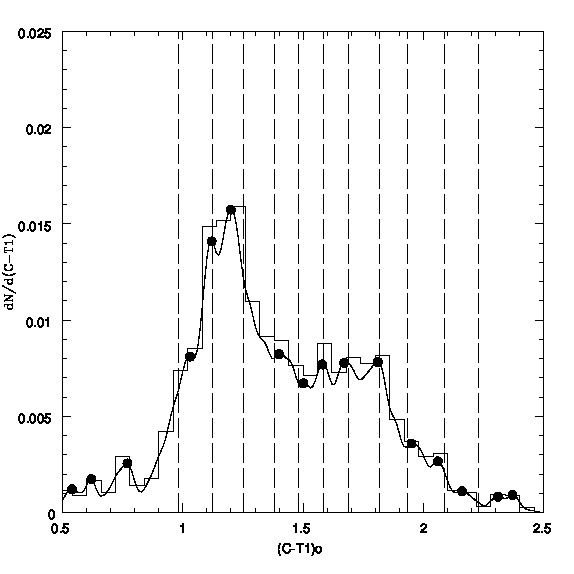
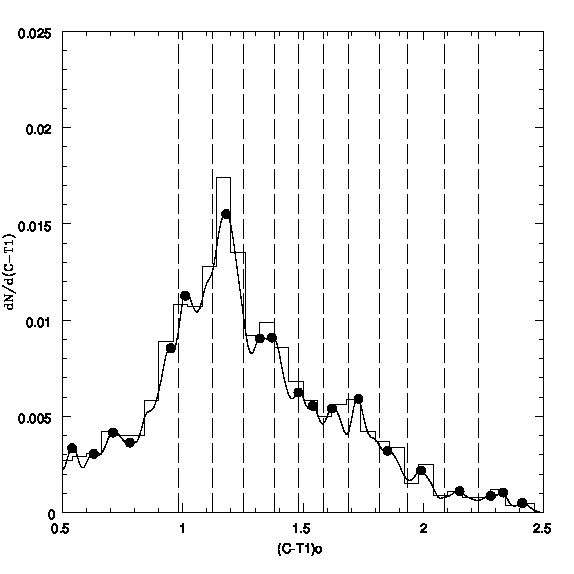
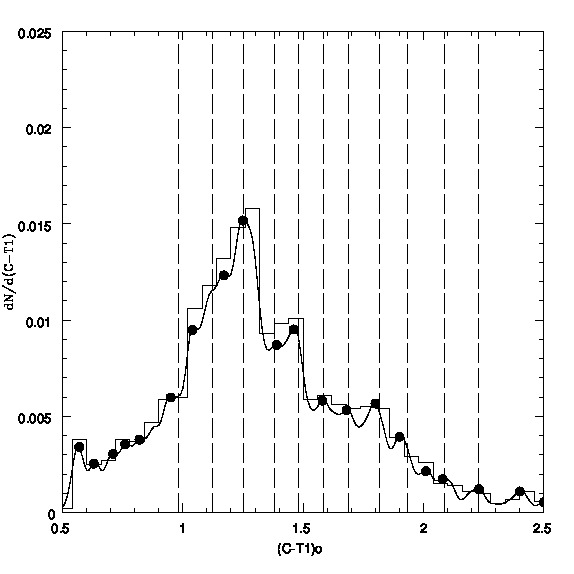
The corresponding to galaxies brighter than -21.8, including and (with 1447 ), is displayed in Fig. 3. The vertical lines in this figure (and in following ones) correspond to the colours, while dots indicate the colour peaks found by the . The corresponding to the differences between the detected peaks and those that define the is 0.016 (eight peaks).
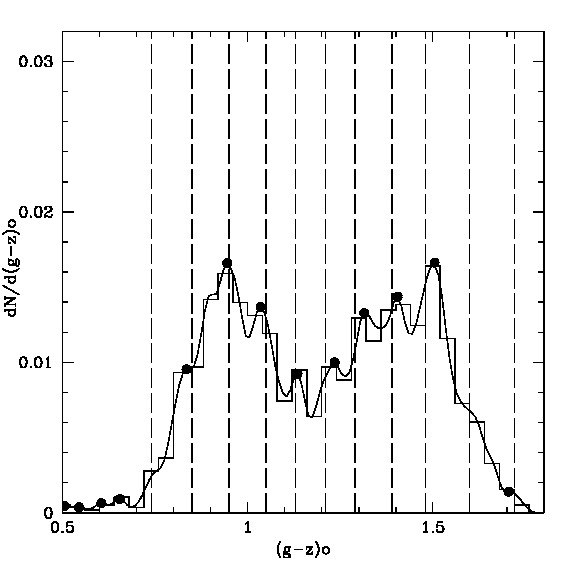
In this case the feature at [0.85] is barely detectable. This is consistent with results available in the literature (see, for example, Escudero et al., 2018) showing that the inner regions of giant galaxies are usually dominated by red while the bluer globulars are less abundant.
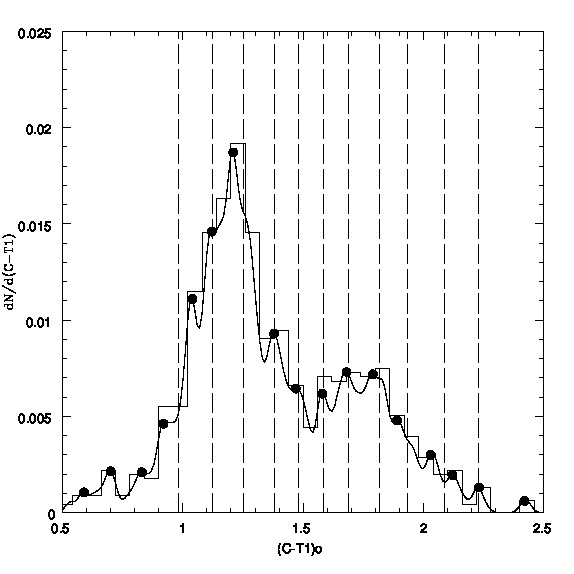
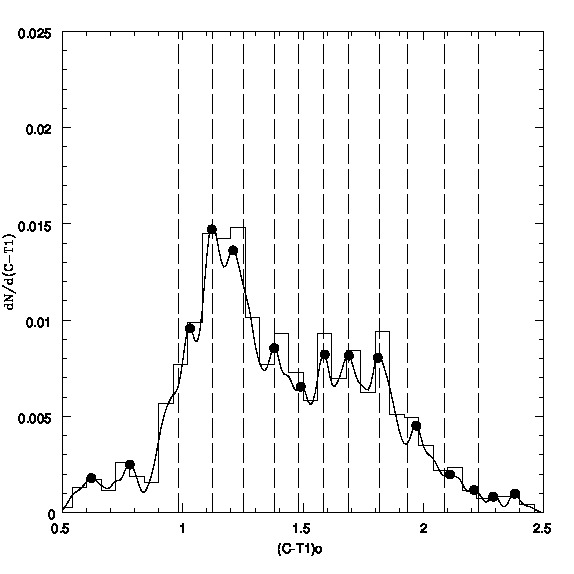
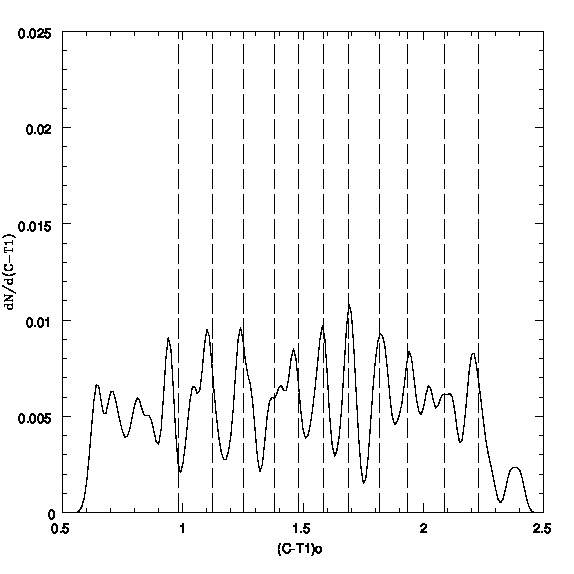
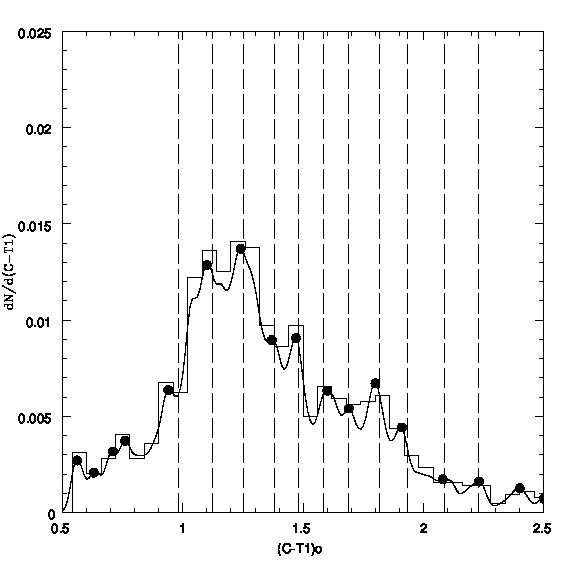
Fig. 4 is the corresponding to nine less massive giants (-20.2 to -21.8; from 4406 to 4762 in Table LABEL:table_1; 1411 GCs). This group has a slightly larger rms (0.018 mag) compared with the previous one ( 0.016), and again, the colour peak at [0.85] is not evident.
As expected, the reddest peaks in this galaxy group are less prominent than those in the more massive, and more chemically enriched, ones displayed in Fig. 3.
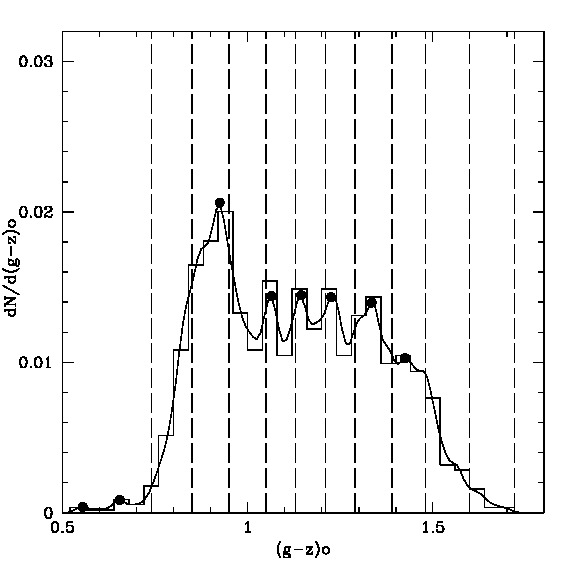
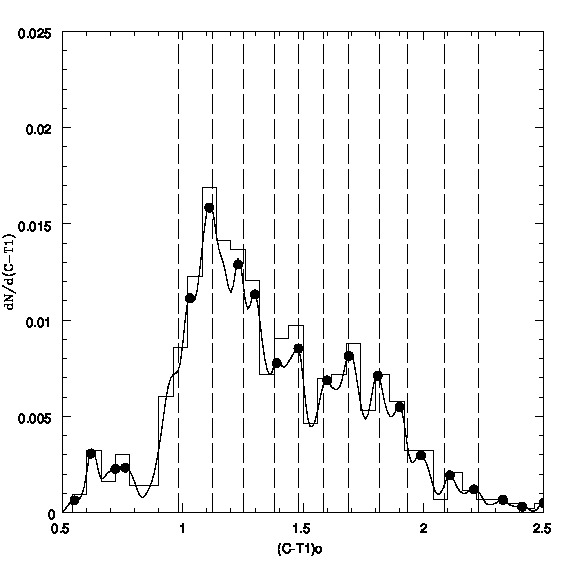
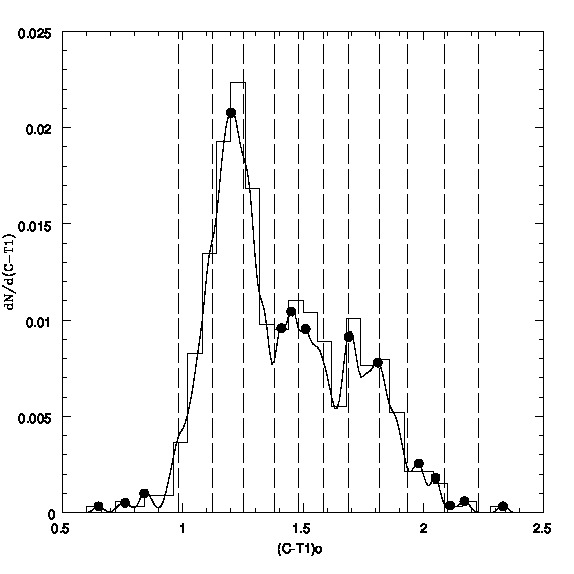
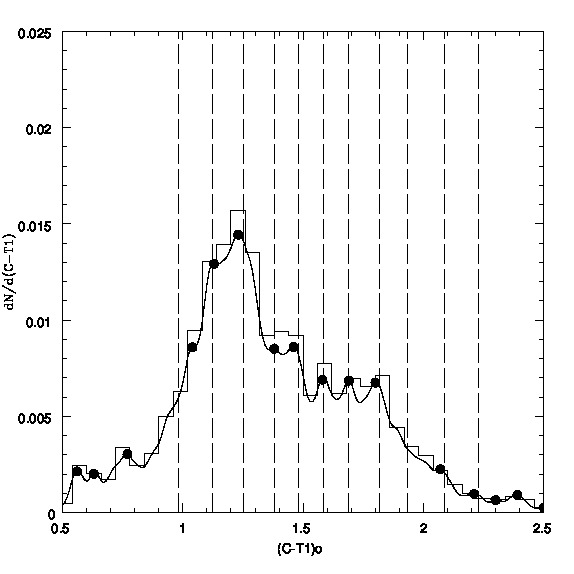
Finally, the corresponding to 1431 in fifteen moderately bright galaxies (-19.2 to -20.2) is depicted in Fig. 5. This figure shows all the peaks from [0.85] to [1.39] and yields an of only 0.007 mag. This group shows a prominent blue peak at [0.85]. This can be expected since, being smaller in angular size, their outer regions fall within the real coverage of the photometry.
The determination of the colours in was based on a galaxy sample that included galaxies fainter than Mg=-20.2. However, this section shows that this pattern can be also consistently recognized in the composite corresponding to the twelve giant galaxies listed in Table LABEL:table_1. Furthermore, the two brightest galaxies in Virgo (, and) have individual where the pattern is easily recognizable (see below).
The presence or absence of some colour peaks, at the blue or red edges of the , can be explained in terms of the different chemical enrichment levels that characterize each galaxy group. In general, the most massive galaxies (with high chemical enrichment) will show red components that become less evident or absent in lower mass galaxies.
Conversely, low mass galaxies will exhibit blue components (that are less prominent in the inner regions of massive galaxies).
The smoothed colour magnitude diagram for the 4289 sample corresponding to all the galaxies listed in Table LABEL:table_1, is shown in Fig. 6.
For constructing this diagram, the magnitudes and colours were mapped as components of a matrix defined between 20.0 and 25.0, and from 0.5 to 2.0. The routine was run on this matrix, generating a image after adopting a colour kernel of 0.015 mag, and a magnitude kernel of 0.25 mag. The first value is that used in the uni-dimensional analysis while the second one was set after runs (with magnitude kernels ranging from 0.10 to 0.50 mag) aiming at enhancing the presence of the colour pattern.
Fig. 6 is a false-colour display of the image (after adopting a proper minimum/maximum range and contrast) and shows a highly structured . The contour of the Gaussian kernel is shown at the upper right in this diagram.
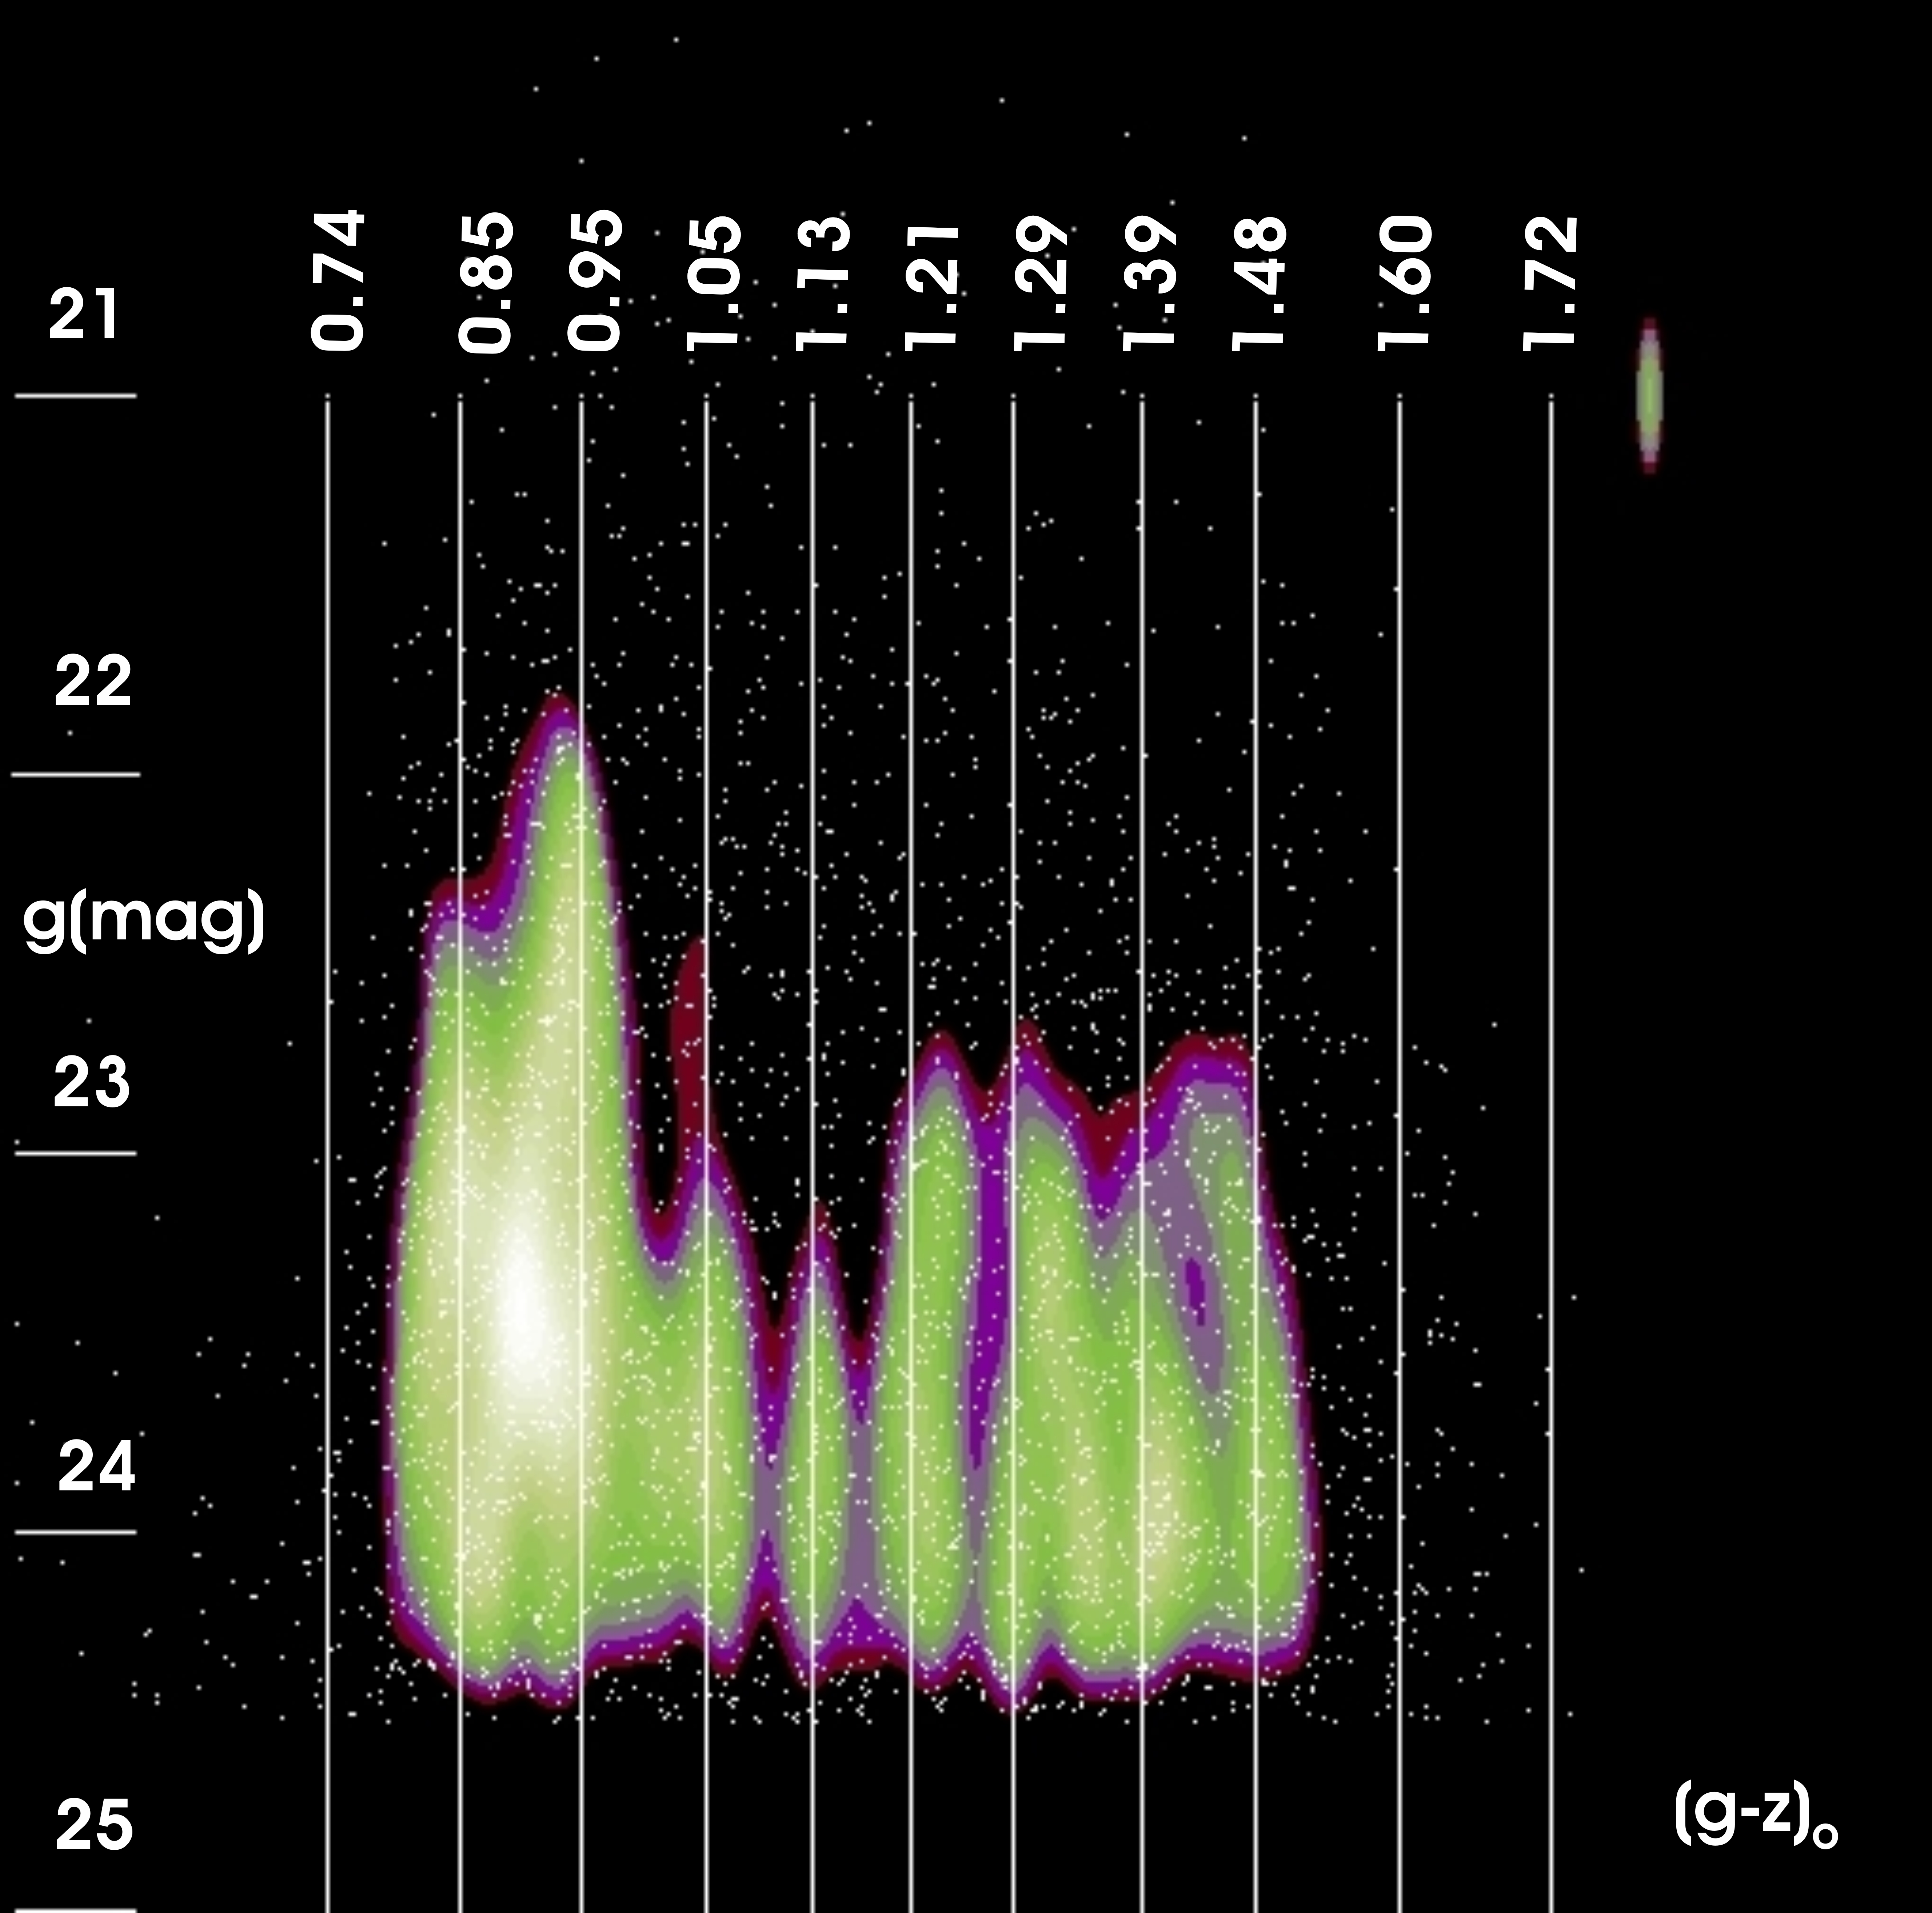
The expectation is that, if the colour patterns are not random effects, they should show some coherence in the colour magnitude plane. In fact, Fig. 6 indicates that the colour modulations are not the result of localized data "clumps" but, rather, distinct structures spanning different ranges in apparent magnitude and coincident with the colours, shown as vertical lines (see Section 6). The "widths" of these structures are in fact set by a combination of the and the convolving kernel.
A remarkable feature in the last diagram is the presence of two blue peaks [0.85; 0.95] that appear in most of the individual galaxies listed in Table LABEL:table_1.
| NGC | shift | Gal. range | N of GCs | |||
|---|---|---|---|---|---|---|
| 4472 | -0.05 | 40-100 | 330 | |||
| 4486 | -0.00 | 40-100 | 762 | |||
| 4649 | -0.02 | 40-100 | 355 | |||
| 4406 | +0.05 | 40-100 | 172 | |||
| 4382 | +0.03 | 40-100 | 176 | |||
| 4374 | -0.02 | 40-100 | 203 | |||
| 4365 | 0.00 | 40-100 | 304 | |||
| 4526 | +0.02 | 40-100 | 97 | |||
| 4621 | +0.01 | 40-100 | 144 | |||
| 4552 | -0.02 | 40-100 | 176 | |||
| 4473 | 0.00 | 40-100 | 99 | |||
| 4762 | 0.00 | 40-100 | 40 | |||
| 4459 | 0.00 | 0-100 | 128 | |||
| 4442 | 0.00 | 0-100 | 128 | |||
| 4754 | 0.00 | 0-100 | 61 | |||
| 4267 | 0.00 | 0-100 | 129 | |||
| 4371 | 0.00 | 0-100 | 120 | |||
| 4570 | 0.00 | 0-100 | 90 | |||
| 4435 | 0.00 | 0-100 | 120 | |||
| 4660 | 0.00 | 0-100 | 143 | |||
| 4530 | 0.00 | 0-100 | 113 | |||
| 4564 | 0.00 | 0-100 | 113 | |||
| 4340 | 0.00 | 0-100 | 29 | |||
| 4417 | 0.00 | 0-100 | 61 | |||
| 4638 | 0.00 | 0-100 | 58 | |||
| 4478 | 0.00 | 0-100 | 90 | |||
| 4578 | 0.00 | 0-100 | 48 |
4 The Template Virgo Pattern in NGC 4486
is a well known paradigm of the so called "high " galaxies (e.g. Tamura et al., 2006) and is the dominant system in Virgo in terms of its population. noted that the can be detected at some galactocentric radii and position angles ranges (see fig. 22 and 23 in that paper).
The presence of the is seen in Fig. 7 where the corresponds to 762 clusters with photometry and galactocentric radii from 40″to 90″. This diagram shows seven coincidences with the with an of 0.019. A disagreement is seen for the bluest for which the [0.85] feature appears some 0.04 mag. redder than expected. The behaviour of the bluest colours is similar to that described in the previous discussion regarding blue in the inner regions of massive galaxies.
In what follows we discuss the eventual detectability of the in the outer regions of using the photometry presented by . These ground based observations were obtained with the the telescope at , and adopting the colour index defined with these two passbands of the Washington photometric system.
A key issue in this context is a reliable determination of the vs colour-colour relation, aiming at obtaining the equivalent colours in the colour scale. This can be carried out using the photometry presented in Forte et al. (2013) for an offset field in . This field includes 522 candidates that also have Washington and photometry given in .
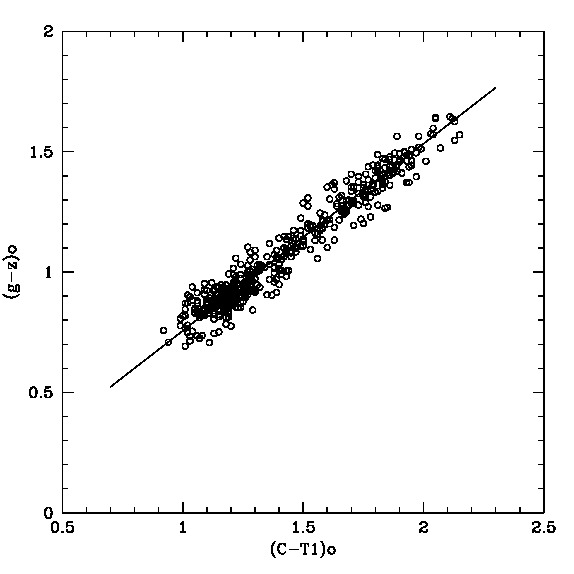
As a first step, an analysis of the colours was performed in an attempt to remove field interlopers. This procedure left 457 objects with colours that are fully compatible with those of old . The vs colour-colour diagram for these objects is shown in Fig. 8. The straight line in this figure corresponds to a bi-sector fit (i.e., taking into account the photometric errors on both axes):
| (1) |
(with coefficient uncertainties of 0.012 and 0.014, respectively).
The analysis of the residuals of this fit does not show any systematic trend or deviation from linearity with colour.
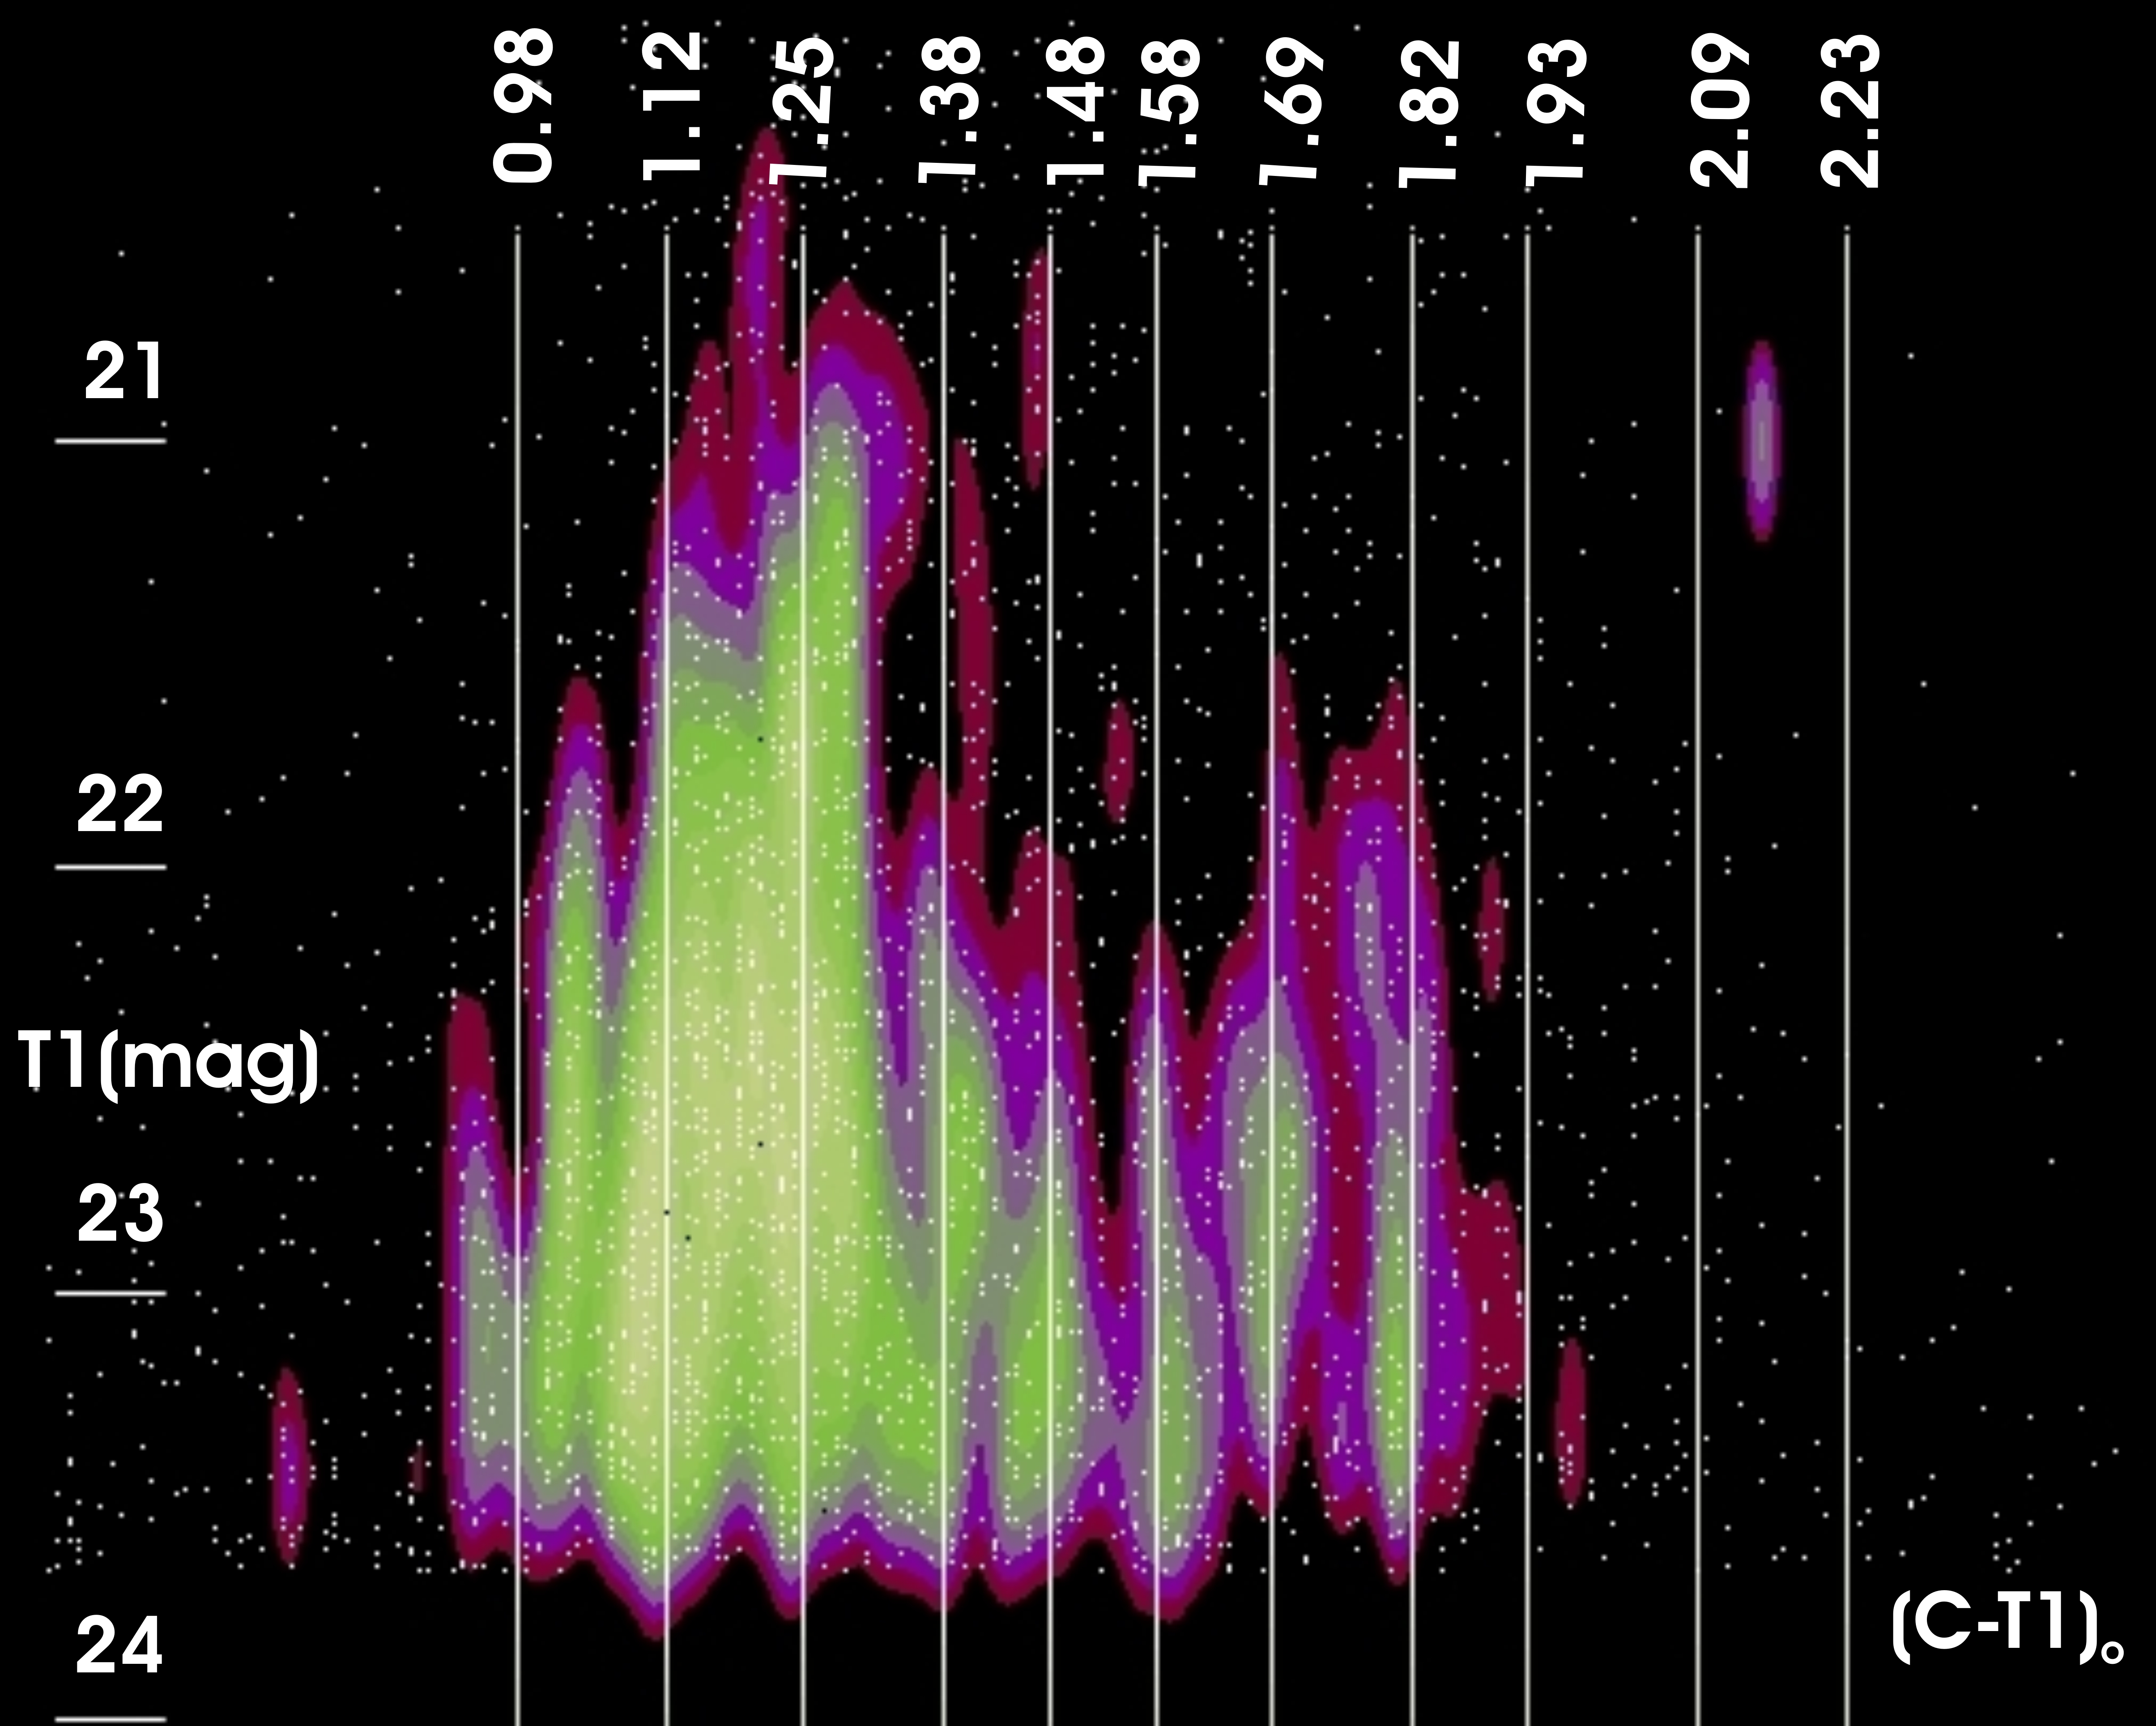
This relation then allows a link between the colours and those in the colour scale, with uncertainties below 0.015 mag., yielding: 0.98, 1.12, 1.25, 1.38, 1.48, 1.58, 1.69, 1.82, 1.93, 2.09, 2.23.
5 The GCCD in the outer regions of NGC 4486
5.1 The GCCD in NGC 4486 for galactocentric radii between 90 and 240 arcsec.
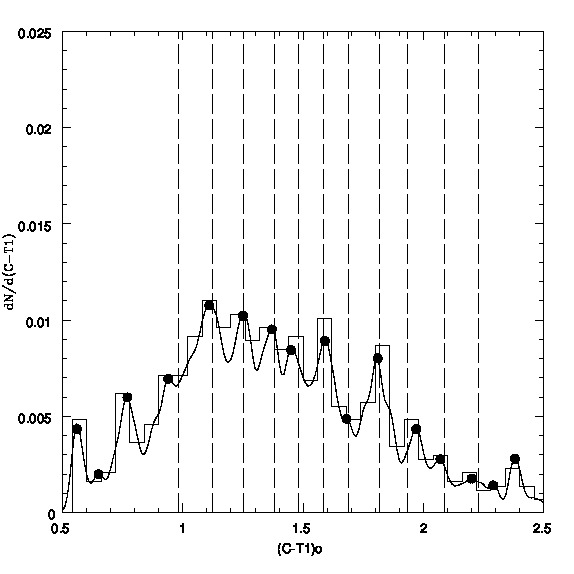
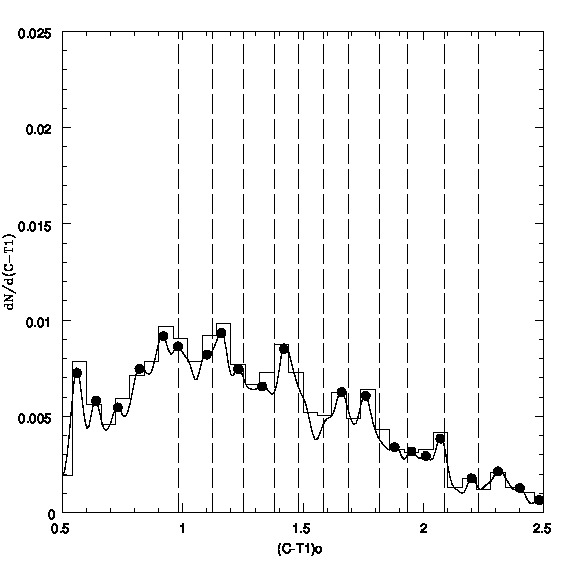
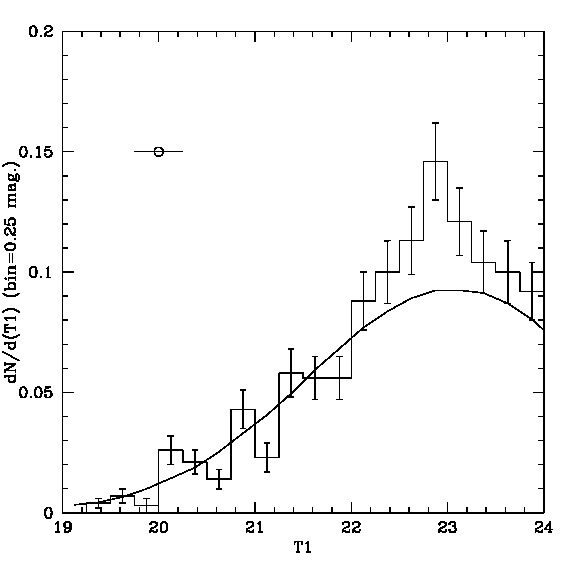
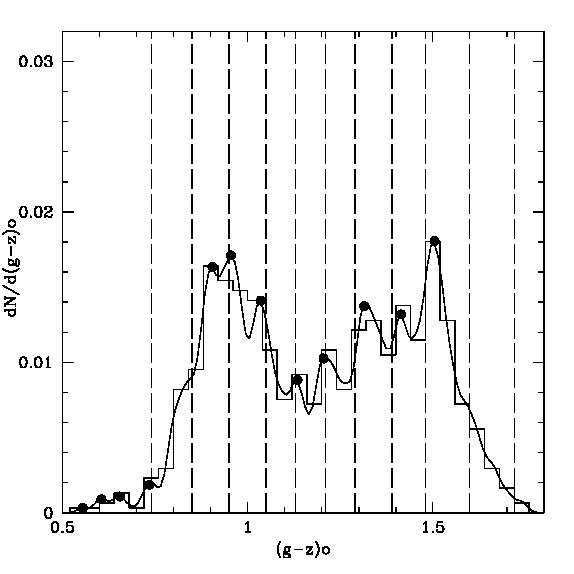
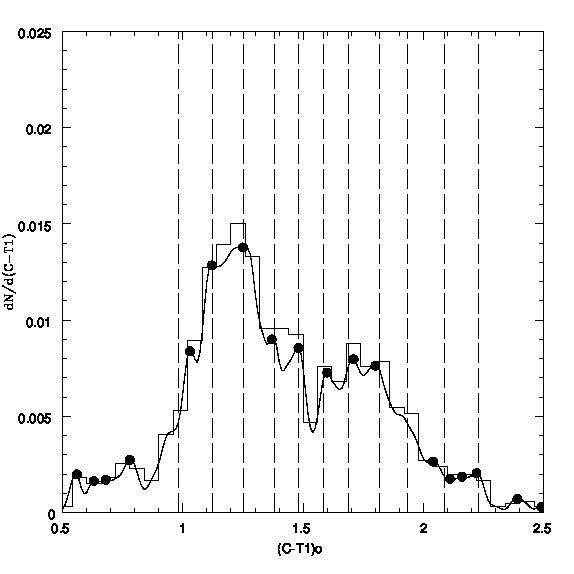
The for 2048 cluster candidates with galactocentric radii from 90 to 240 (with a complete areal coverage) is displayed in Fig. 9. This sample corresponds to a magnitude range from 20.0 to 24.0, i.e., some 0.5 mag. brighter than the photometric cut-off in . The detects seven peaks compatible with the [in the colour range from 1.12 to 1.82] with an of 0.023 mag. (or 0.018 mag. in a colour scale). This value is comparable with those that characterize the in Virgo galaxies, as discussed in Section 2 and 3. In fact, there is a clear similitude between Fig. 9 and Fig. 5, corresponding to associated with the moderately bright galaxies. This similitude indicates that, as a whole, the in this galactocentric range, have chemical abundances comparable to those in the bright galaxies sample listed in Table LABEL:table_1.
Fig. 9 also shows a feature at 1.04 that has not been found in the other galaxies and whose nature is discussed in Section 6.
Colour peaks redder than 1.82 are barely detectable and have not been included in the estimate of the values (constrained to the range from 0.93 to 1.87 in what follows). Only 8 percent of the cluster population in this sample are redder than 1.87 (making difficult the eventual detection of the reddest peaks).
The sample within this region was analysed as a function of the magnitude aiming at detecting the magnitude range where, eventually, the colour pattern would be better defined.
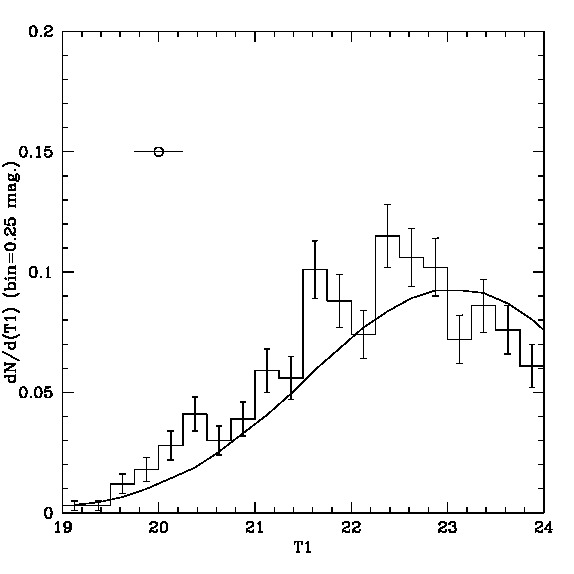
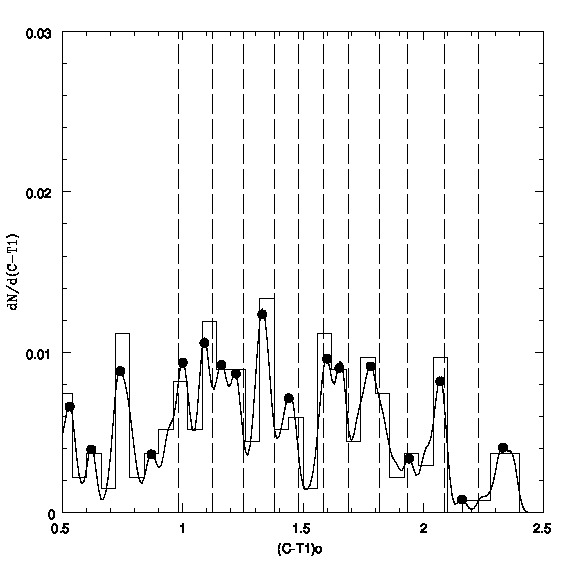
Fig. 10 is the corresponding to 588 clusters with 20.0 to 22.0 These objects probably include a fraction of objects overlapped with the brightest (e.g. Zhang et al., 2018). This sample is clearly dominated by blue and the pattern features are poorly defined ( 0.034).
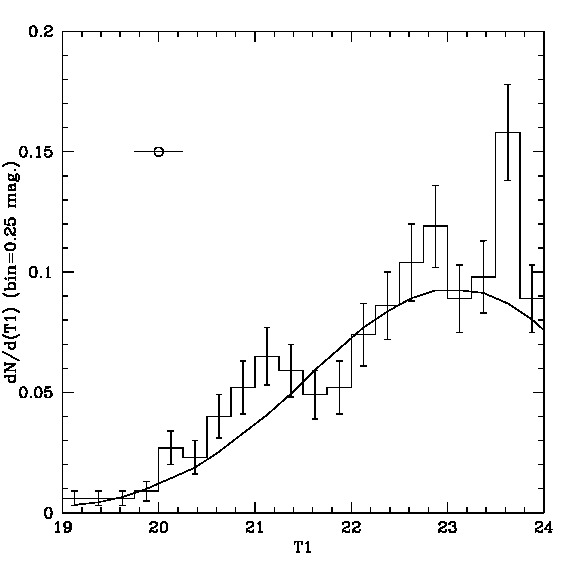
After adopting different ranges in the magnitudes, the best definition of the corresponds to clusters with 22.0 to 23.7 ( 0.019), shown in Fig. 11, and includes 1240 . The [1.04] feature is clearly seen in this diagram.
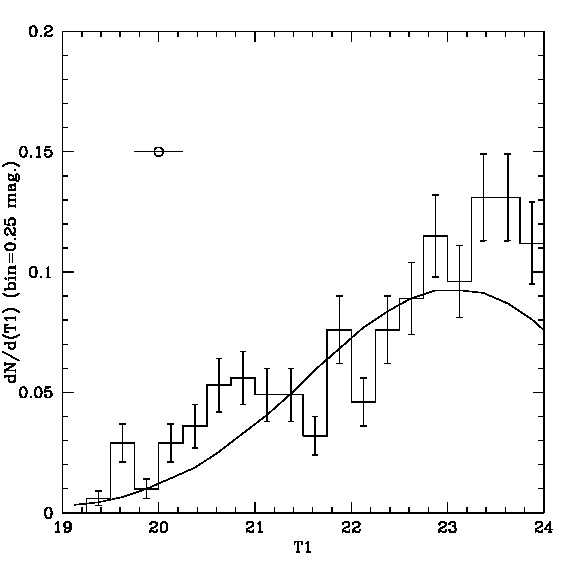
Finally, the faintest sample, corresponding to 23.7 to 24.00, and including 242 , exhibits the depicted in Fig. 12 (0.039). As expected, the does not seem to be detectable in this sample as a consequence of the larger photometric errors as well as for the presence of an increasing number of field interlopers.
5.2 The GCCD in NGC 4486 for galactocentric radii between 240″and 390″.
This region has an areal coverage of 80 percent in and its , displayed in Fig. 13, shows a single dominat blue peak and a rather disordered pattern with a large value of 0.035 mag. In principle, this result would indicate that the colour pattern is absent within that range of galactocentric radius.
A further test about this result was performed by analysing the on galactocentric annuli 30″wide. On these annuli, the generates the catalogue that allows the determination of the relative frequency of the colour peaks (a treatment similar to that described in Section 3), as well as the colour shift that brings the colour pattern within a given galactocentric annulus into agreement with the (by minimizing the colour values as explained before).
The number of within each annulus and the colour differences, are listed in Table LABEL:table_2.
| Gal. range (arcsec) | colour diff. | N of GCs | ||
|---|---|---|---|---|
| 90-120 | +0.02 | 176 | ||
| 120-150 | +0.02 | 149 | ||
| 150-180 | 0.00 | 220 | ||
| 180-210 | 0.00 | 180 | ||
| 210-240 | 0.00 | 180 | ||
| 240-270 | +0.04 | 179 | ||
| 270-300 | +0.08 | 190 | ||
| 300-330 | +0.08 | 190 | ||
| 330-360 | +0.09 | 194 | ||
| 360-390 | +0.10 | 195 |
We note that the photometry of in has a complete areal coverage in between 90 and 390 and position angles (N to E) from 90 to 270 (that corresponds to fifty percent of the total area) and that, in order to preserve an even coverage of the relative area of each annulus, the was run within these galactocentric limits. The magnitude range was set from 19.2 to 23.7 (corresponding to 20.0 to 24.5).
The relative frequency of the colour peaks based on 1853 , without any colour shift, is displayed in Fig. 14. Eight peaks redder than 1.38 have good coincidences with the colours (0.015). However, bluer peaks are in clear disagreement.
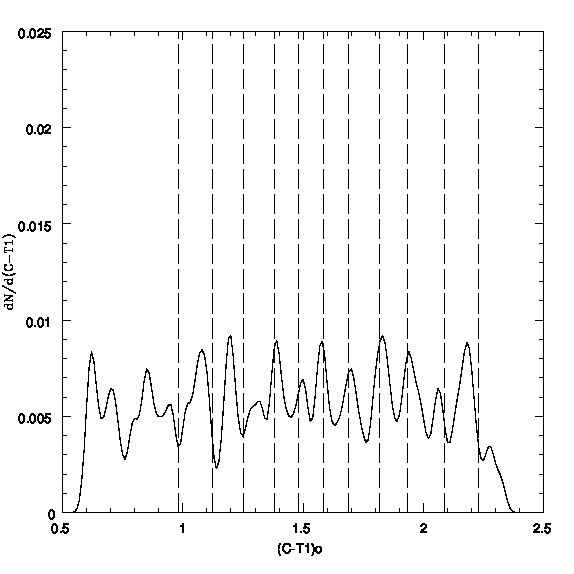
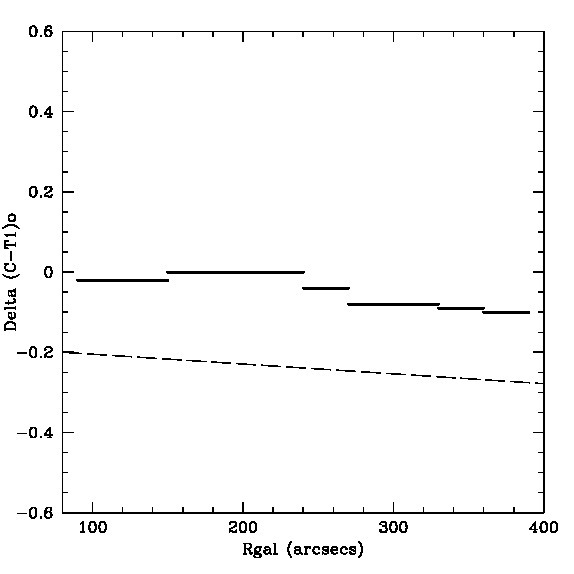
Fig. 15 exhibits the colour differences listed in Table LABEL:table_2 (with signs changed) plotted as a function of galactocentric radius. This figure indicates that the is detected with a consistent blueward trend as the galactocentric radius increases beyond 240. Thus, in this galactocentric range seem to have a lower chemical abundance level compared to those in the inner region of the galaxy (see previous Section). , this blueward trend can be identified with the galactocentric colour gradient found by Forte et al. (2012), indicated as a dashed line. This gradient corresponds to : /)]=2.610-4 mag./ (for 12 Gy old ).
The adoption of the colour shifts listed in Table LABEL:table_2, leads to the relative frequency of the colour peaks depicted in Fig. 16, where, on one side, the peaks increase their contrast (compared to those in Fig. 14) and, on the other, leads to a nearly complete correspondence with the colours(and a of 0.018).
Finally, the displayed in Fig. 17 and Fig. 18, correspond to magnitude ranges of 20.0 to 24.0 and 22.0 to 23.7, respectively. This last diagram, defined within the magnitude range where the pattern is better defined, displays the feature at [1.04] and also, coincidences with all the components, starting with the peak at [1.12].
5.3 The GCCD in NGC 4486 for galactocentric radii between 90″and 390″.
The composite , after combining the results discussed in the two previous subsections, and for two magnitude ranges (20.0 to 24.0 and 22 to 23.7), are presented in Fig. 19 (0.019) and Fig. 20 (0.017), respectively. Both diagrams display essentially the same colour patterns. This region covers an area about seven times larger than a typical frame and includes a contamination level by field interlopers between 10 and 15 percent at a limiting magnitude 23.7 (see Section 4), i. e., 200 to 250 objects. These field interlopers may produce spurious peaks that eventually smear-out the pattern.
The persistence of the as a function of spatial distribution is confirmed in Fig. 21 and Fig. 22, corresponding to the for objects with 22.0 to 23.7 and position angles from 0°to 180° (0.018) and 180°to 360° (0.017), respectively.

On the other side, the behaviour of the for different ranges of the magnitude, after adopting the colour shifts listed in Table 2, is displayed in Fig. 24 to Fig. 28. The first of these diagrams corresponds to 946 objects with from 20.0 to 22.0. This has a dominant and single blue peak [1.25]. As noted previously, some degree of contamination by ultra compact objects can be expected in this range of magnitude. In turn, Fig. 25 ( 22.0 to 22.7; 816 objects), Fig. 26 ( 22.7 to 23.25; 777 objects), and Fig. 27 ( 23.25 to 23.7; 785 objects), show the presence of seven to eight features. These ranges in magnitude were set in order to include an approximately similar number of cluster candidates (800 objects). The blue peak at (1.04) is seen in both Fig. 25 and Fig. 26.
Fig. 28 corresponds to 1212 objects with from 23.7 to 24.5. In this sample the is not detectable as a consequence of the larger photometric errors as well as the presumably increasing number of field interlopers.
In turn, Fig. 23 shows the smoothed colour-magnitude diagram (similar to that introduced in Fig. 6). In this diagram, that includes 3324 , we set a magnitude cut off at 23.70, as fainter clusters do not show the (see Fig. 12). The contour of the assymetric convolving kernel (0.25 mag. in and 0.019 mag. in ) is displayed at upper right. Again, as in Fig. 6, the seems highly structured and in concordance with the colours.
Besides the two dominant blue peaks, at [1.12] and [1.25], Fig. 23 suggests the presence of several bluer components, being the feature at [1.04] the most prominent one.
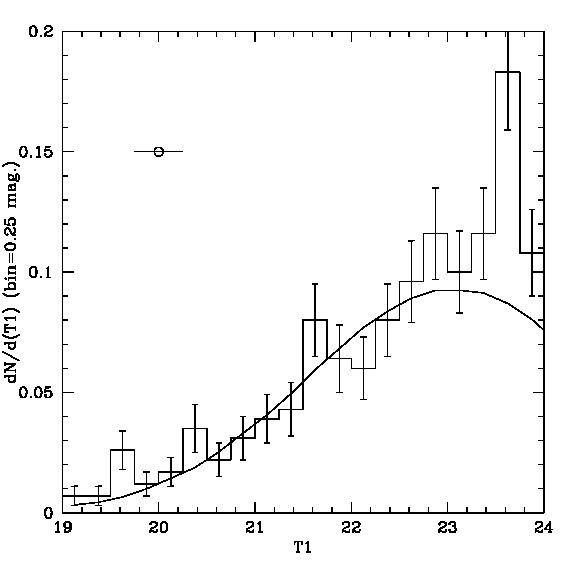
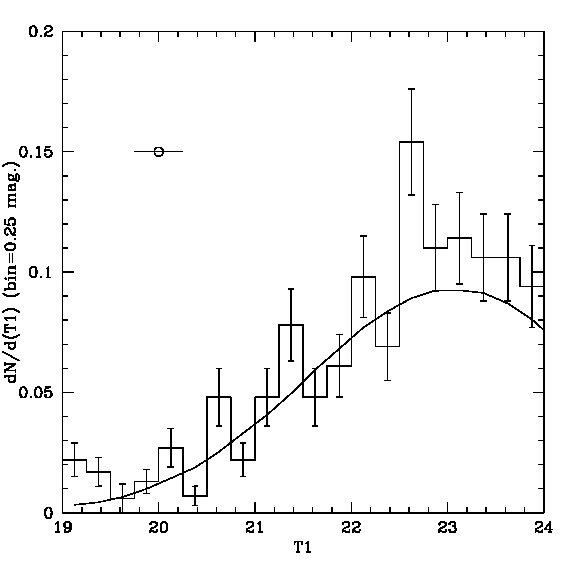
6 The integrated GC Luminosity Functions of the TVP components in NGC 4486.
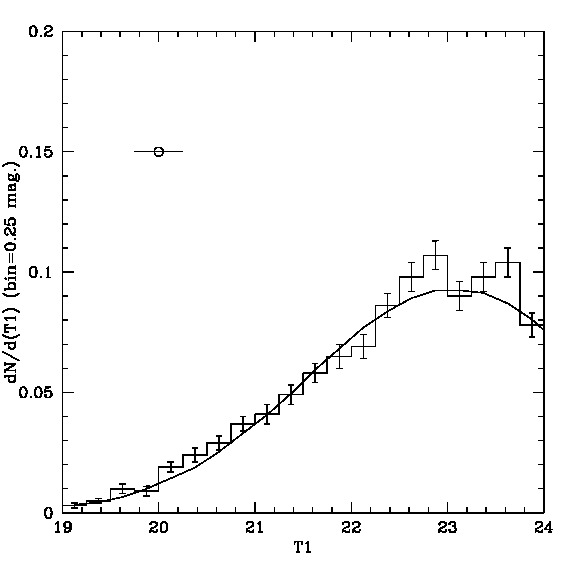
The integrated luminosity function ( in what follows) corresponding to 2931 with colours from 0.93 to 2.28 (and normalized by the total number of clusters) is displayed in Fig. A6. As expected, this distribution can be properly represented with a Gaussian function characterized by a mean magnitude =23.3 and a dispersion 1.3 mag, also shown in this and in figures A7 to A16. The turn-over magnitude is consistent with that derived by Villegas et al. (2010). All these diagrams include the size of the convolving kernel (adopted for Figs. 6 and 23) which is about 5 percent of the total range in the magnitude.
In order to explore the nature of the colour peaks that define the , we analysed the characteristics of both the distribution of the on the sky and of their integrated luminosity functions. This analysis was performed adopting 0.1 mag. colour windows centered at the detectable components and also at the [1.04] feature.
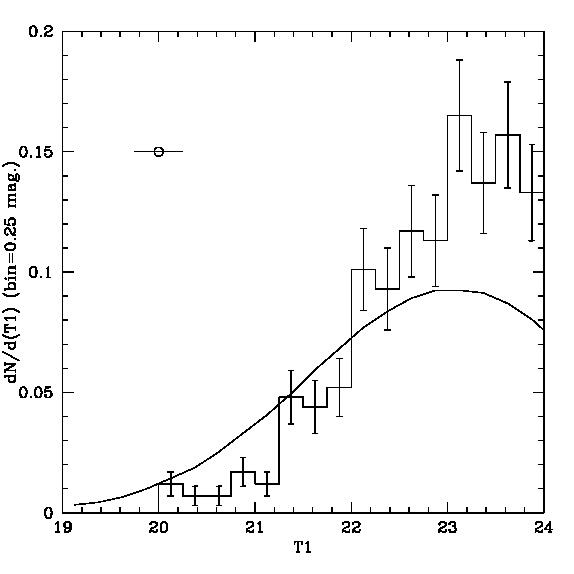
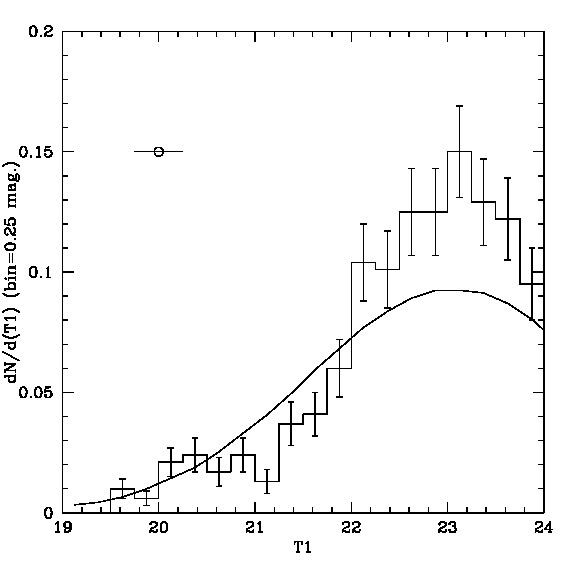
The nature of the [1.04] colour peak is intriguing. This feature, and in general objects bluer than 1.17, share similar and very shallow spatial distributions. Their , shown in Fig. A7, A8, and A9 are also similar and steeper than the Gaussian that gives a good representation of the whole sample. It is tempting to suggest that, at least a fraction, of this population of candidates are in fact members of the so called "Virgo Intra Cluster GC population" (e.g. Ko et al., 2017) although this cannot be proven just on photometric data.
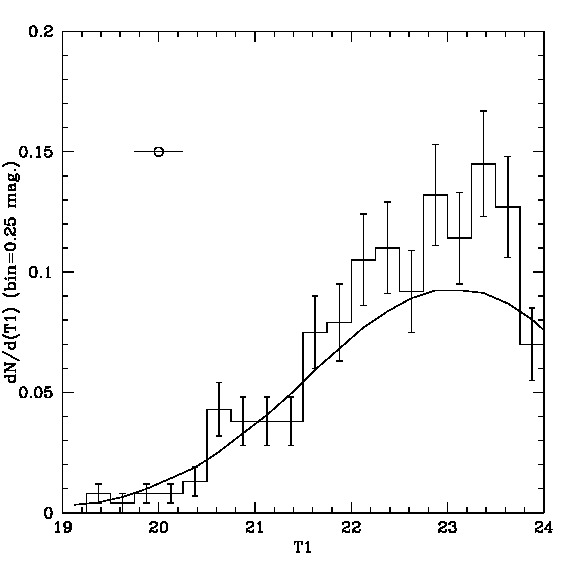
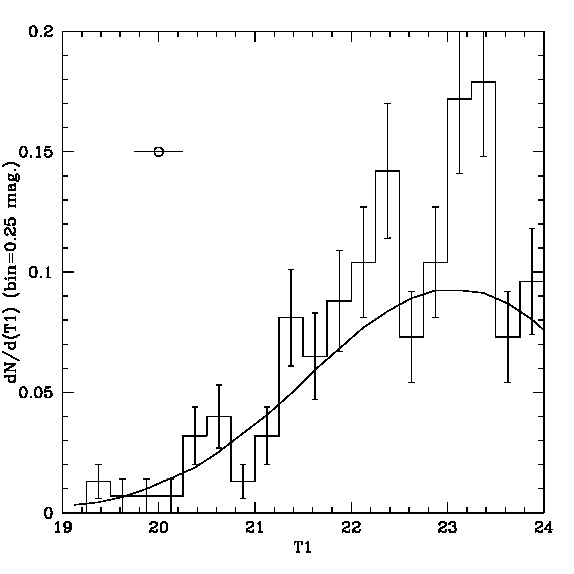
The remaining components show a variable degree of concentration towards the galaxy centre, that increases with redder colours.
In general, the shown in Fig. A7 to A16 are broadly consistent with the Gaussian approximation shown in Fig. A6 (i.e., the observed counts are within 3 times the expected Poissonian deviations). However, the clarification of the nature of some "clumps" in these figures will require further photometric and spectroscopic data.
7 Conclusions
In summary, this paper reports that:
-
1.
A revision of the colours, after increasing the sample by a factor of three, compared to that discussed in , confirms that the pattern is a solid feature detectable in the 27 brightest Virgo galaxies, including 12 giant galaxies not considered in that work.
-
2.
After grouping the in these 27 galaxies in three independent samples, each with approximately the same number of objects ( 1400 clusters), the exhibit between six and eight colour peaks that are compatible with the components of the presented in .
-
3.
At least seven of the components are readily detectable in , for having photometry, and from 40″to 90″.
-
4.
In turn, a new analysis of the photometry in the and filters (Washington system) presented in for in , indicates that the is detectable on the colours in a galactocentric range from 90 to 240 without requiring any colour shift. This sample includes some 2000 objects and does not overlap with the clusters of the inner regions of the galaxy.
-
5.
Clusters with from 240 to 390 require redward colour shifts in order to match the colour patterns in different galactocentric annuli in to the colours . As a whole, these shifts are compatible with the galactocentric colour gradient determined in Forte et al. (2012) and suggest that these clusters have lower chemical abundances than those that defined the .
-
6.
The adoption of a distance modulus of 31.1 for the Virgo cluster (e.g. Tonry et al., 2001), then indicates that the is detectable, at least, in a galactocentric range of 3 to 30 Kpc (40″to 390″).
-
7.
The presence of the is not only detectable at different galactocentric radii but also when the sample in the whole galactocentric range from 90″to 390″is split as a function of position angle (e.g., from 0°to 180°and from 180°to 360°).
-
8.
The detection of the on top of the clusters colour gradient in , suggests that these features were eventually imprinted during the dissipative collapse stage of the formation of the galaxy.
-
9.
Globally, the components are detectable on the two cluster (blue and red) sub populations that define the broad colour "bi-modality" in (see, for example, ).
-
10.
The presence of the pattern on both the and colours, and in different samples, gives a strong argument to reject instrumental effects as the origin of that pattern. Another argument in the same sense is provided by the fact that the is not evident neither for belonging to galaxies fainter than -18.2, nor for clusters inside a galactocentric radius of 40″in giant galaxies. Other causes, as contamination by field interlopers or statistical fluctuations were already rejected in .
-
11.
The existence of two blue components, with =0.85 and 0.95 respectively, and most evident for clusters in moderately bright galaxies (i.e. -20.2 to -19.2), is consistent with a similar situation detectable in the outer regions of (with corresponding colour peaks at 1.12 and 1.25).
-
12.
Regarding the eventual "universality" of the (and as noted in ), each system might have clusters that are part of its own history (including galaxy mergers, etc.) as well as other clusters that eventually formed in connection with the . Because of this, the detectability would depend on each particular case. However, the pattern emerges even in massive galaxies with presumably complex histories, as , discussed in this paper.
A tentative explanation for the colour patterns, given in , suggests that an external mechanism has been able to modulate the formation over supra-galactic spatial scales in a kind of , at high redshifts, and following what seems to be a temporal sequence. If this is the situation, the effect of such a putative phenomenon might also have left its signature early on the diffuse stellar population of these galaxies.
The lack of substantial evidence supporting a given candidate mechanism ( activity ? sub-cluster merger events ?) that could be responsible for the colour pattern, defines the current situation as a ("…a question or problem having only a conjectural answer"; Merriam-Webster dictionary) that deserves further exploration.
Acknowledgements
This work was funded with grants from Consejo Nacional de Investigaciones Científicas y Técnicas de la República Argentina . J.C.F. thanks
Dr. Gustavo Corach for his hospitality at the IAM-CONICET. D.G. gratefully acknowledges support from the Chilean Centro de Excelencia en Astrofísica y Tecnologías Afines (CATA) BASAL grant AFB-170002,
and also the financial support from the Dirección de Investigación y Desarrollo de
la Universidad de La Serena through the Programa de Incentivo a la Investigación de
Académicos (PIA-DIDULS).
References
- Brodie & Strader (2006) Brodie J. P., Strader J., 2006, ARA&A, 44, 193
- Escudero et al. (2018) Escudero C. G., Faifer F. R., Smith Castelli A. V., Forte J. C., Sesto L. A., González N. M., Scalia M. C., 2018, MNRAS, 474, 4302
- Ferrarese et al. (2006) Ferrarese L., et al., 2006, ApJS, 164, 334
- Forte (2017) Forte J. C., 2017, MNRAS, 468, 3917
- Forte et al. (2007) Forte J. C., Faifer F., Geisler D., 2007, MNRAS, 382, 1947
- Forte et al. (2012) Forte J. C., Vega E. I., Faifer F., 2012, MNRAS, 421, 635
- Forte et al. (2013) Forte J. C., Faifer F. R., Vega E. I., Bassino L. P., Smith Castelli A. V., Cellone S. A., Geisler D., 2013, MNRAS, 431, 1405
- Harris et al. (2017) Harris W. E., Ciccone S. M., Eadie G. M., Gnedin O. Y., Geisler D., Rothberg B., Bailin J., 2017, ApJ, 835, 101
- Jordán et al. (2009) Jordán A., et al., 2009, ApJS, 180, 54
- Jordán et al. (2015) Jordán A., Peng E. W., Blakeslee J. P., Côté P., Eyheramendy S., Ferrarese L., 2015, ApJS, 221, 13
- Ko et al. (2017) Ko Y., et al., 2017, ApJ, 835, 212
- Schlafly & Finkbeiner (2011) Schlafly E. F., Finkbeiner D. P., 2011, ApJ, 737, 103
- Sesto et al. (2016) Sesto L. A., Faifer F. R., Forte J. C., 2016, MNRAS, 461, 4260
- Tamura et al. (2006) Tamura N., Sharples R. M., Arimoto N., Onodera M., Ohta K., Yamada Y., 2006, MNRAS, 373, 601
- Tonry et al. (2001) Tonry J. L., Dressler A., Blakeslee J. P., Ajhar E. A., Fletcher A. B., Luppino G. A., Metzger M. R., Moore C. B., 2001, ApJ, 546, 681
- Villegas et al. (2010) Villegas D., et al., 2010, ApJ, 717, 603
- Zhang et al. (2018) Zhang H.-X., et al., 2018, ApJ, 858, 37
Appendix A Additional diagrams.