Maximum Likelihood Analysis of Reaction Coordinates during Solidification in Ni
Abstract
Understanding the underlying mechanism of crystal nucleation during solidification is a fundamental aspect in the prediction and control of materials properties. Classical nucleation theory (CNT) assumes that homogeneous nucleation occurs via random fluctuations within the supercooled liquid, that the structure of the growing clusters resembles the most stable bulk phase, and that the nucleus size is the sole reaction coordinate (RC) of the process. Many materials are, however, known to exhibit multiple steps during crystallization, forming different polymorphs. As a consequence, more complex RCs are often required to capture all relevant information about the process. In this work, we employ transition path sampling together with a maximum likelihood analysis of candidate order parameters to identify suitable reaction coordinates for the nucleation mechanism during solidification in Ni. In contrast to CNT, the analysis of the reweighted path ensemble shows that a pre-structured liquid region that surrounds the crystal cluster is a relevant order parameter that enhances the RC and therefore plays a key role in the description of the growing nucleus and the interfacial free energy. We demonstrate that pre-structured liquid clusters that emerge within the liquid act as precursors of the crystallization in a non-classical two-step mechanism which predetermines the coordination of the polymorphs that are being selected.
I Introduction
Crystal nucleation is a fundamental process of solidification observed in a large variety of phenomena across different disciplines from physics to biology. Despite its importance, understanding the mechanism of crystal nucleation on the atomistic level remains elusive due to the time and length scales of the process that hamper experimental and computational techniques Sosso et al. (2016); Anwar and Zahn (2011); Jungblut and Dellago (2016). For atomistic simulations, the identification of a meaningful reaction coordinate (RC) is a crucial step to understand the mechanism of nucleation, but the high dimensionality and extended timescales of the process often pose a major challenge in the identification of order parameters that define the RC.
Classical nucleation theory (CNT) Becker and Döring (1935); Binder (1987) provides a simple, phenomenological description of the nucleation mechanism, where the free energy of a growing crystalline nucleus is described by the competition between a volume and a surface term. The volume term leads to a decrease in energy associated with the difference in chemical potential between the solid and the liquid phase, whereas the surface term increases the energy due to the formation of a solid-liquid interface. An essential assumption of CNT is that nucleation is a one-dimensional process, i.e. described by a single RC, namely the radius of the spherical cluster or the size of the crystal nucleus. Other core assumptions of CNT are that small clusters of hundreds of particles emerge randomly within the liquid, having the same thermodynamic properties (the capillarity approximation) and crystal structure as the bulk. However, atomistic simulations that allow to follow different order parameters along the nucleation pathway or sample multi-dimensional free energy landscapes have revealed a variety of examples where nucleation can proceed via the ordering of more than one order parameter, Moroni et al. (2005); Trudu et al. (2006); Lechner et al. (2011a); Peters and Trout (2006); Russo and Tanaka (2016) and where the polymorphs that are formed do not always correspond to the thermodynamically most stable phase of the bulk. Lechner et al. (2011a); Wang et al. (2007); Beckham and Peters (2011); Jungblut and Dellago (2013); ten Wolde and Frenkel (1997) Recently, two-step non-classical nucleation mechanisms have raised great interest and were found in several systems including hard spheres, colloidal systems, globular proteins and metallic systems. ten Wolde and Frenkel (1997, 1999); Schilling et al. (2010); Kawasaki and Tanaka (2011); Russo and Tanaka (2012a, b, 2016); Leines et al. (2017) In these cases, the nucleation occurs via the formation of regions within the undercooled liquid of either high density or high orientational order that act as seeds or precursors of the crystallization. A pre-ordered surface region that embeds a crystal core was recently shown to enhance the RC for nucleation in colloidal suspensions Lechner et al. (2011b) resulting in a two-dimensional description of nucleation process and a reinterpretation of the surface-volume variables within CNT.
Our previous findings indicate that homogeneous nucleation in Ni also occurs via a two-step crystallization process where long-lived mesocrystal regions of high orientational order mediate the nucleation of the crystal phase that grows embedded in a pre-structured liquid cloud. Leines et al. (2017) But it remains still unclear if the pre-structured region triggers the initial nucleation in the Ni melt and which role it plays in defining the RC of the process. In the present study we approach these open questions and investigate the formation of different crystal structures with a multi-dimensional analysis of the microscopic pathways for nucleation in Ni. We employ statistical path ensembles from transition path sampling (TPS) simulations Dellago et al. (2002); van Erp and Bolhuis (2005) and perform a quantitative analysis of the RC and the free energy landscape of the nucleation process by maximum likelihood estimation (MLE). Peters and Trout (2006); Rogal et al. (2010); Lechner et al. (2010) The quality of different order parameters as RC is evaluated by their ability to model the committor data obtained from the path ensemble, where the committor or commitment probability is a statistical measure of the progress of a reaction. In particular, we employ the MLE approach to extract a non-linear description of the RC from the reweighted path ensemble (RPE). Lechner et al. (2010); Rogal et al. (2010) We show that the pre-structured liquid cloud significantly enhances the description of the RC, whereas the size of the cluster composed only of face-centered cubic (fcc) atoms, i.e. atoms with the structure of the final bulk phase as suggested by CNT, provides a much less suitable RC. Including the pre-structured cloud in the RC furthermore improves the description of the interfacial free energy between the growing nucleus and the liquid, resolving a discrepancy between the nucleation barrier (and associated rate constant) obtained by CNT and experiments. Bokeloh et al. (2011) The unbiased free energy landscape obtained from the RPE Bolhuis and Lechner (2011); Rogal et al. (2010) reveals a non-classical nucleation pathway for solidification in Ni. The nucleation proceeds via the initial formation of a long-lived mesocrystal region of higher orientational order than the liquid but less symmetry than the crystal structures. Subsequently, the crystalline phase emerges within the core of this region and prevails in the core of the growing cluster. The mesocrystal region is mainly composed of distorted polyhedra with 12 vertices that resemble the coordination polyhedra in fcc and hexagonal close-packed (hcp) structures, indicating that the pre-ordered regions within the liquid pre-determine the polymorph selected during the crystallization, therefore acting as a precursor of the nucleation process.
This paper is organized as follows: in Sec. II we present the methods used to analyze the RC of nucleation during solidification in Ni; in Sec. III we discuss the nucleation mechanism obtained from TPS simulations and possible candidate order parameters for the RC; in Sec. IV we present the MLE analysis of the RC and we discuss the role of the pre-structured liquid cloud in the nucleation mechanism; we conclude our findings in Sec. V.
II Methods
II.1 Transition interface sampling
Crystal nucleation is an activated process where a large free energy barrier separates the melt from the solid state. To sample the transition from liquid to solid during nucleation in Ni requires an advanced rare event method. Here, we employ transition interface sampling (TIS), van Erp and Bolhuis (2005) a method that allows to explore an ensemble of phase space trajectories (or paths) between two stable states and (liquid and solid) using a Monte Carlo (MC) framework in trajectory space. While the original transition path sampling method (TPS) Dellago et al. (2002) includes only the transition paths, i.e. trajectories connecting the two stable states and , the TIS method samples all possible trajectories of the ensemble and yields an efficient calculation of rate constants and free energy profiles. In this approach a collection of non-intersecting interfaces, defined by hypersurfaces along a progress order parameter , are introduced between the two stable states. An ensemble of trajectories is sampled for each interface such that a trajectory is accepted in the MC step if it starts and ends in one of the stable states or , and if it crosses the interface . Two kinds of ensembles are sampled with the TIS method, the forward ensemble which includes all trajectories that leave region , and the backward ensemble , which includes the reverse transition, i.e. all trajectories that start in region .
In this work, we sample the TIS ensemble of trajectories using the shooting algorithm, Dellago et al. (1998) where a slight perturbation of the momenta and/or positions is performed for a configuration randomly selected from a trial path. A new trajectory is generated by integrating the equations of motion forward and backward in time from the modified configuration. If the new path begins and ends in either of the stable states or and crosses the corresponding interface it is accepted. For an efficient exploration of the trajectory space we further employ exchange moves where trajectories between subsequent interface ensembles are swapped yielding a combination of the TIS algorithm with the replica exchange approach (RETIS). van Erp (2007); Bolhuis (2008)
II.2 Reweighted path ensemble
An estimate of the unbiased path ensemble can be obtained by reweighting the trajectories of the TIS path ensemble Rogal et al. (2010) according to their correct contribution to the Boltzmann factor using the weighted histogram analysis method (WHAM). Ferrenberg and Swendsen (1989) The reweighted path ensemble (RPE) Rogal et al. (2010) is given by
| (1) |
where and are the TIS forward and backward ensembles of trajectories per interface, denotes a trajectory or a sequence of phase space points , and and are constant factors obtained from and path histograms to fix the relative weights in the RPE (see Ref. Rogal et al., 2010). Here, and are the path weights calculated from the crossing probabilities of the paths for each interface by using WHAM.
Once we obtain a complete and unbiased path ensemble other statistical quantities like the free energy and the averaged committor function can be projected on a set of collective variables (CVs or order parameters) :
| (2) |
where is Boltzmann’s constant and is the probability density to find a configuration in the path ensemble :
| (3) |
Here indicates the path integral evaluated in the RPE, is the Dirac delta function and is a normalization constant.
Similarly, the averaged committor probability can be projected on any set of collective variables Bolhuis and Lechner (2011) by histogramming all the trajectories of the RPE that commit to state : Bolhuis and Lechner (2011)
| (4) |
where is a function that selects trajectories by assigning a value of one to paths that end in state and zero otherwise.
II.3 Maximum likelihood estimation
The RPE holds dynamical information of the committor function that can be used to analyze the RC of the process by employing a maximum likelihood estimation (MLE). Husmeier (2005); Peters and Trout (2006) The committor is defined as the probability that a trajectory starting at a phase space point will reach state before coming back to state . Therefore configurations at the transition state yield a committor value of , i.e. the trajectory has the same probability to reach or , while and at the stable states and , respectively. The committor is commonly seen as the perfect RC since it provides a measure of the progress along the reactive event. However, the committor itself cannot be directly compared to experiments as it lacks a physical interpretation of the mechanism. For this reason, a committor is commonly used as a model of the perfect RC to evaluate the quality of , a function of a set of candidate order parameters proposed to describe the mechanism. Using the MLE approach it can be evaluated which model committor function best fits the data from the path ensemble, allowing a quantitative comparison of different sets of order parameters. Peters and Trout (2006); Peters et al. (2007)
In the MLE analysis the committor function is modeled with a function:
| (5) |
yielding the typical shape along the RC. In the original work by Peters et al. Peters and Trout (2006) the configurations of the TPS ensemble are collected near the transition state region, for which a linear combination of CVs is proposed to model . Since in this work we are aiming to capture the entire transition between the stable states and we use a 1D string in the -dimensional collective variable space as a non-linear model of as proposed by Lechner et al.. Lechner et al. (2010) The string consists of images in the CV space and is parametrized by a progress parameter where corresponds to state and corresponds to state . The parameter defines a path-variable that projects the phase space points onto the string. This is done using a Voronoi construction that assigns each to the closest two string images in CV space followed by a piecewise monotonic interpolation to obtain a continues value of , which is then mapped to the RC by a function (typically a simple monotonic spline function). Lechner et al. (2010) The corresponding likelihood is given by
| (6) |
where are the weights assigned to each phase space configuration of each path in the RPE, cf. Eq. (1). denotes the product over all phase space points from trajectories that end in , and from all paths that end in , respectively. Using the expression in Eq. (6) the images of the string and the corresponding and are adjusted to maximize the likelihood with a Monte Carlo annealing scheme (described in Ref. Lechner et al., 2010).
For convenience, the likelihood is usually expressed as the logarithm . The absolute value of the logarithmic likelihood increases with the number of data points (phase space points from the path ensemble) as well as with the number of degrees of freedom in the model (dimension of the CV space, number of string images). Therefore we cannot directly compare for spaces of different dimensionality. Instead, the Bayesian information criterion Schwarz (1978) (BIC) is used to determine if there is a significant improvement of the likelihood when adding an additional variable. According to the BIC, additional variables benefit the model when the following quantity is maximized:
| (7) |
where is the weighted number of data points from the RPE and is the number of variables used to describe the model. In our case , where is the dimension of the CV space and is the number of string images, considering that the end points of the string are fixed.
III Nucleation during solidification in Nickel
III.1 TIS simulations
For the reaction coordinate analysis of nucleation during solidification in homogeneous Ni, we perform RETIS simulations at a moderate undercooling (cf. Ref. Leines et al., 2017). The ensemble of trajectories is sampled between the liquid and solid phases in a system of 8788 Ni atoms. We employ the embedded atom method (EAM) potential by Foiles et al. Foiles et al. (1986) to model the interaction between the Ni atoms. All molecular dynamics (MD) simulations are performed at constant pressure bars and temperature K (NPT ensemble), which corresponds to an undercooling of . The MD simulations were performed with the package LAMMPS, Plimpton (1995) using a time step of fs and minimum image periodic boundary conditions in all directions. The LAMMPS code was combined with a python wrapper to carry out the RETIS simulations. In the RETIS simulations, we performed 45% shooting moves, 45% exchange moves and 10% exchange moves between forward and backward ensembles for the MC sampling of trajectories. A total of 2500 MC moves were performed with paths being collected in the ensemble after 5 decorrelation steps yielding 500 trajectories for each interface. The amplitude of the velocity perturbation in the shooting moves was adjusted such that an acceptance ratio larger than is obtained. The time interval between slices stored along a path was set to 0.2 ps. The positions of the interfaces were set such that the crossing probabilities overlap by at least . We employ the largest solid cluster size as an order parameter to define the interfaces of the ensemble (see Sec. III.2 for a definition of ). The first interface defines the boundary of the undercooled liquid region, and the last interface the boundary of the solid state region with . All configurations with are fully committed to the bulk phase.
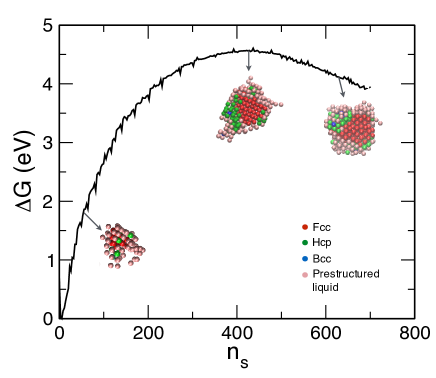
At the chosen undercooling the free energy barrier obtained from the RPE and projected onto the largest cluster size is eV (see Fig. 1), with an associated timescale of hundreds of seconds. Our previous simulations show that the free energy barriers for undercoolings in the range of are in close quantitative agreement with CNT and experiments. Leines et al. (2017) However, the analysis of the RPE in Ref. Leines et al., 2017 reveals that the mechanism of nucleation in Ni differs from the one predicted by CNT: the solid clusters are mostly non-spherical, exhibit random fcc-hcp stacking, and have a diffusive solid-liquid interface. As illustrated in Fig. 1, the growing nuclei are composed of fcc atoms in the core region surrounded by random hcp (stacking faults) and a pre-structured liquid cloud that forms the diffusive surface between the liquid and the crystal. Bcc coordinated atoms are rarely found in the growing nuclei. The nucleation process was also found to initiate in long-lived regions of pre-structured liquid characterized by a higher correlation than the liquid but less symmetry than the crystal phases (a mesocrystal phase) followed by a subsequent emergence of the crystal phase within the core of the pre-structured clusters. Leines et al. (2017) To quantify the role of the different crystal phases in the growing clusters and mesocrystal regions observed during the nucleation, we perform a MLE analysis of various structural CVs to identify the optimal RC that describes the nucleation process.
III.2 Order parameters to study nucleation
We now introduce a set of order parameters that serve as candidates for the RC of the crystallization mechanism during homogeneous nucleation in Ni. A standard approach to distinguish between solid-like and liquid-like particles was introduced by ten Wolde and Frenkel, based on the Steinhardt bond order parameters. Steinhardt et al. (1983); Auer and Frenkel (2005) In this method, the structural correlation in the neighborhood of each particle is obtained using a local criterium of solidity. A particle is connected to a neighbor particle in a solid bond if the correlation , where are the complex vectors based on the spherical harmonics. Steinhardt et al. (1983) If a particle has between solid connections, it is identified as solid. To improve the solidity distinction criterium at the interface of the solid clusters, another parameter is defined as the average of the correlation over the nearest neighbors . This parameter includes a measure of the disorder surrounding a particle : if , particle is considered as solid. These two criteria together with a clustering algorithm of nearest neighbors are used to define the largest solid cluster size .
The crystal structures of the solid particles in the cluster are discriminated using the averaged Steinhardt bond order parameters and . Lechner and Dellago (2008) These parameters allow a local distinction of the crystal structure of a particle, as well as the liquid-like particles. Since the reference histograms in the plane of the perfect crystal structures hcp, bcc, fcc, and of the liquid show little overlap, we can assign a crystal structure to each particle. For this the values are calculated for a particle and the corresponding probabilities of the various crystal structures are evaluated from the reference distributions in the -plane. The structure with the largest probability is assigned to the particle. If all probabilities are smaller than the particle is labeled as undefined.
The averaged bond order parameters provide another criterium of solidity where the particles are identified as crystalline if the liquid probability vanishes. Lechner et al. (2011a) Using these parameters we define other structural collective variables for the RC model. We use the solidity definition of ten Wolde et al. together with the averaged bond order parameters to define the largest crystalline cluster size , which includes only particles with a crystalline structure, e.g. hcp, bcc, fcc. Other variables analyzed within the MLE method are the number of fcc, hcp, bcc particles , and in the largest cluster. We further define the number of fcc, hcp, bcc atoms in the entire system , and .
To investigate the role of the formation of preordered regions in the RC, we determine the number of pre-structured liquid particles in the largest cluster and in the total system . The pre-structured liquid particles are identified using the histograms of fcc, hcp, bcc, and liquid structures on the map. A particle is assigned to be pre-structured liquid if the solidity criterion of ten Wolde et al. is fulfilled, but all crystal probabilities are smaller than , and the liquid probability vanishes. These regions therefore have less symmetry than the crystal structures but higher orientational order than the liquid, and their and values lie in between the liquid and crystal regions. Leines et al. (2017)
IV Optimal reaction coordinates
IV.1 MLE of single order parameters
| Rank | Order parameter | (%) | |
|---|---|---|---|
| 1 | |||
| 2 | |||
| 3 | 0.7955 | ||
| 4 | 0.7909 | ||
| 5 | 0.7916 | ||
| 6 | 0.7415 | ||
| 7 | 0.6082 | ||
| 8 | 0.6083 | ||
| 9 | 0.0600 | ||
| 10 | 0.0602 |
We first maximize the BIC in Eq. (7) using the MLE approach for each order parameters described in section III.2 to find the best one-dimensional description of the nucleation mechanism. We included configurations from all slices of 300 paths for each interface, a total of 699 558 points, as data points from the RPE in the MLE. The maximization of the likelihood is performed using a Monte Carlo annealing method Lechner et al. (2010) for different numbers of string images. In 1D CV spaces the string images are fixed and a MC optimization of the to mapping function is performed to maximize the likelihood. The function is initially defined by the images of the string as a piecewise monotonically increasing function. A random displacement of the progress parameter associated with the string images is performed such that the trial function remains monotonically increasing. If the BIC increases the trial function is accepted and otherwise rejected. The mapping functions were optimized for MC steps in total. For all CVs a maximum was obtained for images along the strings.
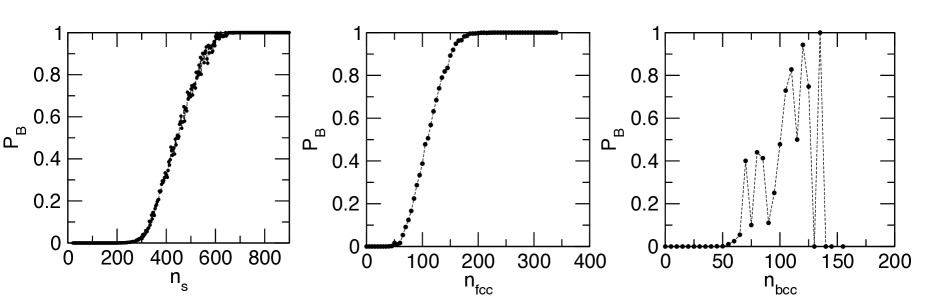
In Tab. 1 the maximum BIC values normalized by the BIC of the largest cluster size, , are listed for all tested order parameters. The size of the largest cluster, , occurs to be the best approximation to the RC. It enhances the description of the nucleation process by in comparison to the number of particles in the crystalline cluster, , that ranks second, and is better than the number of fcc particles in the cluster, . This contradicts the capillarity assumption within CNT: the bulk phase of Ni is fcc, and therefore according to CNT the order parameter would be considered as the sole RC of the process. However, the MLE analysis reveals that it is by far not the best representation of the RC. Interestingly, the number of fcc and pre-structured liquid particles in the largest cluster have similar likelihoods, while the rest of the order parameters perform poorly as approximations to the RC, especially , , , and . From the structural analysis of the RPE we know that the average composition of the growing nucleus consists of fcc particles surrounded by random hcp (stacking faults) that emerge within the core of the pre-structured liquid cloud. Leines et al. (2017) The average amount of bcc within the growing solid cluster is negligible along the transition pathways. We therefore expect that and perform rather poorly as RC candidates of the nucleation process, as corroborated by the MLE analysis, cf. Tab. 1. This is further visualized in Fig. 2, where the averaged committor (Eq. (4)) has been projected onto different CVs. As the committor is the perfect RC, the best CVs identified in the MLE analysis must approximate the committor function closely. Fig. 2 shows that and are closely correlated with a smooth averaged committor function and , while other variables of very low likelihood such as show a scattered and poor approximation to the committor function.
Although the size of the fcc crystal nucleus shows a qualitatively good correlation with the averaged committor, the MLE analysis in Tab. 1 reveals that quantitatively is not the CV of maximum likelihood and therefore is not the order parameter that fully describes the process. Our analysis further shows that including other crystalline phases in the description of the solid cluster, as represented by , improves the RC model only slightly by compared to . Therefore, the improvement of the RC model when considering comes mainly from the inclusion of the pre-structured liquid region in the description of the solid clusters.
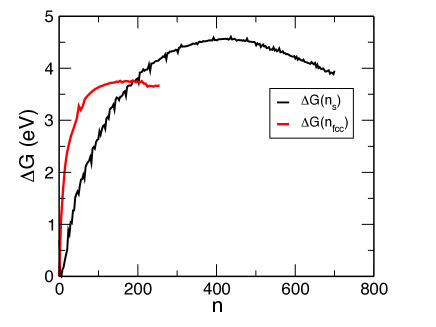
Fig. 3 shows the free energy profiles projected from the RPE onto and . The free energy projected onto , the order parameter assumed by CNT, yields a barrier eV which is lower than the barrier estimated for the projection onto . Moreover, the critical nucleus size calculated from the RPE using the averaged committor at and projected onto and indicates a difference in size of around 318 particles. This large difference in the barrier and critical nucleus size can be understood from the structural analysis of the nucleation mechanism in Ni. The pre-structured liquid cloud is a region of hidden order that initially emerges within the liquid and a subsequent nucleation of crystallites is enhanced by these mesocrystalline clouds which act as seeds or precursors of the crystallization. The difference in the free energy barrier is the result of this hidden order of the pre-structured region within the liquid, which is not considered in the free energy projection onto the fcc cluster . Solid clusters that are composed of more than 90% pre-structured liquid emerge initially within the liquid up to cluster sizes of 50 - 100 particles with a corresponding increase in the free energy by eV (which is missing in the projection ). As the crystallites grow within the core of the clusters, the free energy projection onto includes a contribution from a diffusive interface region of pre-structured liquid that surrounds the crystal core. Therefore, the higher free energy as a function of can be attributed to the initial fluctuations of high orientational order to form the mesocrystal seeds within the liquid, and to the interfacial free energy contribution of the pre-structured cloud during the crystal phase growth. The good agreement of the free energy barrier with experiments Bokeloh et al. (2011) as well as the MLE analysis show that the pre-structured liquid plays a prominent role in the description of the nucleation process.
IV.2 MLE in two-dimensional space
As a next step we investigate if the description of the reaction coordinate can be further improved in a 2D CV space. For this we define combinations of and with all other order parameters, and . To maximize the likelihood in each of the 2D spaces a string with images is optimized by two separate MC moves: one for the to mapping (as done in the one-dimensional space) and a second for the position of the string. An image of the string is randomly selected and displaced by a small distance. If the likelihood increases for the trial string we accept the move and otherwise reject it. We have also tested different numbers of images along the string and found the maximum BIC for images. The initial and the final images of the strings are kept fixed at the position of the stable states obtained from the 2D free energy projections. The logarithmic likelihoods of each 2D space were optimized for 1000 string displacements and moves of the mapping function.
| Rank | Order parameter | (%) | |
|---|---|---|---|
| 1 | 0.946 | 0.7 | |
| 2 | 0.942 | 0.9 | |
| 3 | 0.944 | 0.1 | |
| 4 | 0.940 | 0.3 | |
| 5 | 0.78 | 3.0 |
Tab. 2 shows the maximum BIC for the 2D CV spaces. According to the Bayesian information criterion, Schwarz (1978) the information gain of the likelihood with an additional variable in the model should be at least to be considered as an improvement. Therefore, additional complexity in the model improves the RC description only if the BIC increases. Here, the BICs of the string models in 2D are compared to the BIC of the best CV candidate in one dimension . If , there is a significant gain of information in the RC model. None of the pairs that include or show a relevant gain in information compared to the likelihood of the best one-dimensional RC, . The combinations including always exhibit a larger likelihood than the ones with which emphasizes the importance of as part of the RC. The MLE analysis shows that the order parameter can be considered as a nearly complete reaction coordinate. This could explain the good agreement of the nucleation barriers with experiments. Bokeloh et al. (2011)
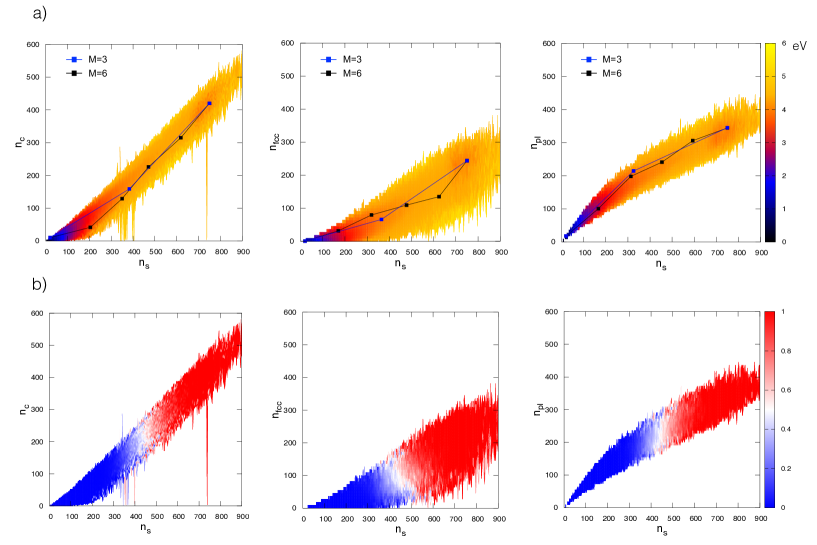
In Fig. 4 a) the averaged optimized strings are shown on the 2D free energy landscapes obtained from the RPE. We particularly focus on the combination of with , , and to obtain further insight into the role of the different order parameters during the nucleation process. The left graph in Fig. 4 a) shows the projection onto the largest cluster size and the crystal core . The optimized string in the narrow reaction channel demonstrates that are highly correlated and increase linearly for most parts along the centre of the free energy valley. This correlation explains why and are the two candidates with the highest likelihoods in the one-dimensional MLE analysis. However, for small cluster sizes (up to and eV), the number of crystalline particles is nearly zero, confirming that the clusters are initially composed of pre-structured liquid followed by a subsequent nucleation of the crystalline phase . A projection of the free energy landscape onto the single variable cannot capture the initial formation of pre-structured liquid clusters leading to a poor model of the RC in this region. This is consistent with our results that in 1D the BIC is lower than . Similarly, the committor projection in the left graph of Fig. 4 b) clearly shows that the distribution is rather broad along , whereas a projection onto captures a well-defined transition state region (narrow white region with ). This illustrates why there is no significant information gain in this 2D projection as compared to .
In the middle graph of Fig. 4 a) the optimized string in the space is shown. Comparable to the evolution of , the number of fcc particles, , hardly increases along the optimized string up to cluster sizes of associated with free energies of eV. This illustrates that also cannot capture the initial formation of the pre-structured liquid region at small cluster sizes, missing a relevant contribution to the free energy barrier as shown in Fig. 3. The committor projection shown in the middle graph of Fig. 4 b) is even broader along than along which is consistent with the MLE ranking of the CVs in 1D. One should keep in mind that the 1D committor projections shown in Fig. 2 represent and averaged committor which qualitatively appears reasonable for , but quantitatively does not represent the best RC. Interestingly, the transition state region is not entirely parallel to , which indicates that the critical nucleus size in terms of depends on the composition: the larger the amount of fcc particles in the growing nucleus the smaller the critical nucleus size.
The free energy projection and optimized string in the space is shown in the right graph of Fig. 4 a). For small clusters sizes () the energy landscape is narrow, and are highly correlated, and the optimized string is practically linear. For larger cluster sizes, however, and exhibit a nonlinear behavior where increases faster than . A fit to the data for small cluster sizes yields , confirming the linear relationship between the two CVs. This demonstrates that the first step in the nucleation mechanism is the formation of pre-structured liquid clusters. For larger clusters , we obtain which is very close to the surface-volume ratio of CNT . The committor in the right graph of Fig. 4 b) exhibits again a fairly narrow transition state region with respect to , whereas the distribution along is rather broad, illustrating that a projection onto can well describe the transition state. The single parameter lacks, however, information on the formation of the crystal core in the cluster and is not the best single descriptor of the nucleation transition, as shown in Sec. IV.1.
Our analysis indicates that the nucleation mechanism consists of an initial formation of pre-structured liquid clusters followed by the growth of crystallites embedded in a diffusive surface, mostly composed of pre-structured particles. This is in agreement with other studies of crystallization in hard spheres (comparable model systems to metals Herlach et al. (2016)) and soft core colloidal models Lechner et al. (2011a); Schilling et al. (2010); Kawasaki and Tanaka (2011); Russo and Tanaka (2012a, b); Schilling et al. (2010) where a preordered liquid region acts as precursor of the nucleation process and plays a key role in the surface description of the RC.
IV.3 Role of pre-structured liquid clusters as precursors for nucleation
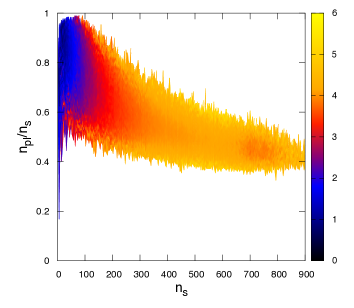
Fig. 5 shows a projection of the free energy as a function of the fraction of pre-structured liquid particles in the largest cluster and the size of largest solid cluster . The stable state at high values of evidences the initial formation of the pre-structured liquid cluster that precedes the growth of the crystal nucleus. Solid clusters of 50-60 particles are mostly composed of pre-structured liquid () and associated with free energies up to eV, which constitutes a significant part of the nucleation barrier. As crystalline particles emerge within the core of the nucleus, the fraction of pre-structured liquid particles in the cluster decreases. But even for large cluster sizes of particles the fraction of pre-structured liquid remains . This mesocrystal region thus exhibits a long lifetime and decays rather slowly even beyond the transition state region, i.e. during crystal growth.
The free energy projection shown in Fig. 5 corroborates the two-step nucleation mechanism discussed in the previous section and emphasizes the importance of the pre-structured liquid as precursor. To further analyze the structure of the preordered region we employ a polyhedron analysis for structure identification via topological fingerprints. Schablitzki et al. (2013) The distribution of coordination polyhedra in the preordered region clearly deviates from the one in the liquid. 12-fold coordinated atoms are dominant with polyhedra that resemble fcc-hcp like symmetries, closely related to polyhedra found in fcc bulk (including thermal vibrations). Here, the pre-structured liquid cloud does not only act as a seed for crystal nucleation, but also predetermines which polymorph nucleates which in turn defines the final bulk structure.
The role of in the enhancement of the reaction coordinate together with the long lifetime of preordered regions during the structural evolution of the nucleus evidences that the pre-structured liquid is not a trivial intermediate ordering step between the solid and the liquid, but rather a mesocrystal phase that acts as precursor during crystal nucleation.
V Conclusions
Using the MLE approach together with the data from the reweighted path ensemble we are able to quantitatively evaluate the quality of different CVs as reaction coordinates. For the nucleation in Ni the RC is best described by the structural order parameter , which includes information about the crystal phases in the solid cluster together with the surrounding pre-structured liquid region. This pre-structured liquid cloud significantly enhances the description of the RC for nucleation compared to other order parameters. Qualitatively, the general aspects of homogeneous nucleation in Ni are captured by CNT, i.e. there is a well-defined nucleation barrier that can be described by a single order parameter corresponding to the largest nucleus size. However, quantitively we have demonstrated that the parameter is by far not the best descriptor of the nucleation process in Ni as assumed by CNT. The initial formation of the pre-structured liquid region and the nucleus surface are poorly modeled by resulting in an underestimation of the nucleation barrier and the critical nucleus size.
Analyzing the nucleation process along the best RC reveals that the nucleation mechanism exhibits a non-classical behavior where pre-structured clusters emerge within the liquid preceding the crystal nucleation. These nucleation precursors are clusters composed of an intermediate structure between liquid and crystal that resembles defective hcp-fcc like structures. The preordered region also dominates the diffusive surface of the growing crystal clusters described by . We find that the surface-volume ratio predicted by CNT is in agreement with our results when including the pre-structured cloud in the description of the solid cluster. This can explain the good agreement of the temperature dependence of the calculated free energy barriers with CNT Leines et al. (2017); Bokeloh et al. (2011) and provides a classical re-interpretation of a non-classical mechanism.
The emergence of a hidden long-lived preordered region in the liquid and the subsequent emergence of crystallites within the cluster core demonstrates that the nucleation in Ni is a two-step process. A careful analysis of the structural composition of all solid clusters in the system shows that the crystal phases (fcc and random hcp) always grow embedded within the center of the solid clusters. Here the spatial correlation within the clusters illustrates how the pre-structured liquid region is a seed for the crystal nucleation. The role of in the enhancement of the RC together with the large and long-lived contribution to the nucleus evidences that the pre-structured liquid is not a trivial intermediate ordering step between the solid and the liquid, but rather a mesocrystal phase that acts as precursor of the crystal nucleation.
Acknowledgements
We acknowledge financial support by the Mexican National Council for Science and Technology (CONACYT) through project 232090 and by the German Research Foundation (DFG) through project RO 3073/6-1.
References
- Sosso et al. (2016) G. C. Sosso, J. Chen, S. J. Cox, M. Fitzner, P. Pedevilla, A. Zen, and A. Michaelides, Chem. Rev. 116, 7078 (2016).
- Anwar and Zahn (2011) J. Anwar and D. Zahn, Angew. Chem. Int. Ed. 50, 1996 (2011).
- Jungblut and Dellago (2016) S. Jungblut and C. Dellago, Eur. Phys. J. E 39, 77 (2016).
- Becker and Döring (1935) R. Becker and W. Döring, Ann. Phys. 416, 719 (1935).
- Binder (1987) K. Binder, Rep. Prog. Phys. 50, 783 (1987).
- Moroni et al. (2005) D. Moroni, P. R. ten Wolde, and P. G. Bolhuis, Phys. Rev. Lett. 94, 235703 (2005).
- Trudu et al. (2006) F. Trudu, D. Donadio, and M. Parrinello, Phys. Rev. Lett. 97, 105701 (2006).
- Lechner et al. (2011a) W. Lechner, C. Dellago, and P. G. Bolhuis, J. Chem. Phys. 135, 154110 (2011a).
- Peters and Trout (2006) B. Peters and B. L. Trout, J. Chem. Phys. 125, 054108 (2006).
- Russo and Tanaka (2016) J. Russo and H. Tanaka, J. Chem. Phys. 145, 211801 (2016).
- Wang et al. (2007) H. Wang, H. Gould, and W. Klein, Phys. Rev. E 76, 031604 (2007).
- Beckham and Peters (2011) G. T. Beckham and B. Peters, J. Phys. Chem. Lett. 2, 1133 (2011).
- Jungblut and Dellago (2013) S. Jungblut and C. Dellago, Phys. Rev. E 87, 1 (2013).
- ten Wolde and Frenkel (1997) P. R. ten Wolde and D. Frenkel, Science 277, 1975 (1997).
- ten Wolde and Frenkel (1999) P. R. ten Wolde and D. Frenkel, Phys. Chem. Chem. Phys. 1, 2191 (1999).
- Schilling et al. (2010) T. Schilling, H. J. Schöpe, M. Oettel, G. Opletal, and I. Snook, Phys. Rev. Lett. 105, 025701 (2010).
- Kawasaki and Tanaka (2011) T. Kawasaki and H. Tanaka, Proc. Natl. Acad. Sci. USA 108, 6335 (2011).
- Russo and Tanaka (2012a) J. Russo and H. Tanaka, Sci. Rep. 2, 505 (2012a).
- Russo and Tanaka (2012b) J. Russo and H. Tanaka, Soft Matter 8, 4206 (2012b).
- Leines et al. (2017) G. D. Leines, R. Drautz, and J. Rogal, J. Chem. Phys. 146, 154702 (2017).
- Lechner et al. (2011b) W. Lechner, C. Dellago, and P. G. Bolhuis, Phys. Rev. Lett. 106, 1 (2011b).
- Dellago et al. (2002) C. Dellago, P. Bolhuis, and P. L. Geissler, Adv. Chem. Phys. 123, 1 (2002).
- van Erp and Bolhuis (2005) T. S. van Erp and P. G. Bolhuis, J. Comp. Phys. 205, 157 (2005).
- Rogal et al. (2010) J. Rogal, W. Lechner, J. Juraszek, B. Ensing, and P. G. Bolhuis, J. Chem. Phys. 133, 174109 (2010).
- Lechner et al. (2010) W. Lechner, J. Rogal, J. Juraszek, B. Ensing, and P. G. Bolhuis, J. Chem. Phys. 133, 174110 (2010).
- Bokeloh et al. (2011) J. Bokeloh, R. E. Rozas, J. Horbach, and G. Wilde, Phys. Rev. Lett. 107, 1 (2011).
- Bolhuis and Lechner (2011) P. G. Bolhuis and W. Lechner, J. Stat. Phys. 145, 841 (2011).
- Dellago et al. (1998) C. Dellago, P. G. Bolhuis, F. S. Csajka, and D. Chandler, J. Chem. Phys. 108, 1964 (1998).
- van Erp (2007) T. S. van Erp, Phys. Rev. Lett. 98, 268301 (2007).
- Bolhuis (2008) P. G. Bolhuis, J. Chem. Phys. 129, 114108 (2008).
- Ferrenberg and Swendsen (1989) A. M. Ferrenberg and R. H. Swendsen, Phys. Rev. Lett. 63, 1195 (1989).
- Husmeier (2005) D. Husmeier, in Probabilistic Modeling in Bioinformatics and Medical Informatics, edited by D. Husmeier, R. Dybowski, and S. Roberts (Springer, London, 2005) p. 17.
- Peters et al. (2007) B. Peters, G. T. Beckham, and B. L. Trout, J. Chem. Phys. 127, 034109 (2007).
- Schwarz (1978) G. Schwarz, Ann. Stat. 6, 461 (1978).
- Foiles et al. (1986) S. M. Foiles, M. I. Baskes, and M. S. Daw, Phys. Rev. B 33, 7983 (1986).
- Plimpton (1995) S. Plimpton, J. Comp. Phys. 117, 1 (1995).
- Steinhardt et al. (1983) P. J. Steinhardt, D. R. Nelson, and M. Ronchetti, Phys. Rev. B 28, 784 (1983).
- Auer and Frenkel (2005) S. Auer and D. Frenkel, Adv. Polym. Sci. 173, 149 (2005).
- Lechner and Dellago (2008) W. Lechner and C. Dellago, J. Chem. Phys. 129, 114707 (2008).
- Herlach et al. (2016) D. M. Herlach, T. Palberg, I. Klassen, S. Klein, and R. Kobold, J. Chem. Phys. 145, 211703 (2016).
- Schablitzki et al. (2013) T. Schablitzki, J. Rogal, and R. Drautz, Modelling Simul. Mater. Sci. Eng. 21, 075008 (2013).