QCD critical end point from a realistic PNJL model
Abstract
With parameters fixed by critical temperature and equation of state at zero baryon chemical potential, a realistic Polyakov–Nambu–Jona-Lasinio (rPNJL) model predicts a critical end point of chiral phase transition at . The extracted freeze-out line from heavy ion collisions is close to the chiral phase transition boundary in the rPNJL model, and the kurtosis of baryon number fluctuations from the rPNJL model along the experimental freeze-out line agrees well with the BES-I measurement. Our analysis shows that the dip structure of measured is determined by the relationship between the freeze-out line and chiral phase transition line at low baryon density region, and the peak structure can be regarded as a clean signature for the existence of CEP.
1 Introduction
Exploring Quantum Chromodynamics (QCD) phase structure and understanding properties of QCD matter under extreme conditions are main topics of heavy ion collisions. It is generally believed that there is a QCD critical end point (CEP) for chiral phase transition at finite baryon density, and searching for the CEP and locating the CEP become one of the central goals of beam energy scan (BES) program at Relativistic Heavy Ion Collisions (RHIC), the Facility for Antiproton and Ion Research (FAIR) in Darmstadt and Nuclotron-based Ion Collider Facility (NICA) in Dubna.
The higher order fluctuations of conserved charges carries the divergency feature of the correlation length at the CEP thus are regarded as good observables of CEP fluctuations-CEP . The measurement on the higher cumulants of conserved charges from BES-I at RHIC for Au+Au collisions shows a non-monotonic energy dependent behavior for the kurtosis of the net proton number distributions in the collision energy from to , corresponding to the baryon chemical potential from to GeV Adamczyk:2013dal ; Aggarwal:2010wy ; Luo:2017faz . It is observed that of net proton number distributions starts from about 1 at , decreases to around 0.1 at and rises quickly up to 3.5 at . It calls for theoretical understanding whether this non-monotonic structure is related to the existence of the QCD CEP.
The QCD CEP has been investigated from lattice theory lattice , and the recent lattice result excluded the existence of CEP in the low baryon density region lattice-Frankfurt . The QCD CEP has also been widely analyzed through symmetry analysis Symmetry-CEP , and by using effective chiral models, e.g., the Nambu–Jona-Lasinio (NJL) models including the Polyakov-loop improved NJL (PNJL) model NJL-CEP , quark-meson (QM) models including the Polyakov-loop improved QM model QM-CEP , the Dyson-Schwinger equations (DSE) DSE-CEP , as well as the 5-dimension holographic QCD model Critelli:2017oub ; Li:2017ple . The model studies lose the power on predicting the exact location of the CEP, because different models even the same model with different parameter sets give various location of CEP. However, still we can extract some useful information from model studies, e.g., the peak structure of along the freeze-out line can be used as a clean signature for the existence of CEP, and the peak location of the measured is close to the real QCD CEP mountain Li:2017ple ; Li:2018ygx .
In this talk, we show the results from a realistic Polyakov–Nambu–Jona-Lasinio (rPNJL) model Li:2018ygx . It is interesting to observe that the kurtosis produced from the rPNJL model along the experimental freeze-out line agrees with BES-I data well!
2 Model setup
The 3-flavor rPNJL model takes into account 8-quark interaction Bhattacharyya:2016jsn , and its effective potential is given below:
| (1) | |||||
Where takes for two light flavors while for strange quark, is quark-antiquark condensate for different flavors, and with the dynamically generated constituent quark mass taking the form of
| (2) |
Here if , then and . takes the form of Ghosh:2007wy
| (3) |
which describes the self-interaction of the Polyakov-loop and , is a dimensionless parameter,
| (4) |
with , and
| (5) |
| 5.5 | 183.468 | 637.720 | 2.914 | 75.968 |
| (MeV) | ||||||
|---|---|---|---|---|---|---|
| 175 | 6.75 | -9.8 | 0.26 | 0.805 | 7.555 | 0.1 |
The parameters of the NJL part shown in Table 1 are fixed by vacuum properties, and the parameters of Polyakov loop part listed in Table 2 are fixed by global fitting of the pressure density at zero chemical potential. With these parameters, the critical temperature and equation state at zero chemical potential in the rPNJL model agree well with lattice data Bhattacharyya:2016jsn .
3 Numerical results
From the pressure , the minus thermodynamical potential, one can obtain the net-baryon number fluctuations Luo:2017faz
| (6) |
which gives the cumulants of baryon number distributions . By introducing the variance and kurtosis , we can write the ratio of fourth and second order cumulants of net-baryon number fluctuations as
| (7) |
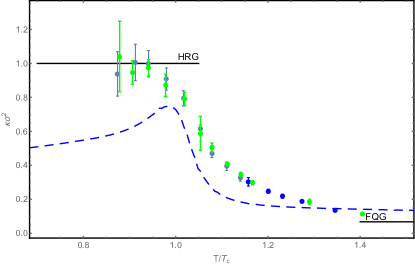
The value of of baryon number fluctuation is 1 in the hadron resonance gas (HRG) phase and it takes the value of in the ideal free quark gas (FQG) limit at very high temperature Bazavov:2017dus .
With the parameters fixed in Table 1 and 2, we can obtain of baryon number fluctuation in the rPNJL model as shown in Fig.1 and compare with lattice data in Ref.Bazavov:2017dus . The HRG limit and FQG limit are also shown in Fig.1. It is noticed that above the chiral phase transition , the result of agrees well with lattice result, and below , of baryon number fluctuation is only about half of the HRG limit. However, in the regular NJL model, the magnitude of of baryon number fluctuation is much smaller than the the lattice result Li:2018ygx . This indicates that gluodynamics contribution plays dominant role in the baryon number fluctuations.
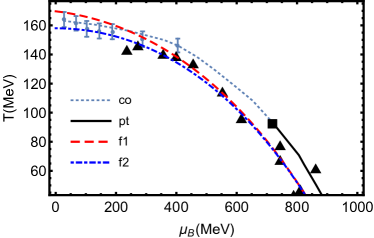
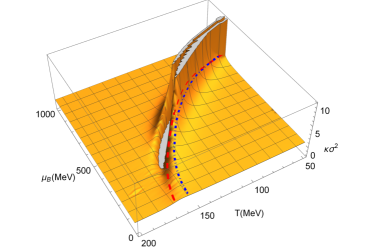
The chiral phase boundary in the rPNJL model is shown in Fig. 2, with the CEP located at . We also show the freeze-out temperatures and baryon number chemical potentials extracted from experiment in Fig. 2, where the freeze-out temperatures and baryon number chemical potentials extracted from BES-I at RHIC Das:2014qca are shown in dots, and the freeze-out temperatures and baryon number chemical potentials extracted from lower energy heavy-ion collisions Begun:2016pdy are shown in triangles. We use two fitted freeze-out lines
| (8) |
which are shown in dashed and dashed-dotted lines, respectively. The second freeze-out line is taken from Ref.Luo:2017faz . Both fitted experimental freeze-out lines are very close to the chiral phase boundary from the rPNJL model. The only difference is that at low baryon density region, the fitted experimental freeze-out line starts from above the chiral phase boundary, and starts from below the phase boundary. The 3D plot of the kurtosis as functions of the temperature and chemical potential calculated from the rPNJL model is shown in the right of Fig. 2, from which it can be clearly seen that the first freeze-out line starts from the back ridge of the phase boundary and starts from the front ridge of the phase boundary.
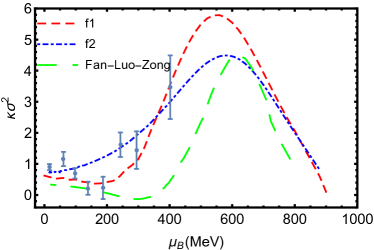
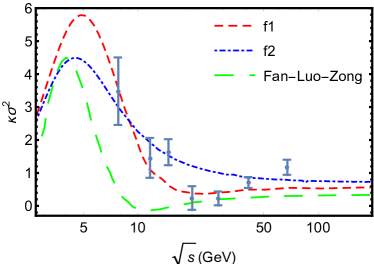
We show the kurtosis of baryon number fluctuations calculated from the rPNJL model along the two fitted freeze-out lines from heavy ion collisions in Fig. 3 and compare with BES-I measurement of (shown in dots with error bars) Adamczyk:2013dal ; Aggarwal:2010wy ; Luo:2017faz . The left figure is as a function of the baryon number chemical potential and the right figure is as a function of the collision energy, where the relation between the chemical potential and the collision energy Begun:2016pdy has been used. As a reference, the calculated from a realistic regular NJL model along the freeze-out line Fan:2016ovc is also shown as long dashed line. Because there is no gluon contribution in the regular NJL model, the value of kurtosis in general is much smaller than that in the rPNJL model.
It is observed that the kurtosis produced from the realistic PNJL model along the freeze-out line develops a dip structure around () and a peak structure at around (, while along the freeze-out line , only develops a peak structure at around ( and no dip structure is developed. As we have discussed that the only difference between the two freeze-out lines is at the low baryon density region: crosses the chiral phase boundary from above, i.e. starts from the back ridge of the phase boundary, from the 3D plot in Fig. 2, it is natural to see how the dip structure is formed. For the case along the freeze-out line , which always lies below the phase boundary, there is no chance to form the dip structure. The peak structure along the freeze-out line is solely determined by the existence of the CEP. From this analysis, we can see that the dip structure of measured is determined by the relationship between the freeze-out line and chiral phase transition line at low baryon density region, and the peak structure can be regarded as a clean signature for the existence of CEP.
Another unexpected result is that the kurtosis from the equilibrium result in the rPNJL model along the experimental freeze-out line agrees with BES-I measurement very well. This is a surprising result, because in general, one should take into account the non-equilibrium evolution of the system in heavy ion collisions. However, as shown in Ref.Memory-Yin that the kurtosis of baryon number fluctuation even changes sign and becomes negative. It is worthy of mentioning that the measurement of is always positive, therefore it deserves further understanding on how the "little bang" after collision evolves with time. As shown in BraunMunzinger:2003zd , one possible scenario is that the system after collision reaches thermalization very quickly in quite high temperature and then evolves in equilibrium state. From our analysis, to form the dip structure, the freeze-out temperature at low baryon density region should be higher than the phase transition temperature! If this scenario is correct, the equilibrium result from a realistic PNJL model might work.
4 Summary
In summary, we have investigated the kurtosis of the baryon number fluctuations in a reparameterized realistic PNJL model, in which the critical temperature, equation of state and baryon number fluctuations are in good agreement with lattice data at zero chemical potential. This rPNJL model predicts a CEP located at . The extracted experimental freeze-out line from heavy ion collisions is very close to the chiral phase transition boundary in the rPNJL model. It is surprised to see that the kurtosis of baryon number fluctuations from the rPNJL model along the experimental freeze-out line agrees well with the BES-I measurement. We also analyzed the formation of the dip structure and peak structure of measured along the freeze-out line. Our analysis shows that the dip structure of is determined by the relationship between the freeze-out line and chiral phase transition line at low baryon density region, and the peak structure is solely determined by the divergency at CEP, and the peak structure can be regarded as a clean signature for the existence of CEP. It is worthy of mentioning that at low baryon density region, the extracted freeze-out temperatures from BES-I measurement at RHIC Das:2014qca are indeed higher than the critical temperatures, this supports our analysis on the formation of dip structure of along the freeze-out line.
Our result shows that the equilibrium result can explain the BES-I data on baryon number fluctuations, this may indicate that the system after collision reaches thermalization quickly and evolve in equilibrium before the freeze-out and phase transition, which is in agreement with the analysis in BraunMunzinger:2003zd . For example, in the collision energy of , the system reaches thermalization at around the temperature of , which is much higher than the freeze-out temperature and the phase transition temperature around .
Acknowledgments
This work was supported in part by the NSFC under Grant Nos. 11725523, 11735007, and 11261130311 (CRC 110 by DFG and NSFC).
References
- (1) M. A. Stephanov, “Non-Gaussian fluctuations near the QCD critical point,” Phys. Rev. Lett. 102 (2009) 032301, arXiv:0809.3450 [hep-ph]; M. A. Stephanov, “On the sign of kurtosis near the QCD critical point,” Phys. Rev. Lett. 107 (2011) 052301, arXiv:1104.1627 [hep-ph]; M. Asakawa, S. Ejiri, and M. Kitazawa, “Third moments of conserved charges as probes of QCD phase structure,” Phys. Rev. Lett. 103 (2009) 262301, arXiv:0904.2089 [nucl-th]; C. Athanasiou, K. Rajagopal, and M. Stephanov, “Using Higher Moments of Fluctuations and their Ratios in the Search for the QCD Critical Point,” Phys. Rev. D82 (2010) 074008, arXiv:1006.4636 [hep-ph].
- (2) STAR Collaboration, L. Adamczyk et al., “Energy Dependence of Moments of Net-proton Multiplicity Distributions at RHIC,” Phys. Rev. Lett. 112 (2014) 032302, arXiv:1309.5681 [nucl-ex].
- (3) STAR Collaboration, M. M. Aggarwal et al., “Higher Moments of Net-proton Multiplicity Distributions at RHIC,” Phys. Rev. Lett. 105 (2010) 022302, arXiv:1004.4959 [nucl-ex].
- (4) X. Luo and N. Xu, “Search for the QCD Critical Point with Fluctuations of Conserved Quantities in Relativistic Heavy-Ion Collisions at RHIC : An Overview,” Nucl. Sci. Tech. 28 no. 8, (2017) 112, arXiv:1701.02105 [nucl-ex].
- (5) Z. Fodor and S. D. Katz, “A New method to study lattice QCD at finite temperature and chemical potential,” Phys. Lett. B534 (2002) 87–92, arXiv:hep-lat/0104001 [hep-lat]; H.-T. Ding, F. Karsch, and S. Mukherjee, “Thermodynamics of strong-interaction matter from Lattice QCD,” Int. J. Mod. Phys. E24 no. 10, (2015) 1530007, arXiv:1504.05274 [hep-lat]; C. Schmidt and S. Sharma, “The phase structure of QCD,” J. Phys. G44 no. 10, (2017) 104002, arXiv:1701.04707 [hep-lat].
- (6) V. Vovchenko, J. Steinheimer, O. Philipsen, and H. Stoecker, “Cluster Expansion Model for QCD Baryon Number Fluctuations: No Phase Transition at ,” arXiv:1711.01261 [hep-ph].
- (7) R. D. Pisarski and F. Wilczek, “Remarks on the Chiral Phase Transition in Chromodynamics,” Phys. Rev. D29 (1984) 338–341; Y. Hatta and T. Ikeda, “Universality, the QCD critical / tricritical point and the quark number susceptibility,” Phys. Rev. D67 (2003) 014028, arXiv:hep-ph/0210284 [hep-ph];
- (8) T. M. Schwarz, S. P. Klevansky, and G. Papp, “The Phase diagram and bulk thermodynamical quantities in the NJL model at finite temperature and density,” Phys. Rev. C60 (1999) 055205, arXiv:nucl-th/9903048 [nucl-th]; P. Zhuang, M. Huang, and Z. Yang, “Density effect on hadronization of a quark plasma,” Phys. Rev. C62 (2000) 054901, arXiv:nucl-th/0008043 [nucl-th]; J.-W. Chen, J. Deng, and L. Labun, “Baryon susceptibilities, non-Gaussian moments, and the QCD critical point,” Phys. Rev. D92 no. 5, (2015) 054019, arXiv:1410.5454 [hep-ph]; J.-W. Chen, J. Deng, H. Kohyama, and L. Labun, “Robust characteristics of nongaussian fluctuations from the NJL model,” Phys. Rev. D93 no. 3, (2016) 034037, arXiv:1509.04968 [hep-ph]; W.-j. Fu and Y.-l. Wu, “Fluctuations and Correlations of Conserved Charges near the QCD Critical Point,” Phys. Rev. D82 (2010) 074013, arXiv:1008.3684 [hep-ph]; K. Fukushima, “Phase diagrams in the three-flavor Nambu-Jona-Lasinio model with the Polyakov loop,” Phys. Rev. D77 (2008) 114028, arXiv:0803.3318 [hep-ph]. [Erratum: Phys. Rev.D78,039902(2008)]; N. Weiss, “The Effective Potential for the Order Parameter of Gauge Theories at Finite Temperature,” Phys. Rev. D24 (1981) 475; C. Ratti, S. Roessner, M. A. Thaler, and W. Weise, “Thermodynamics of the PNJL model,” Eur. Phys. J. C49 (2007) 213–217, arXiv:hep-ph/0609218 [hep-ph]; G.-y. Shao, Z.-d. Tang, X.-y. Gao, and W.-b. He, “Baryon number fluctuations and QCD phase structure,” arXiv:1708.04888 [hep-ph]; X.-y. Xin, S.-x. Qin, and Y.-x. Liu, “Improvement on the Polyakov–Nambu–Jona-Lasinio model and the QCD phase transitions,” Phys. Rev. D89 no. 9, (2014) 094012; G.-y. Shao, Z.-d. Tang, M. Di Toro, M. Colonna, X.-y. Gao, and N. Gao, “Phase transition of strongly interacting matter with a chemical potential dependent Polyakov loop potential,” Phys. Rev. D94 no. 1, (2016) 014008, arXiv:1603.09033 [nucl-th]; M. Dutra, O. Louren?o, A. Delfino, T. Frederico, and M. Malheiro, “Polyakov–Nambu–Jona-Lasinio phase diagrams and quarkyonic phase from order parameters,” Phys. Rev. D88 no. 11, (2013) 114013, arXiv:1312.1130 [hep-ph].
- (9) E. S. Bowman and J. I. Kapusta, “Critical Points in the Linear Sigma Model with Quarks,” Phys. Rev. C79 (2009) 015202, arXiv:0810.0042 [nucl-th]; H. Mao, J. Jin, and M. Huang, “Phase diagram and thermodynamics of the Polyakov linear sigma model with three quark flavors,” J. Phys. G37 (2010) 035001, arXiv:0906.1324 [hep-ph]; B. J. Schaefer and M. Wagner, “QCD critical region and higher moments for three flavor models,” Phys. Rev. D85 (2012) 034027, arXiv:1111.6871 [hep-ph]; B.-J. Schaefer and M. Wagner, “Higher-order ratios of baryon number cumulants,” Central Eur. J. Phys. 10 (2012) 1326–1329, arXiv:1203.1883 [hep-ph]; B.-J. Schaefer, J. M. Pawlowski, and J. Wambach, “The Phase Structure of the Polyakov–Quark-Meson Model,” Phys. Rev. D76 (2007) 074023, arXiv:0704.3234 [hep-ph].
- (10) S.-x. Qin, L. Chang, H. Chen, Y.-x. Liu, and C. D. Roberts, “Phase diagram and critical endpoint for strongly-interacting quarks,” Phys. Rev. Lett. 106 (2011) 172301, arXiv:1011.2876 [nucl-th]; J. Luecker, C. S. Fischer, L. Fister, and J. M. Pawlowski, “Critical Point and Deconfinement from Dyson-Schwinger Equations,” PoS CPOD2013 (2013) 057, arXiv:1308.4509 [hep-ph]; W.-j. Fu, J. M. Pawlowski, F. Rennecke, and B.-J. Schaefer, “Baryon number fluctuations at finite temperature and density,” Phys. Rev. D94 no. 11, (2016) 116020, arXiv:1608.04302 [hep-ph].
- (11) R. Critelli, J. Noronha, J. Noronha-Hostler, I. Portillo, C. Ratti, and R. Rougemont, “Critical point in the phase diagram of primordial quark-gluon matter from black hole physics,” Phys. Rev. D96 no. 9, (2017) 096026, arXiv:1706.00455 [nucl-th];
- (12) Z. Li, Y. Chen, D. Li, and M. Huang, “Locating the QCD critical end point through the peaked baryon number susceptibilities along the freeze-out line,” Chin. Phys. C42 no. 1, (2018) 013103, arXiv:1706.02238 [hep-ph].
- (13) Z. Li, K. Xu, X. Wang and M. Huang, arXiv:1801.09215 [hep-ph].
- (14) A. Bhattacharyya, S. K. Ghosh, S. Maity, S. Raha, R. Ray, K. Saha and S. Upadhaya, Phys. Rev. D 95, no. 5, 054005 (2017) doi:10.1103/PhysRevD.95.054005 [arXiv:1609.07882 [hep-ph]].
- (15) S. K. Ghosh, T. K. Mukherjee, M. G. Mustafa and R. Ray, Phys. Rev. D 77, 094024 (2008) doi:10.1103/PhysRevD.77.094024 [arXiv:0710.2790 [hep-ph]].
- (16) A. Bazavov et al., “The QCD Equation of State to from Lattice QCD,” Phys. Rev. D95 no. 5, (2017) 054504, arXiv:1701.04325 [hep-lat].
- (17) S. Das [STAR Collaboration], EPJ Web Conf. 90, 08007 (2015) doi:10.1051/epjconf/20159008007 [arXiv:1412.0499 [nucl-ex]].
- (18) V. V. Begun, V. Vovchenko and M. I. Gorenstein, J. Phys. Conf. Ser. 779, no. 1, 012080 (2017) doi:10.1088/1742-6596/779/1/012080 [arXiv:1609.04827 [nucl-th]].
- (19) W. Fan, X. Luo, and H.-S. Zong, “Mapping the QCD phase diagram with susceptibilities of conserved charges within Nambu–Jona-Lasinio model,” Int. J. Mod. Phys. A32 no. 11, (2017) 1750061, arXiv:1608.07903 [hep-ph];
- (20) S. Mukherjee, R. Venugopalan and Y. Yin, Phys. Rev. C 92, no. 3, 034912 (2015); S. Mukherjee, R. Venugopalan and Y. Yin, Phys. Rev. Lett. 117, no. 22, 222301 (2016);
- (21) P. Braun-Munzinger, K. Redlich and J. Stachel, In *Hwa, R.C. (ed.) et al.: Quark gluon plasma* 491-599, [nucl-th/0304013].