Spin gap in a quasi-1D antiferromagnet K2CuSO4Cl2
Abstract
Electron spin resonance experiments in the quasi-1D antiferromagnet K2CuSO4Cl2 reveal opening of a gap in absence of magnetic ordering, as well as an anisotropic shift of the resonance magnetic field. These features of magnetic excitation spectrum are explained by a crossover between a gapped spinon-type doublet ESR formed in a 1D antiferromagnet with uniform Dzyaloshinskii-Moriya interaction and a Larmor-type resonance of a quasi-1D Heisenberg system.
I Introduction
Heisenberg antiferromagnetic spin chain has a critical ground state, disordered because of quantum fluctuations. In a 3D crystal, containing spin chains coupled due to a weak interchain exchange, magnetic ordering occurs at a Néel temperature far below the Curie-Weiss temperature . Strong spin-spin correlations appear below , therefore, in a temperature range , the spin structure and excitations of a quasi-1D antiferromagnet are close to that of a quantum spin-liquid of noninteracting spin chains at . The characteristic feature of this quantum spin liquid is a gapless continuum of =1 transitions. These transitions correspond to creation of pairs of fractional excitations carrying spin (called ”spinons”), see, e.g. Refs.Faddeev ; Tennant1 ; Tennant2 The continuum was intensively studied by neutron scattering at wavevectors of the order of the reciprocal lattice period, where the width of the continuum is of the order of maximum energy. At small wavevectors near the center of the Brillouin zone the width of the continuum is negligible and the spectrum is mainly analogous to that of conventional spin waves. However, in presence of the uniform Dzyaloshinskii-Moriya (DM) interaction of magnetic ions within a chain, there arises a remarkable transformation of the two-spinon continuum at , causing a spin gap and a shift of a magnetic resonance. Gangadharaiah ; Povarov ; Karimi This transformation may be detected in electron spin resonance (ESR) experiments.
DM interaction between two magnetic ions with the spins and has a contribution to the Hamiltonian . In most of antiferromagnetic crystals with DM interaction, the characteristic vectors form a staggered structure, which causes a canting of sublattices in a conventional antiferromagnet. Dzyaloshinsky ; Moriya For the uniform DM interaction vectors are parallel. This results in a spiral spin structure with a wavevector ( is the lattice constant) for a classical antiferromagnet.
In a quantum 1D antiferromagnet there is no ordering in a ground state, however, the uniform DM interaction modifies the spectrum of a continuum by a shift in -space for the same vector . Gangadharaiah ; Povarov ; Karimi As a result, a spin gap of the order of arises in zero field and a modification of the ESR frequency occurs: in a magnetic field parallel to the ESR spectrum transforms from a single line at a Larmor frequency to a doublet. The split of the doublet equals the width of the initial continuum at . These features in the ESR spectrum were observed for the quasi 1D S=1/2 antiferromagnets with uniform DM interaction within chains: Cs2CuCl4 Povarov ; Smirnov1 ; Smirnov1a and K2CuSO4Br2.Halg ; Smirnov2 The two examples present almost the complete list of the known compounds with the uniform DM interaction. The third spin-chain compound with the uniform DM-interaction is K2CuSO4Cl2. Halg This compound has much weaker intrachain exchange integral (3.2 K), than Br-compound (20.4 K), at the same time the interchain exchange integral calculated for both compounds from the value of the Néel temperature is nearly the same, i.e. about 0.03 K. is about 100 mK for the bromide and 77 mK for the chlorine compound, according Ref.Halg The direct measurement of the interchain exchange by the inelastic neutron scattering in the saturated phase results in a value of 0.45 K for K2CuSO4Cl2, Blosser which is about 15 times greater, than the estimated from Néel temperature. Anyway, both these values indicate, that the Cl-compound is less one-dimensional compared to K2CuSO4Br2, which has 600. The value of the energy of DM interaction should be diminished in the Cl-compound with respect to Br-compound, proportional to , as follows from theory. Moriya Thus, the hierarchy of interactions in K2CuSO4Cl2 is expected to be as instead of in case of K2CuSO4Br2. This provides a possibility to look here in K2CuSO4Cl2 for the spinon effects in presence of interchain exchange competing with uniform DM interaction and compare the observations with the almost ideal 1D case of K2CuSO4Br2. The differences between and situations are predicted to lead to very different phase diagrams for corresponding materials in the ordered, low-temperature limit. JinStarykh Therefore the determination of the relation between and is of importance for the spin structure and phase transitions of low-temperature ordered phases.
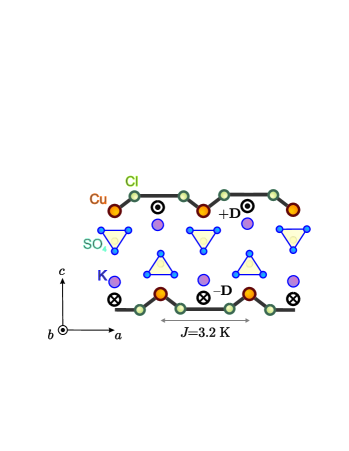
The crystal structure for both K2CuSO4Br2 and K2CuSO4Cl2 is orthorombic with space group . The magnetic Cu2+ ions are linked by the superexchange via two halogen atoms in chains running along the axis. The symmetry analysis of Ref.Halg shows that DM vectors are directed parallel to axis and pointed in the same direction within a chain but antiparallel in adjacent chains, as shown in Fig. 1.
Hamiltonian of an isolated spin chain with uniform DM interaction may be written as follows:
| (1) |
From here, in a low-frequency approximation (), the =0 ESR frequencies were derived for the arbitrary direction of the magnetic field : Gangadharaiah ; Karimi ; Povarov
| (2) |
For this results in a doublet of ESR lines instead of a single line at 0. Besides, a gap of is predicted for zero field.
The goal of the present work is to probe the ESR spectrum when the interchain exchange competes with DM interaction in a formation of the low energy dynamics of a quasi-1D antiferromagnet. We observe a strong anisotropy of the low-temperature deviation of the magnetic resonance frequency in agreement with (2) and the formation of a predicted zero-field energy gap. These observations indicate a peculiar transformation of the continuum in a 1D chain with uniform DM interaction. However, we do not observe the upper component of the spinon doublet. This reveals a crossover between a gapped spinon-type doublet ESR formed in a 1D antiferromagnet with uniform DM interaction and a Larmor-type resonance of a Heisenberg system. Experiment shows, that the doublet is not finally formed, but the resonance is already shifted from the Larmor frequency. To check the qualitative correspondence of the ESR spectra to spinon-type ESR with a gap , we alternatively estimate the value of from the high-temperature ESR linewidth, using a theory of Ref. Fayzullin As a result, we get a qualitative agreement, natural for the essential deviations from ideal 1D model with .
II Experimental details
The magnetic resonance signals were recorded at a fixed frequency as field dependencies of the microwave power transmitted through the resonator. For weak absorption in the sample, the change of the transmitted power is proportional to the imaginary part of the magnetic susceptibility .
For a strong absorption, e.g. for the narrow ESR in the paramagnetic region, the linear correspondence between the change of the transmission and may be lost. In case when microwave losses in the sample are comparable or exceed that in the walls of the resonator, the signal just drops almost to zero. At further growth of the absolute changes of the transmission are small. To reconstruct the effective signal, which diminishes proportional to , a normalization of the transmitted microwave signal was made. We use the relation between the loaded cavity -factor and the losses in the sample: , here is the loaded -factor of the resonator without the sample, i.e. in a magnetic field far from resonance, is a geometric factor, and is the sample volume. The analysis of the transmission (following, e.g. Ref.Pool ) gives for the effective signal :
| (3) |
The ESR absorption lines were recorded using a set of microwave spectrometers equipped with superconducting 12 T solenoid and 3He pump refrigerator providing temperature down to 0.45 K. The sample was mounted inside the copper resonator which was placed in vacuum and connected via a heat link to the 3He chamber. Angular dependencies of ESR line were taken in a spectrometer equipped with 8 T solenoid and 4He pump refrigerator with the lowest temperature of 1.3 K.
Experiments were performed in the frequency range 0.5 - 60 GHz using Gunn diodes and klystrons as microwave sources. The microwave units with cylindrical, rectangular, cut-ring, and spiral resonators were used for recording the resonance absorption of microwaves. A RuO2 thermometer monitored the temperature of the resonator. The temperature of the sample was controlled by use of a heater placed on the microwave unit. 2,2-diphenyl-1-picrylhydrazyl (DPPH) was used as a standard g = 2.00 marker for the magnetic field.
We used single crystals of K2CuSO4Cl2 with the mass 5-40 mg from the same batch as in Ref. Halg
III Experimental results
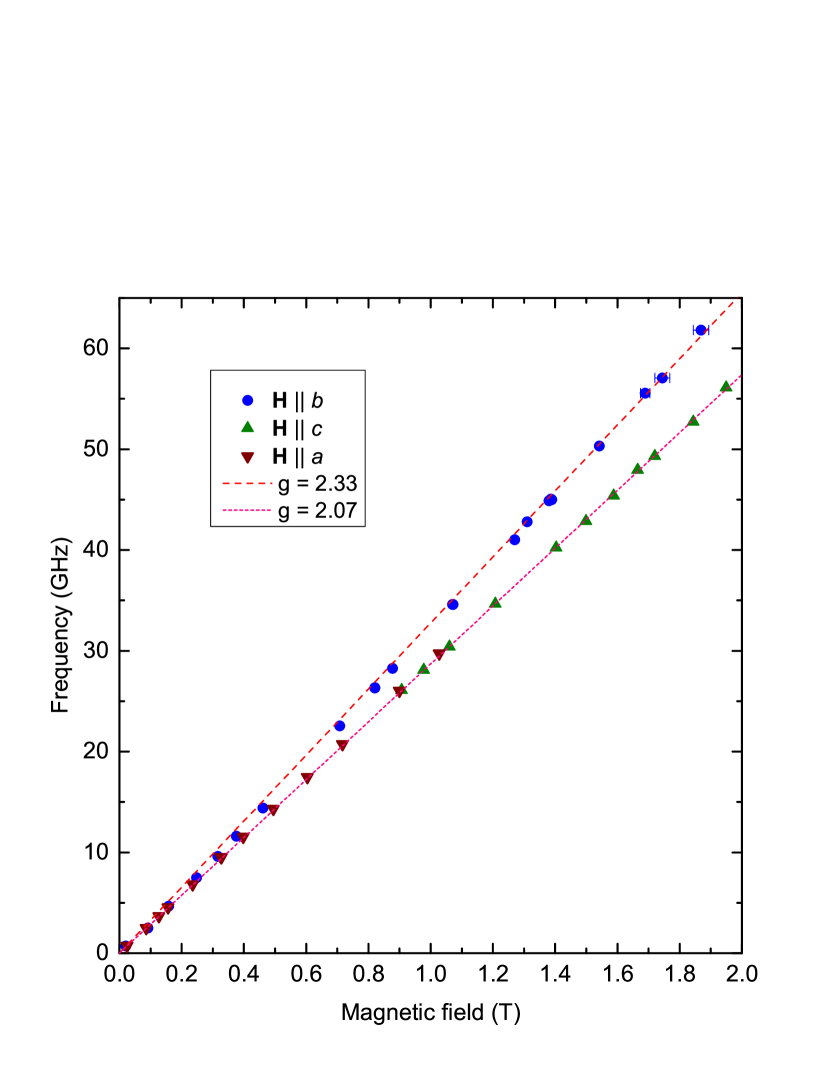
At temperatures above 3 K we observe a single Lorentzian ESR absorption line. At these temperatures, in the whole frequency range, the resonance field corresponds to a temperature independent -tensor with principal axes coinciding with crystallographic axes. The principal values of -tensor are , .
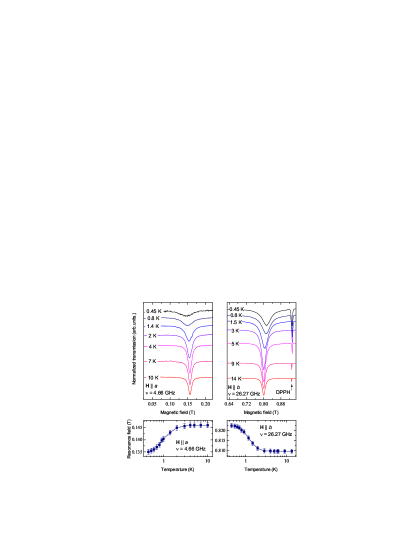
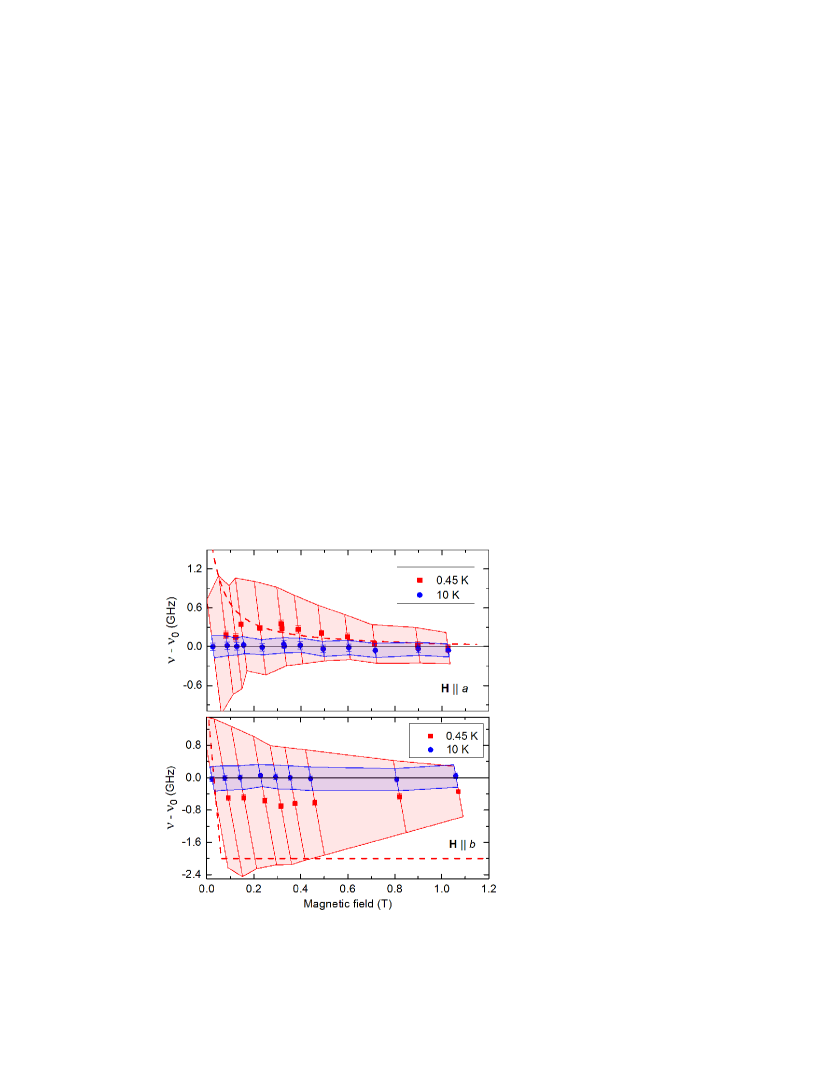
The temperature evolution of the 4.66 GHz ESR line at is shown in the left upper panel of Fig. 2. Here magnetic field is oriented perpendicular to the DM vector . Upon cooling to 0.45 K the ESR line is broadening and shifting to lower fields. The corresponding dependence of the resonance field on temperature is presented in the left lower panel of Fig. 2. On the contrary, at (this is parallel to ), the ESR line exhibits a shift to higher fields, see temperature evolution of ESR line and the dependence of 26.27 GHz ESR field on temperature in the right panels of Fig. 2. The shift of the ESR field at is of the same value and sign as for .
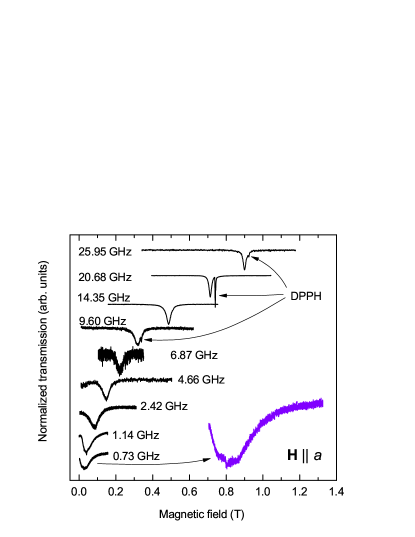
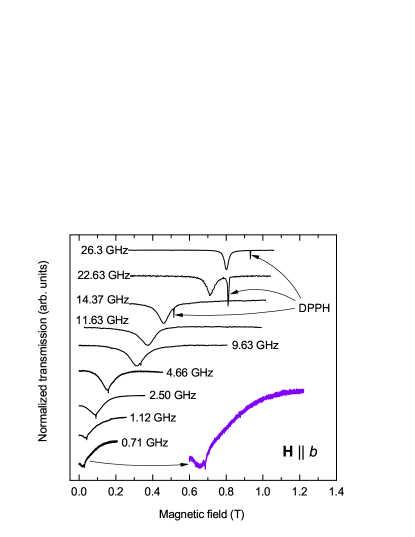
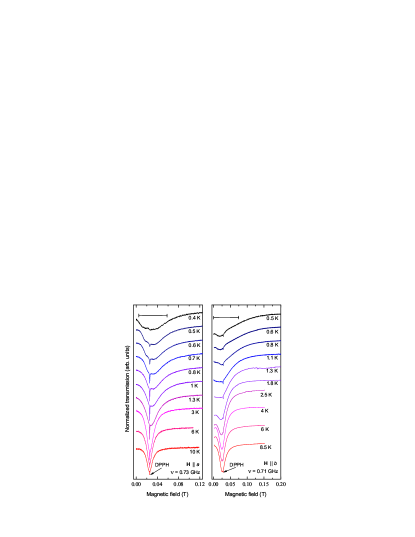
Examples of ESR records taken at different frequencies for and at T = 0.45 K are presented in Figs. 3 and 4 correspondingly. The resonance fields measured at different frequencies are plotted on the frequency-field diagram Fig. 5 for three principal directions of the magnetic field. The frequency-field dependencies mainly follow the linear dependence observed for the high-temperature regime at 10 K. The shift of the resonance field observed at cooling below 3 K is small in comparison with the applied field, therefore the shift of the ESR frequency from the Larmor-type frequency is shown separately in Fig. 6. For the frequency shift is positive indicating opening of the gap. This deviation monotonically increases with decreasing the field to about 0.15 T, while below this value the lineform becomes non-Lorentzian. The resonance line transforms to a band of absorption at (lower record on Fig.3) or to a nonsymmetric line with a wide right wing at (lower record on Fig.4). The maximum of absorption moves back to Larmor frequency in fields below 0.15 T.
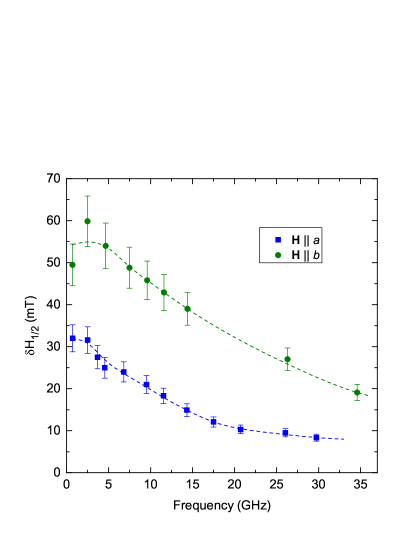
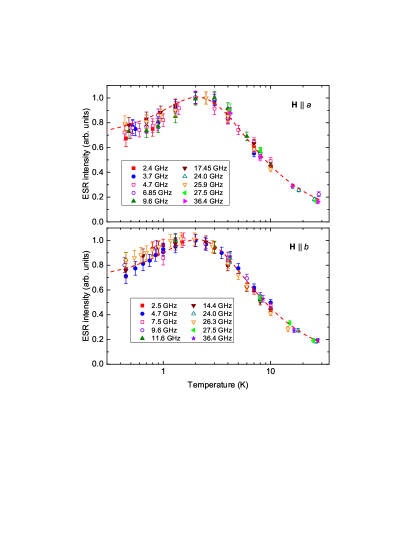
The transformation of the low-frequency ( 2.4 GHz) line into a broad band of absorbtion with an asymmetric shape is presented by the transmission records in Fig. 7 both for for and . The corresponding widening of the absorption range is illustrated in Fig.6. Here the deviation of the resonance frequency from the Larmor frequency is shown by symbols and the range of the magnetic field corresponding to the absorption exceeding a half of the maximum value, converted to the frequency range using the observed dependence is presented by segments. Resonance fields for 2.4 GHz are obtained by the fits of the ESR absorption curves by a sum of two Lorentzian curves with symmetric resonance fields . For non-Lorentzian absorption curves, occuring at 2 GHz the symbols present the field of the maximum absorption and segments - the field interval where the absorption is higher then half of the maximum value. Finally, the area of absorption exceeding a half of the maximum value at 0.45 K is presented by the pink shaded area on Fig 6. At the temperature K we observe narrow Lorentzian resonances with a field-independent linewidth (half width at half height, ) of about 4 mT for and 8 mT for . The area of 10 K absorption exceeding a half of the maximum value is presented as shaded in blue. We see, that at low temperature of 0.45 K there is essential frequency-dependent broadening of the ESR line, as presented quantitatively in Fig. 6 and Fig. 8.
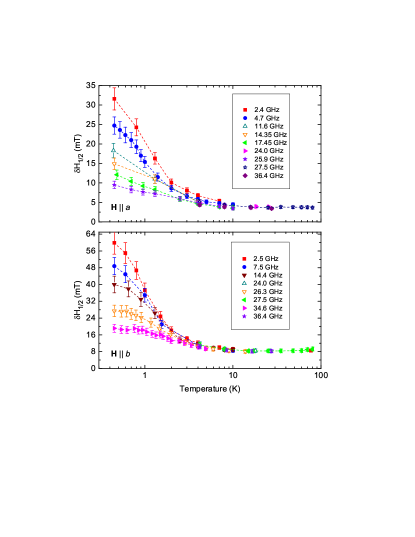
In the magnetic fields above 0.15 T (i.e. for frequencies 2.4 GHz) ESR lines have a regular Lorentzian form. For these lines the integral intensity may be derived reliably. At the temperature above 3 K, both at and , the integral intensity follows the Curie-Weiss law with Curie-Weiss temperature K. Integral intensity reaches its maximum value at a temperature 2 K and falls a bit at cooling below 2 K, in agreement with the static magnetic susceptibility of Heisenberg chain, Hatfield see Fig. 9. The linewidth , increases monotonically on cooling below 80 K rising from 3.5 0.3 mT at and from 8.5 0.5 mT at . The dependencies of on temperature taken at different frequencies are shown in Fig. 10. As mentioned above, the low-temperature broadening of the ESR line depends strongly on frequency (see Figs. 3, 4, 8) with a stronger broadening at low frequencies.
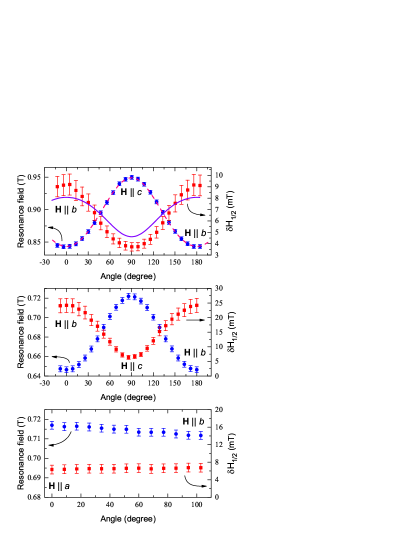
To estimate the value of DM interaction from the anisotropy of the high-temperature ESR linewidth, we have measured the angular dependencies of of 27.5 GHz ESR line rotating the magnetic field in plane at temperature 80 K (at which has a minimum). The records of ESR lines at different orientations of the magnetic field are given in Fig. 11 and the angular dependencies of the resonance field and linewidth are given in the upper panel of Fig.12. Analogous data for the low temperature =1.3 K are presented in the middle and lower panels. High-temperature data demonstrate a significant anisotropy of the linewidth of about 250 percents, while the anisotropy of the resonance field is about 10 percents and may be described by the anisotropy of -factor. The low-temperature angular dependencies for the rotation in the plane, i.e. from to position, demonstrate a remarkable deviation of the linewidth, shown in the middle panel of Fig. 12, while for the rotation of the field in the plane, when the magnetic field remains perpendicular to DM vector , the deviation is within the experimental error, see Fig. 12, lower panel.

IV Discussion
IV.1 Spinon magnetic resonance
According to our observations, in the high temperature range 3 K, the ESR frequency follows a typical paramagnetic resonance dependence on the magnitude and orientation of the external field, see, e.g. Ref. Abragam , (equation 1.49):
| (4) |
here is the angle between the external magnetic field and -axis. The corresponding angular dependence of a resonance field in plane is presented in the upper panel of Fig. 12 by a dashed line, there is a good agreement with the experimental resonance fields.
According to the basic principles of magnetic resonance, for narrow ESR lines the integral intensity is a measure of the static susceptibility (see, e.g. Ref.Abragam , equation (2.64)). Thus, the ESR intensity should have the same temperature dependence as the static susceptibility. In Fig. 9 we see a good correspondence of the temperature dependence of ESR integral intensity to Bonner-Fisher calculation Hatfield of static magnetic susceptibility of Heisenberg chain with K for the frequencies, when . This observation of a typical susceptibility of 1D antiferromagnet imply, that upon cooling below 3 K a spin-correlated state like that in decoupled spin chains is formed. This correlated state is also consistent with the observation of the excitation spectrum in form of a two-spinon continuum in a neutron scattering experiment. Povarovetalprivate The comparison of the ESR intensity and Bonner-Fisher susceptibility provides a check whether the observed signals are intrinsic for K2CuSO4Cl2 or arise partially from defects or impurities. The good coincidence with the theoretical susceptibility curve in Fig. 9 confirms that the experimental ESR intensity is dominantly intrinsic and not originating from paramagnetic impurities. Considering the deviation from the Bonner-Fisher susceptibility is within the experimental error we estimate the concentration of paramagnetic defects as not exceeding .
For an isolated Heisenberg chain in an external magnetic field the ESR mode should appear exactly at a Larmor-type frequency as for other spin systems with Heisenberg exchange.Al tshuler ; Oshikawa However, in our ESR experiments we find the shift of ESR mode from Larmor frequency at decreasing the temperature, as shown in Figs. 2 and 6. We believe this shift is due to the influence of uniform DM interaction on excitation spectrum in K2CuSO4Cl2, in accordance with theory of Refs.Gangadharaiah ; Povarov ; Karimi This conclusion is confirmed by the observations of the characteristic anisotropy of the shift of the resonance field, which corresponds to ESR of a spin S=1/2 AFM chain with uniform DM interaction. Indeed, this anisotropy is consistent with Eq. (2), which predicts a negative shift of the ESR field at and a doublet of lines at . The low-frequency component of doublet should have the positive shift of the field, thus, the ESR line with a positive shift of the field, observed at , may be interpreted as a lower component of the doublet.
Consider the ESR frequencies at different orientations of the magnetic field in details. Orientations of magnetic field and correspond to and respectively as the symmetry of the structure of K2CuSO4Cl2 implies . For orientations of the field and Eq. (2) correspondingly takes the form:
| (5) | |||||
| (6) |
According to these expressions, for the magnetic field applied in plane single gapped mode with zero-field gap should be observed, whereas at the ESR doublet should be formed.
ESR spectra obtained in frequency range 2.4 GHz at 0.45 K demonstrate qualitative agreement with theoretical prediction. First, for , we observe the ESR mode shifted to lower fields following the scenario of opening of the gap in zero field. Second, at we see the formation of single ESR line shifted to higher fields consisting with the low-frequency component of the ESR doublet. The upper frequency component of the doublet is not visible. This might be explained by the observations of the doublet at in crystals of K2CuSO4Br2 Smirnov2 and Cs2CuCl4 Smirnov1 , where the high-frequency component of the doublet exhibited much lower intensity and disappeared quickly at heating or at the increase of magnetic field well before the lower component transformed to a Larmor mode. It was empirically shown Smirnov1 ; Smirnov2 that the upper limit of the magnetic field at which the upper component of the spinon doublet may be observed is approximately equal to . The empirical temperature at which doublet components are finally formed and the maximum of resonance field shift for doublet components is achieved should be lower than .
Fitting the experimental dependence () in the range 2.4 GHz for (see Fig. 6) with the relation (6) we get the value of the gap GHz and DM interaction K. Using Eq. 5 we plot the calculated dependence for low-frequency component of doublet expected at in the lower panel of Fig. 6. We observe here the correspondence in the sign of the shift, but the value of the shift reaches only of about one third of the expected value. Thus, the shift of ESR is lower than expected, and the higher component of the doublet, if it exist, is too weak in intensity to be detected.
Using the above value of K and the value of =3.2 K, we get 0.4 T and 0.44 K. Thus, the temperature of our experiment 0.45 K is about and the ESR shift and gap opening should be almost as large as at =0. This may be concluded from the comparison with the data on K2CuSO4Br2 presented in Fig.7 of Ref.Smirnov2 . For this previous investigation the temperature was passed during the cooling. In that case, at , the gap was observed to be only for 10 percents smaller than the limit low-temperature value. Another indication of that the resonance field at 0.45 K is close to limit value is the observation, that the field ceased changing at cooling to 0.45 K, as presented in Fig. 2
ESR lines taken at the frequencies below 10 GHz have the resonance fields below =0.4 T. Thus, the condition of our experiments meet the empirical criterium of the doublet observation in a quasi-1D antiferromagnet with . Therefore, the absence of a good correspondence of the observed ESR shift to the theory of 1D spin chains with uniform DM interaction and the absence of the upper component of the doublet should be related to a high value of , which is of the order of . The formation of the fine structure of the ESR spectrum due to the uniform DM interaction is predicted for an isolated chain, while the interchain exchange comparable with should naturally disturb the formation of the fine structure within the spinon continuum. For K2CuSO4Br2 the condition was fulfilled: K and K, Halg ; Smirnov2 whereas for the chlorine compound it doesn’t take place, while K and K. Thus, the energy gap and the spinon doublet are ”underdeveloped” because of the action of interchain exchange.
Based on the above concept of the ESR frequencies and linewidth evolution with temperature and magnetic field, we can treat the anomalous increase of the linewidth and final transformation of the the Lorentzian resonance line into an absorption band at frequencies below 2 GHz as a transition to sub-gap range. Because the value of the interchain exchange is as large as DM energy , (but still much lower than intrachain exchange ) the spinon fine structure is smeared and at a frequency below the gap the spinon-type ESR may be overlapped with a Larmor-type mode of the pure Heisenberg system. This overlapping probably results in a band of absorption covering the ranges of the Larmor mode and of the spinon ESR.
IV.2 High-temperature ESR linewidth
We consider the ESR linewidth has a contribution of the spin lattice relaxation processes and of spin-spin interactions. Mainly, isotropic exchange interaction is known to give no contribution to the width of the ESR line. The contribution of the symmetric anisotropic exchange interaction to the ESR linewidth decreases with cooling, whereas an impact of uniform DM interaction increases, resulting in the linewidth rising with cooling as in the range . Fayzullin The lattice contribution is usually rising at high temperature. According to our measurements of the ESR linewidth for K2CuSO4Cl2, shown in Fig. 10, the linewidth increases with cooling below 80 K indicating that spin-spin contribution due to uniform DM interaction is dominant. Thus, measured at 80 K near its minimum (see lower panel of Fig. 12) should be mostly due to spin-spin relaxation via uniform DM interaction. Naturally, at this temperature the high-temperature approximation is valid. We use the results of the ESR linewidth calculation by the method of moments applied for 1D Heisenberg chain with uniform DM interaction. In the high temperature limit (), the angular dependence of due to spin-spin interaction described by the model Hamiltonian (1) with DM vector is as follows: Fayzullin
| (7) |
here , , is the same angle as defined in section IV.1. Naturally, the spin chains of both orientations of vector produce ESR signals with the same linewidth.
Fitting the angular dependence of the linewidth shown in Fig. 12 by Eq. (7) resulted in a solid line in the upper panel of Fig. 12 This gives the value of K. Fit shows that the DM interaction describes the angular variation of the linewidth quite well. The value of is about three times greater, than the value derived from the spinon resonance spectrum. It may be due to the action of the interchain exchange, which makes the shift of the ESR smaller than in abscence of the interchain interaction, causing the underestimation of from spinon ESR.
V Conclusion
The observed behavior of ESR in K2CuSO4Cl2 is in a qualitative correspondence with the scenario of spinon ESR formation under the influence of uniform DM interaction, competing with interchain exchange. The value of DM interaction was estimated both from the zero-field gap and from the angular dependence of the ESR linewidth in a high-temperature limit, and is within the interval 0.06 K 0.16 K. The spin gap mode and the electron spin resonance doublet which should arise under the action of the uniform Dzyaloshinskii-Moriya interaction are essentially smeared by the interchain exchange which is of the same order of magnitude as the energy of DM interaction. Therefore, we observe a crossover between the gapped fine structure of the ESR in 1D antiferromagnetic chain with uniform Dzyaloshinskii-Moriya interaction and a Larmor-frequency mode of a quasi-1D Heisenberg antiferromagnet.
VI Acknowledgements
We thank Prof. Oleg Starykh for numerous discussions. We are indebted to Russian Science Foundation, grant 17-02-01505, supporting ESR investigations, ETHZ team acknowledges support by Swiss National Science Foundation, Division II
References
- (1) L. D. Faddeev and L. A. Takhtajan, What is the spin of a spin wave?, Phys. Lett. A 85, 375 (1981).
- (2) D. A. Tennant, R. A. Cowley, S. E. Nagler, and A. M. Tsvelik, Measurement of the spin-excitation continuum in one-dimensional KCuF3 using neutron scattering, Phys. Rev. B 52, 13368 (1995).
- (3) B. Lake, D. A. Tennant, J.-S. Caux, T. Barthel, U. Schollwöck, S. E. Nagler, and C. D. Frost, Multispinon Continua at Zero and Finite Temperature in a Near-Ideal Heisenberg Chain, Phys. Rev. Lett. 111, 137205 (2013).
- (4) S. Gangadharaiah, J. Sun, and O.A. Starykh, Spin-orbital effects in magnetized quantum wires and spin chains, Phys. Rev. B 78, 054436 (2008).
- (5) K. Yu. Povarov, A. I. Smirnov, O. A. Starykh, S. V. Petrov, and A. Ya. Shapiro, Modes of Magnetic Resonance in the Spin-Liquid Phase of Cs2CuCl4, Phys. Rev. Lett. 107, 037204 (2011).
- (6) H. Karimi and I. Affleck, Transverse spectral functions and Dzyaloshinskii-Moriya interactions in spin chains, Phys. Rev. B 84, 174420 (2011).
- (7) I. Dzyaloshinskii, A thermodynamic theory of weak ferromagnetism of antiferromagnetics, J. Phys. Chem. Solids 4, 241 (1958).
- (8) T. Moriya, Anisotropic superexchange interaction and weak ferromagnetism, Phys. Rev. 120, 91 (1960).
- (9) A. I. Smirnov, T. A. Soldatov, K. Yu. Povarov, and A. Ya. Shapiro, High-field magnetic resonance of spinons and magnons in the triangular lattice S = 1/2 antiferromagnet Cs2CuCl4, Phys. Rev. B 91, 174412 (2015).
- (10) A. I. Smirnov, K. Yu. Povarov, S. V. Petrov, and A. Ya. Shapiro, Magnetic resonance in the ordered phases of the two-dimensional frustrated quantum magnet Cs2CuCl4, Phys. Rev. B 85, 184423 (2012).
- (11) M. Hälg, W. E. A. Lorenz, K. Yu. Povarov, M. Månsson, Y. Skourski, and A. Zheludev, Quantum spin chains with frustration due to Dzyaloshinskii-Moriya interactions, Phys. Rev. B 90, 174413 (2014).
- (12) A. I. Smirnov, T. A. Soldatov, K. Yu. Povarov, M. Hälg, W. E. A. Lorenz, and A. Zheludev, Electron spin resonance in a model S = 1/2 chain antiferromagnet with a uniform Dzyaloshinskii-Moriya interaction, Phys. Rev. B 92, 134417 (2015).
- (13) D. Blosser, N. Kestin, K. Yu. Povarov, R. Bewley, E. Coira, T. Giamarchi, and A. Zheludev, Finite-temperature correlations in a quantum spin chain near saturation, Phys. Rev. B 96, 134406 (2017).
- (14) W. Jin and O. A. Starykh, Phase diagram of weakly coupled Heisenberg spin chains subject to a uniform Dzyaloshinskii-Moriya interaction. Phys. Rev. B 95, 214404 (2017).
- (15) M. A. Fayzullin, R. M. Eremina, M. V. Eremin, A. Dittl, N. van Well, F. Ritter, W. Assmus, J. Deisenhofer, H. A. Krug von Nidda, and A. Loidl, Spin correlations and Dzyaloshinskii-Moriya interaction in Cs2CuCl4, Phys. Rev. B 88, 174421 (2013).
- (16) Ch. P. Poole, jr. Electron Spin Resonance, A Comprehensive Treatise on Experimental Techniques, John Wiley and Sons, 1967
- (17) J.C. Bonner and M. E. Fisher. Linear magnetic chains with anisotropic coupling. Phys.Rev. 135, A640 (1964), we used approximation formula of E. Hatfield, New magnetic and structural results for uniformly spaced, alternatingly spaced, and ladderlike copper (II) linear chain compounds, J. Appl. Phys. 52, 1985 (1981).
- (18) A. Abragam, B. Bleaney, Electron paramagnetic resonance of transition ions, Clarendon Press, Oxford (1970), relations (1.49) and (2.64).
- (19) K. Yu. Povarov, D. Blosser, A. Zheludev, Private communication (2018)
- (20) M. Oshikawa and I. Affleck, Electron spin resonance in S = 1/2 antiferromagnetic chains, Phys. Rev. B 65, 134410 (2002).
- (21) S. Al tshuler, B. Kozyrev, Electron Paramagnetic Resonance, Academic Press (1964).