tiny\floatsetup[table]font=tiny
Very high energy particle acceleration powered by the jets of the microquasar SS 433
Abstract
SS 433 is a binary system containing a supergiant star that is overflowing its Roche lobe with matter accreting onto a compact object (either a black hole or neutron star) [1, 2, 3]. Two jets of ionized matter with a bulk velocity of extend from the binary, perpendicular to the line of sight, and terminate inside W50, a supernova remnant that is being distorted by the jets [4, 5, 6, 7, 8, 2]. SS 433 differs from other microquasars in that the accretion is believed to be super-Eddington [9, 10, 11], and the luminosity of the system is erg s-1 [12, 2, 9, 13]. The lobes of W50 in which the jets terminate, about pc from the central source, are expected to accelerate charged particles, and indeed radio and X-ray emission consistent with electron synchrotron emission in a magnetic field have been observed [14, 15, 16]. At higher energies ( GeV), the particle fluxes of rays from X-ray hotspots around SS 433 have been reported as flux upper limits [6, 17, 18, 19, 20]. In this energy regime, it has been unclear whether the emission is dominated by electrons that are interacting with photons from the cosmic microwave background through inverse-Compton scattering or by protons interacting with the ambient gas. Here we report TeV -ray observations of the SS 433/W50 system where the lobes are spatially resolved. The TeV emission is localized to structures in the lobes, far from the center of the system where the jets are formed. We have measured photon energies of at least 25 TeV, and these are certainly not Doppler boosted, because of the viewing geometry. We conclude that the emission from radio to TeV energies is consistent with a single population of electrons with energies extending to at least hundreds of TeV in a magnetic field of micro-Gauss.
A.U. Abeysekara1, A. Albert2, R. Alfaro3, C. Alvarez4, J.D. Álvarez5, R. Arceo4, J.C. Arteaga-Velázquez5, D. Avila Rojas3, H.A. Ayala Solares6, E. Belmont-Moreno3, S.Y. BenZvi7, C. Brisbois8, K.S. Caballero-Mora4, T. Capistrán9, A. Carramiñana9, S. Casanova10,11, M. Castillo5, U. Cotti5, J. Cotzomi12, S. Coutiño de León9, C. De León12, E. De la Fuente13, J.C. Díaz-Vélez13,14, S. Dichiara15, B.L. Dingus2, M.A. DuVernois14, R.W. Ellsworth16, K. Engel17, C. Espinoza3, K. Fang18,19, H. Fleischhack8, N. Fraija15, A. Galván-Gámez15, J.A. García-González3, F. Garfias15, A. González Muñoz3, M.M. González15, J.A. Goodman17, Z. Hampel-Arias14,20, J.P. Harding2, S. Hernandez3, J. Hinton11, B. Hona8, F. Hueyotl-Zahuantitla4, C.M. Hui21, P. Hüntemeyer8, A. Iriarte15, A. Jardin-Blicq11, V. Joshi11, S. Kaufmann4, P. Kar1, G.J. Kunde2, R.J. Lauer22, W.H. Lee15, H. León Vargas3, H. Li2, J.T. Linnemann23, A.L. Longinotti9, G. Luis-Raya24, R. López-Coto25, K. Malone6, S.S. Marinelli23, O. Martinez12, I. Martinez-Castellanos17, J. Martínez-Castro26, J.A. Matthews22, P. Miranda-Romagnoli27, E. Moreno12, M. Mostafá6, A. Nayerhoda10, L. Nellen28, M. Newbold1, M.U. Nisa7, R. Noriega-Papaqui27, E.G. Pérez-Pérez24, J. Pretz6, Z. Ren22, C.D. Rho7, C. Rivière17, D. Rosa-González9, M. Rosenberg6, E. Ruiz-Velasco11, F. Salesa Greus10, A. Sandoval3, M. Schneider29, H. Schoorlemmer11, M. Seglar Arroyo6, G. Sinnis2, A.J. Smith17, R.W. Springer1, P. Surajbali11, I. Taboada30, O. Tibolla4, K. Tollefson23, I. Torres9, G. Vianello31, L. Villaseñor12, T. Weisgarber14, F. Werner11, S. Westerhoff14, J. Wood14, T. Yapici7, G. Yodh32, A. Zepeda4,33, H. Zhang34, H. Zhou2
Department of Physics and Astronomy, University of Utah, Salt Lake City, UT, USA
Physics and Theoretical Divisions, Los Alamos National Laboratory, Los Alamos, NM, USA
Instituto de Física, Universidad Nacional Autónoma de México, Mexico City, Mexico
Universidad Autónoma de Chiapas, Tuxtla Gutiérrez, Chiapas, México
Universidad Michoacana de San Nicolás de Hidalgo, Morelia, Mexico
Department of Physics, Pennsylvania State University, University Park, PA, USA
Department of Physics and Astronomy, University of Rochester, Rochester, NY, USA
Department of Physics, Michigan Technological University, Houghton, MI, USA
Instituto Nacional de Astrofísica, Óptica y Electrónica, Puebla, Mexico
Institute of Nuclear Physics Polish Academy of Sciences, IFJ-PAN, Krakow, Poland
Max-Planck Institute for Nuclear Physics, Heidelberg, Germany
Facultad de Ciencias Físico Matemáticas, Benemérita Universidad Autónoma de Puebla, Puebla, Mexico
Departamento de Física, Centro Universitario de Ciencias Exactas e Ingenierías, Universidad de Guadalajara, Guadalajara, Mexico
Department of Physics and Wisconsin IceCube Particle Astrophysics Center, University of Wisconsin-Madison, Madison, WI, USA
Instituto de Astronomía, Universidad Nacional Autónoma de México, Mexico City, Mexico
School of Physics, Astronomy, and Computational Sciences, George Mason University, Fairfax, VA, USA
Department of Physics, University of Maryland, College Park, MD, USA
Department of Astronomy, University of Maryland, College Park, MD, USA
Joint Space-Science Institute, University of Maryland, College Park, MD, USA
Inter-university Institute for High Energies, Université Libre de Bruxelles, Brussels, Belgium
NASA Marshall Space Flight Center, Astrophysics Office, Huntsville, AL, USA
Department of Physics and Astronomy, University of New Mexico, Albuquerque, NM, USA
Department of Physics and Astronomy, Michigan State University, East Lansing, MI, USA
Universidad Politecnica de Pachuca, Pachuca, Mexico
INFN and Universita di Padova, Padova, Italy
Centro de Investigación en Computación, Instituto Politécnico Nacional, Mexico City, Mexico
Universidad Autónoma del Estado de Hidalgo, Pachuca, Mexico
Instituto de Ciencias Nucleares, Universidad Nacional Autónoma de Mexico, Mexico City, Mexico
Santa Cruz Institute for Particle Physics, University of California, Santa Cruz, Santa Cruz, CA, USA
School of Physics and Center for Relativistic Astrophysics, Georgia Institute of Technology, Atlanta, GA, USA
Department of Physics, Stanford University, Stanford, CA, USA
Department of Physics and Astronomy, University of California, Irvine, Irvine, CA, USA
Physics Department, Centro de Investigacion y de Estudios Avanzados del IPN, Mexico City, Mexico
Department of Physics and Astronomy, Purdue University, West Lafayette, IN, USA
In the SS 433/W50 complex, several regions located west of the central binary (w1 and w2) and east (e1, e2, e3) are observed to emit hard X-rays [6]. Previous searches for very high-energy (VHE) -ray emission from the hotspots between roughly GeV and TeV have produced null results [17, 18, 19, 20], though an excess observed at MeV may be associated with SS 433 and W50 [21]. The High Altitude Water Cherenkov (HAWC) observatory is a wide field-of-view VHE -ray observatory surveying the Northern sky above 1 TeV, and is optimized for photon detection above 10 TeV [22]. SS 433 transits from the zenith of the HAWC detector each day, and has been observed with uptime since the start of detector operations in 2015.
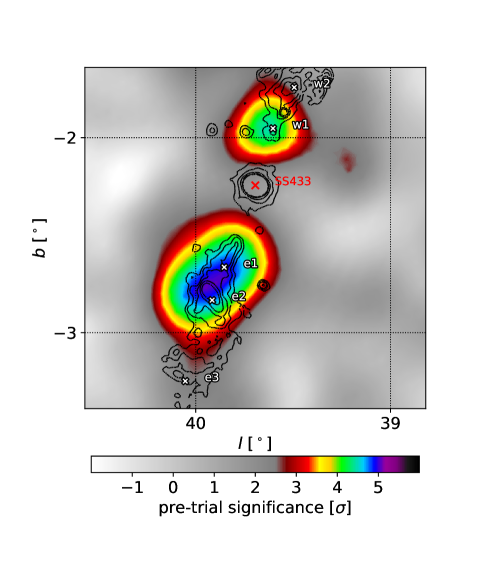
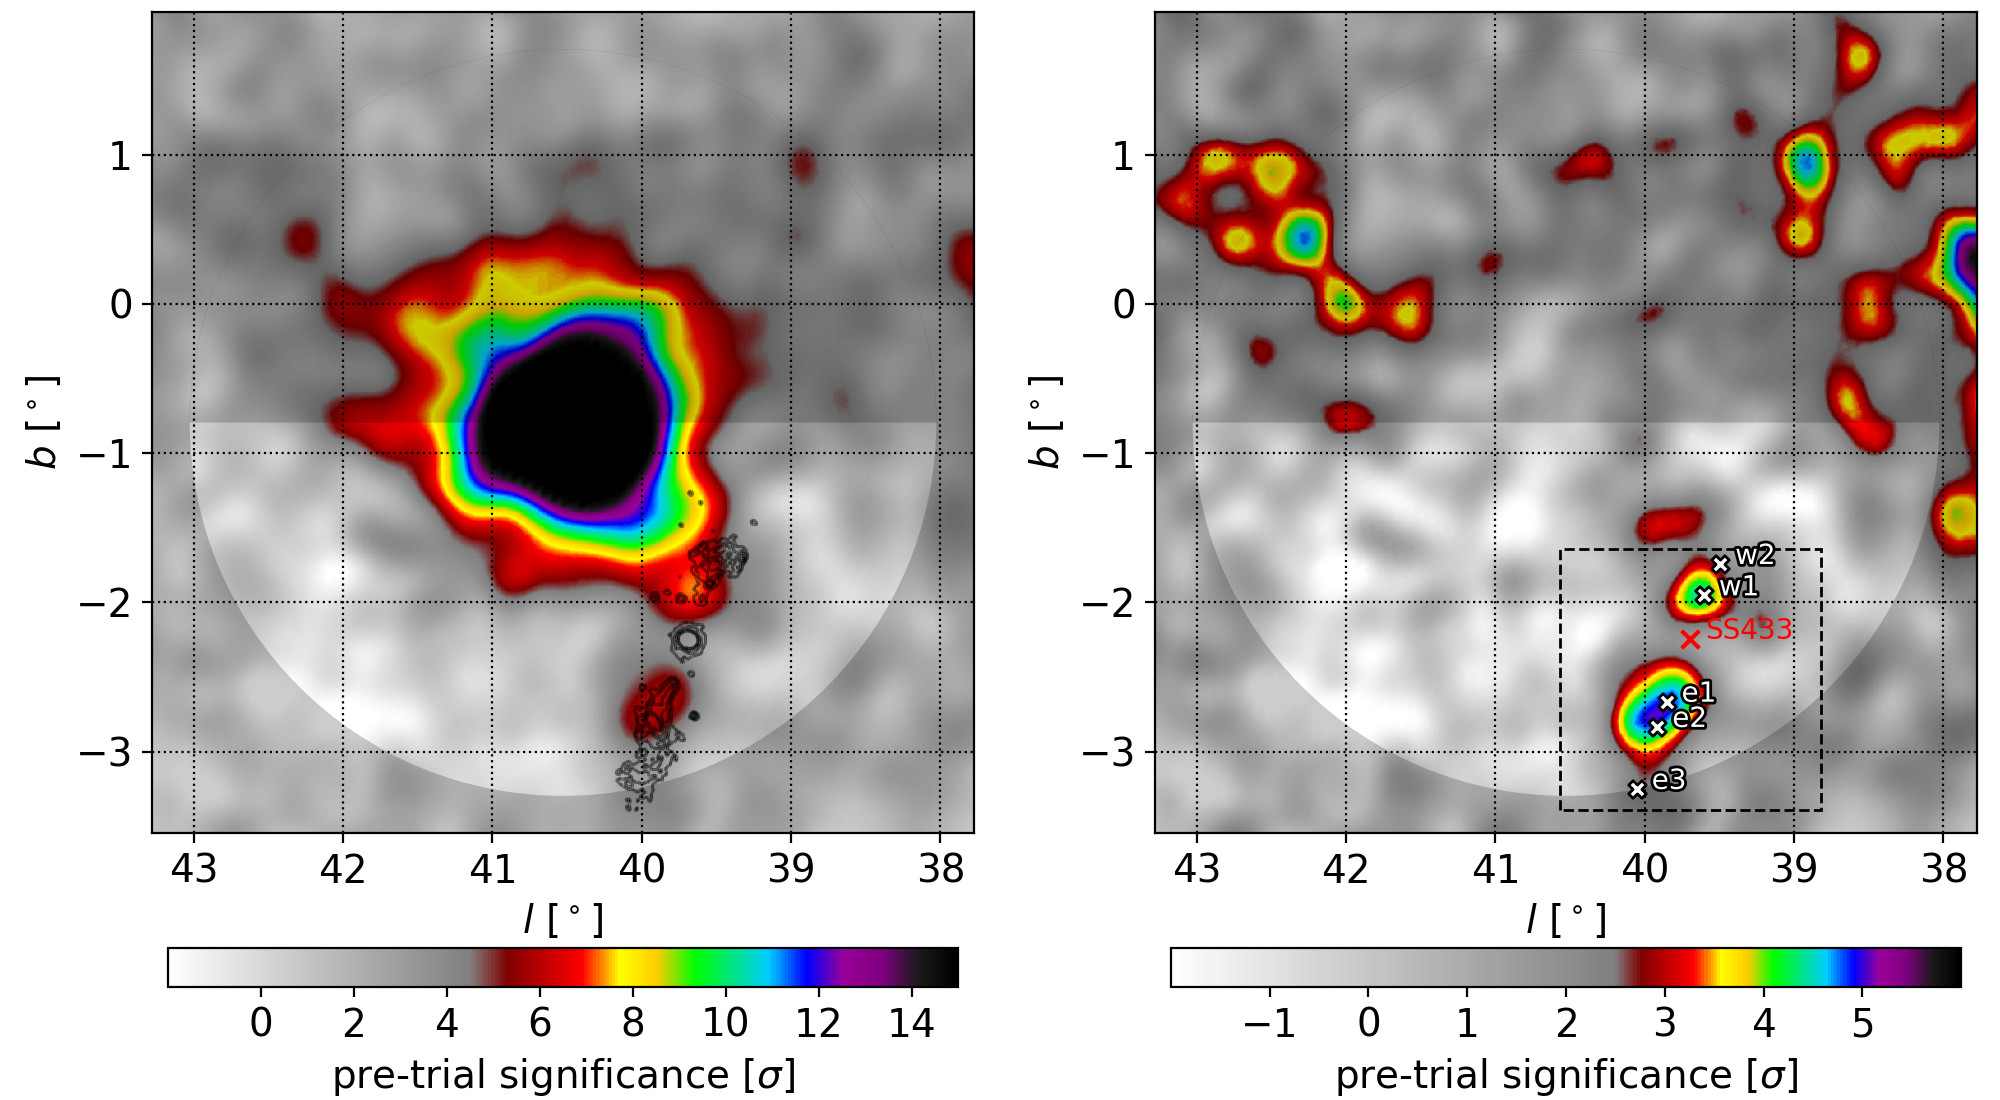
In 1017 days of measurements with HAWC, an excess of rays with a post-trials significance of has been observed in a joint fit of the eastern and western interaction regions of the jets of SS 433. The emission is plotted in galactic coordinates in Fig. 1, which includes an overlay of the X-ray observations of the jets and the central binary. The -ray emission is spatially coincident with the X-ray hotspots w1 and e1; no significant emission is observed at the location of the central binary where the jets are produced.
Spatial and spectral fits to SS 433 are performed in a semicircular region of interest (RoI) designed to mask out diffuse emission from the Galactic Plane. The RoI also removes significant spatially extended emission from the nearby -ray source MGRO J1908+06. The spatial distribution and spectrum of rays from MGRO J1908+06 are fit using an electron diffusion model [23], and point-like sources centered on e1 and w1 are fit on top of this extended emission. As a systematic check, the regions are also fit using X-ray spatial templates and extended Gaussian functions. Neither improves the statistical significance of the fits. Upper limits on the angular size of the emission regions are for the east hotspot and for the west hotspot at 90% confidence. Given the distance to the source of kpc, this corresponds to a physical size of pc and pc, respectively. The constraint is tighter on the eastern hotspot due to its higher statistical significance.
The VHE -ray flux is consistent with a hard spectrum, though current data from HAWC are not of sufficient significance to constrain the spectral index. Therefore we report the flux of both hotspots at 20 TeV, where systematic uncertainties due to the choice of spectral model are minimized and the sensitivity of HAWC is maximized. At e1, the VHE flux is TeV-1 cm-2 s-1, and at w1 the flux is TeV-1 cm-2 s-1. HAWC detects rays from the interaction regions up to at least 25 TeV. The energies of these rays are a factor of three to ten higher than previous measurements from microquasars [24, 25]. Since most -ray telescopes are optimized for measurements below 10 TeV, this may explain why these photons were not observed in previous observational campaigns.
The rays detected by HAWC are produced by radiative or decay processes from much higher energy particles. The detection yields important information about the mechanisms and sites of particle acceleration, the types of particles accelerated (e.g., protons or electrons), and the radiative processes which produce the spectrum of emission from radio to VHE rays. Two scenarios for explaining the HAWC observations of the e1 and w1 regions can be tested. The first is that protons are primarily responsible for the observed rays. Protons must have an energy of at least TeV to produce TeV rays through hadronic collisions with ambient gas. Proton-proton collisions yield particles which decay to VHE rays, and particles which decay to the secondary electrons and positrons responsible for radio to X-ray emission via synchrotron radiation. This scenario is of particular interest because there is spectroscopic evidence for ionized nuclei in the inner jets of SS 433 [8, 26]. The alternative scenario requires electrons of at least TeV to up-scatter the low-energy photons from the cosmic microwave background (CMB) to TeV rays. In this case, the radio to X-ray emission is dominated by synchrotron radiation from this same population of electrons in the magnetized plasma of the jets and lobes.
The fact that the VHE emission is detected along a line of sight nearly orthogonal to the jet axis means that charged particle trajectories become isotropic before they interact to produce the rays. The embedded magnetic fields in the VHE regions can easily deflect the accelerated particles because their typical gyroradii are much smaller than the size of the emission regions, pc. The jets are only mildly relativistic, so the emission from the interaction regions will have a negligible Doppler beaming effect and remain nearly isotropic.
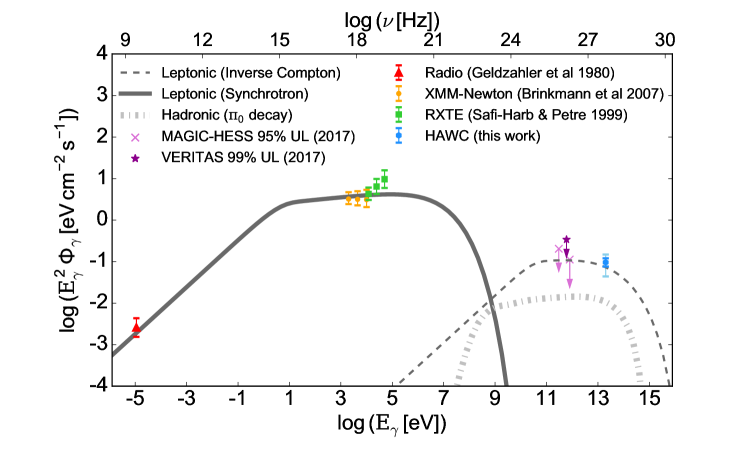
The flux of VHE rays observed by HAWC makes the proton scenario for SS 433 unlikely, because the total energy required to produce the highly relativistic protons is too high. The jets of SS 433 are known to be radiatively inefficient, with most of the jet energy transformed into the thermal energy of W50 [16, 27] rather than particle acceleration. We model the primary proton spectrum as a power law with an exponential cutoff, . If we assume 10% of the jet kinetic energy converts into accelerated protons, and the ambient gas density is cm-3 [16, 27], then the resulting flux of rays from proton-proton collisions is much less than the observed -ray flux, as shown in the dash-dotted line of Fig. 2. In fact, for a target proton density as large as cm-3 in the e1 region [16, 27], the total energy of the proton population needs to be erg to explain the observed rays, assuming an spectrum. This is comparable to the total jet energy available during the presumed 30,000-year lifetime of SS 433 [2]. Furthermore, because the synchrotron emission from secondary electrons from charged pion decay is always lower than the -ray flux from decay, and the observed X-ray flux is higher than the -ray flux, the X-rays cannot originate solely from secondary electrons. Finally, the proton scenario requires that the protons remain trapped in the region observed by HAWC for the lifetime of SS 433 [2]. This means the protons must diffuse very slowly, with a diffusion coefficient of the typical value of the interstellar medium (ISM) cm2 s-1 [28]. This value, comparable to the theoretical Bohm limit, is very small but not impossible. Given the uncertainties in the historical jet flux, the ambient particle density, and the radiative efficiency, we cannot exclude the possibility that some fraction of the -ray flux is produced by protons. However, we do rule out the possibility that the VHE rays are entirely produced by protons.
Highly relativistic electrons, on the other hand, can produce rays much more efficiently, primarily via inverse Compton scattering of CMB photons to rays. The inverse Compton losses due to up-scattering of infrared and optical photons are suppressed due to the Klein-Nishina effect and are thus dominated by scattering of CMB photons [29]. In this scenario, the ratio of the VHE -ray to X-ray fluxes constrains the energy density in the magnetic field compared to the energy density in CMB photons. We have modeled the broadband spectral energy distribution (SED) of the eastern emission region to from the center of SS 433. The solid and dashed lines in Fig. 2 show the SED of a leptonic model for e1 produced by an injected flux of relativistic electrons with an energy spectrum in a magnetic field of strength . We use the parameters , PeV, and G (see the methods section). The estimate of the magnetic field strength is consistent with the equipartition of energy between the relativistic electrons and magnetic fields, which is common in astrophysical systems [16]. The required total energy budget for relativistic electrons is three orders of magnitude lower than the total jet energy.
The maximum electron energy of PeV has significant implications for electron acceleration sites and acceleration mechanisms in SS 433. SS 433 is distinguished from other binary systems with relativistic objects because it realizes a supercritical accretion of gas onto the central engine [2]. Powerful accretion flows and the inner jets near the compact object have therefore been proposed as possible acceleration sites of relativistic particles [26]. However, the observation from HAWC suggests that ultra-relativistic electrons are not accelerated near the center of the binary. If electrons were accelerated in the central region, they would have cooled by the time they reached the sites of observed VHE emission. Due to their small gyroradii, high-energy electrons may transport in a magnetized medium via diffusion or advection. The distance traveled via diffusion within the cooling time of an electron of energy is , using the diffusion coefficient typical of the ISM [28]. This distance would be even smaller for diffusion coefficients lower than the typical ISM value. Similarly, the distance traveled by electrons being advected with the jet flow is for a jet velocity of . Both distance scales are smaller than the pc distance between the binary and e1, indicating the electrons are not accelerated near the center of the system.
Instead, the highly energetic electrons in SS 433 are likely accelerated in the jets and near the VHE -ray emission regions. This presents a challenge to current acceleration models. For example, particle acceleration may be driven by the dissipation of the magnetic fields in the jets, but above several hundred TeV the electron acceleration time exceeds the electron cooling time, assuming a magnetic field. Thus the system does not appear to have sufficient acceleration power, unless there are very concentrated magnetic fields along the jets. If instead particle acceleration is driven by standing shocks produced by the bulk flow of the jets, it is possible to reach PeV energies if the size of the acceleration region is larger than the electrons’ gyroradii. However, shocks in the interaction regions are not currently resolved by X-ray or -ray measurements.
Studies of microquasars such as SS 433 provide valuable probes of the particle acceleration mechanisms in jets, since these objects are believed to be scale models of the much larger and more powerful jets in active galactic nuclei (AGN) [30]. AGN are the most prevalent VHE extragalactic sources and are believed to be the sources of the highest energy hadronic cosmic rays. While AGN are not spatially resolved at VHE energies, with this observation we have identified a VHE source in which we can image particle acceleration powered by jets. Future high-resolution VHE observations of SS 433 are possible with pointed atmospheric Cherenkov telescopes to better localize the emission sites, and further high-energy measurements with HAWC will record the spectrum at high energies and better constrain the maximum energy of accelerated particles.
References
References
- [1] Margon, B. Observations of SS 433. Ann. Rev. Astron. Astrophys. 22, 507–536 (1984).
- [2] Fabrika, S. The jets and supercritical accretion disk in SS433. Astrophys. Sp. Phys. Rev. 12, 1–152 (2004).
- [3] Cherepashchuk, A. M. et al. INTEGRAL observations of SS433: Results of coordinated campaign. Astron. Astrophys. 437, 561–573 (2005).
- [4] Zealey, W. J., Dopita, M. A. & Malin, D. F. The interaction between the relativistic jets of SS433 and the interstellar medium. Mon. Not. Roy. Astron. Soc. 192, 731–743 (1980).
- [5] Margon, B. & Anderson, S. F. Ten Years of SS 433 Kinematics. Astrophys. J. 347, 448–454 (1989).
- [6] Safi-Harb, S. & Ögelman, H. ROSAT and ASCA Observations of W50 Associated with the Peculiar Source SS 433. Astrophys. J. 483, 868–881 (1997).
- [7] Eikenberry, S. S. et al. Twenty Years of Timing SS 433. Astrophys. J. 561, 1027 (2001).
- [8] Migliari, S., Fender, R. P. & Mendez, M. Iron emission lines from extended x-ray jets in SS 433: Reheating of atomic nuclei. Science 297, 1673 (2002).
- [9] Mirabel, I. & Rodríguez, L. F. Sources of Relativistic Jets in the Galaxy. Ann. Rev. Astron. Astrophys. 37, 409–443 (1999).
- [10] Begelman, M. C., King, A. R. & Pringle, J. E. The nature of SS433 and the ultraluminous X-ray sources. Mon. Not. Roy. Astron. Soc. 370, 399–404 (2006).
- [11] Fabrika, S., Ueda, Y., Vinokurov, A., Sholukhova, O. & Shidatsu, M. Supercritical Accretion Discs in Ultraluminous X-ray Sources and SS 433. Nature Phys. 11, 551 (2015).
- [12] Cherepashchuk, A. M., Aslanov, A. A. & Kornilov, V. G. WBVR photometry of SS 433 - Spectra of the normal star and the accretion disk. Sov. Astron. 26, 697–702 (1982).
- [13] Tetarenko, B. E., Sivakoff, G. R., Heinke, C. O. & Gladstone, J. C. WATCHDOG: A Comprehensive All-Sky Database of Galactic Black Hole X-ray Binaries. Astrophys. J. Suppl. 222, 15 (2016).
- [14] Geldzahler, B. J., Pauls, T. & Salter, C. J. Continuum Observations of the Supernova Remnants W50 and G 74.9+1.2 at 2695 MHz. Astron. Astrophys. 84, 237–244 (1980).
- [15] Brinkmann, W., Pratt, G. W., Rohr, S., Kawai, N. & Burwitz, V. XMM-Newton observations of the eastern jet of SS433. Astron. Astrophys. 463, 611–620 (2007).
- [16] Safi-Harb, S. & Petre, R. Rossi X-Ray Timing Explorer Observations of the Eastern Lobe of W50 Associated with SS 433. Astrophys. J. 512, 784–792 (1999).
- [17] Aharonian, F. et al. TeV gamma-ray observations of SS-433 and a survey of the surrounding field with the HEGRA IACT-System. Astron. Astrophys. 439, 635–643 (2005).
- [18] Hayashi, S. et al. Search for VHE gamma rays from SS433/W50 with the CANGAROO-II telescope. Astropart. Phys. 32, 112–119 (2009).
- [19] Ahnen, M. L. et al. Constraints on particle acceleration in SS433/W50 from MAGIC and H.E.S.S. observations. Astron. Astrophys. 612, A14 (2018).
- [20] Kar, P. VERITAS Observations of High-Mass X-Ray Binary SS 433. PoS ICRC2017 (2018).
- [21] Bordas, P., Yang, R., Kafexhiu, E. & Aharonian, F. Detection of Persistent Gamma-ray Emission Toward SS433/W50. Astrophys. J. 807, L8 (2015).
- [22] Abeysekara, A. U. et al. The 2HWC HAWC Observatory Gamma Ray Catalog. Astrophys. J. 843, 40 (2017).
- [23] López-Coto, R. et al. Effect of the diffusion parameters on the observed -ray spectrum of sources and their contribution to the local all-electron spectrum: the EDGE code. Astropart. Phys. 102, 1–11 (2018).
- [24] Albert, J. et al. Variable Very High Energy Gamma-ray Emission from the Microquasar LS I +61 303. Science 312, 1771–1773 (2006).
- [25] Archambault, S. et al. Exceptionally Bright tev Flares From the Binary LS I +61∘ 303. Astrophys. J. 817, L7 (2016).
- [26] Reynoso, M. M., Romero, G. E. & Christiansen, H. R. Production of gamma rays and neutrinos in the dark jets of the microquasar SS433. Mon. Not. Roy. Astron. Soc. 387, 1745–1754 (2008).
- [27] Panferov, A. A. Jets of SS 433 on scales of dozens of parsecs. Astron. Astrophys. 599, A77 (2017).
- [28] Ptuskin, V. S., Moskalenko, I. V., Jones, F. C., Strong, A. W. & Zirakashvili, V. N. Dissipation of magnetohydrodynamic waves on energetic particles: impact on interstellar turbulence and cosmic ray transport. Astrophys. J. 642, 902–916 (2006).
- [29] Moderski, R., Sikora, M., Coppi, P. S. & Aharonian, F. A. Klein-Nishina effects in the spectra of non-thermal sources immersed in external radiation fields. Mon. Not. Roy. Astron. Soc. 364, 1488 (2005).
- [30] Romero, G., Boettcher, M., Markoff, S. & Tavecchio, F. Relativistic Jets in Active Galactic Nuclei and Microquasars. Space Sci. Rev. 207, 5–61 (2017).
We acknowledge the support from: the US National Science Foundation (NSF); the US Department of Energy Office of High-Energy Physics; the Laboratory Directed Research and Development program of Los Alamos National Laboratory; Consejo Nacional de Ciencia y Tecnología, México (grants 271051, 232656, 260378, 179588, 239762, 254964, 271737, 258865, 243290, 132197, and 281653) (Cátedras 873, 1563); Laboratorio Nacional HAWC de rayos gamma; L’OREAL Fellowship for Women in Science 2014; Red HAWC, México; DGAPA-UNAM (Dirección General Asuntos del Personal Académico-Universidad Nacional Autónoma de México; grants IG100317, IN111315, IN111716-3, IA102715, IN109916, IA102917); VIEP-BUAP (Vicerrectoría de Investigación y Estudios de Posgrado-Benemérita Universidad Autónoma de Puebla); PIFI (Programa Integral de Fortalecimiento Institucional) 2012 and 2013; PROFOCIE (Programa de Fortalecimiento de la Calidad en Instituciones Educativas) 2014 and 2015; the University of Wisconsin Alumni Research Foundation; the Institute of Geophysics, Planetary Physics, and Signatures at Los Alamos National Laboratory; Polish Science Centre grant DEC-2014/13/B/ST9/945 and DEC-2017/27/B/ST9/02272; and Coordinación de la Investigación Científica de la Universidad Michoacana. Thanks to S. Delay, L. Díaz, and E. Murrieta for technical support. We acknowledge Richard Mushotzky for providing the spectrum of the XMM-Newton data in the HAWC detection region.
C. D. Rho (crho2@ur.rochester.edu) and H. Zhou (hao@lanl.gov) analyzed the data and performed the maximum likelihood analysis. Modeling of the leptonic and hadronic emission has been carried out by K. Fang (kefang@umd.edu) and H. Zhang (zhan3038@purdue.edu). S. BenZvi (sybenzvi@pas.rochester.edu) and B. Dingus (dingus@lanl.gov) helped prepare the manuscript. The full HAWC Collaboration has contributed through the construction, calibration, and operation of the detector, the development and maintenance of reconstruction and analysis software, and vetting of the analysis presented in this manuscript. All authors have reviewed, discussed, and commented on the results and the manuscript.
The authors declare no competing interests.
The datasets analyzed during this study are available at a public data repository maintained by the HAWC Collaboration: https://data.hawc-observatory.org/.
The study was carried out using the Analysis and Event Reconstruction Integrated Environment Likelihood Fitting Framework (AERIE-LiFF) and the Multi-Mission Maximum Likelihood (3ML) software. The code is open-source and publicly available on Github: https://github.com/rjlauer/aerie-liff and https://github.com/giacomov/3ML. The software includes instructions on installation and usage.
Methods
0.1 Data Reduction and Maximum Likelihood Analysis
This analysis uses 1017 days of data from the High Altitude Water Cherenkov Observatory collected between November 26, 2014 and December 20, 2017. HAWC is an array of 300 tightly packed identical water Cherenkov detectors deployed 4100 m above sea level on the slope of volcano Sierra Negra, Mexico [2]. Each detector is a cylindrical water tank standing 5 m tall and 7.3 m in diameter, filled with 180 000 L of purified water. At the bottom of each tank are four photomultipliers (PMTs) facing upward. The PMTs record the Cherenkov photons created by the relativistic secondary particles produced when primary cosmic rays and rays interact at the top of the atmosphere. The HAWC array covers 22,000 m2. Its construction ended in December 2014, and the full array was commissioned in March 2015.
Using the relative arrival time of photoelectrons (“hits”) detected by the PMTs, the arrival direction of primary rays can be reconstructed with an accuracy of below 1 TeV to above 10 TeV [3]. The accuracy of the reconstruction determines the point spread function (PSF) of the detector, and is a function of the energy, zenith angle, and composition of the primary particle. Air showers from rays are discriminated from the cosmic-ray background by filtering out “clumpy” patterns of hits, which are characteristic of the energy deposited by hadronic cosmic rays. The cosmic-ray background rejection efficiency improves rapidly as a function of energy, increasing from at 1 TeV to at 10 TeV [3].
To compute the statistical significance of -ray emission observed with HAWC, a maximum likelihood fit using parametric spatial and spectral models is applied to the data [4, 5]. The models are forward-folded through the detector response to produce expected counts of -ray signal events and cosmic-ray background events. The expectation is then compared to the observed counts . To calculate the expected counts as a function of position on the sky, the events are binned in a fine mesh using the HEALPix pixelization of the unit sphere [6]. The pixelization is chosen to be , roughly two to five times smaller than the radius of the instrument PSF. To apply models of the energy spectrum of a source, the data are binned according to the fraction of PMTs in the detector triggered by an air shower [3]. This measure of shower “size” is used as a coarse proxy for the energy of the primary particle; a total of 9 size bins is used.
Given a model with spatial and spectral parameters, the maximum likelihood of the model having produced the data is
| (1) |
where the sum runs over the size bins and the HEALPix pixels in the region of interest (RoI) of the fit. is the Poisson probability of detecting events in pixel and size bin given the model parameters .
Within the RoI around SS 433 defined in Extended Data Fig. 1, two fits are performed to maximize the likelihood: a fit which only accounts for the emission from MGRO J1908+06 (null hypothesis), and the combined emission from MGRO J1908+06 and the SS 433 region (alternative hypothesis). The ratio of the maximum likelihood defines a test statistic
| (2) |
where and represent the spatial and spectral parameters of the null and alternative hypotheses, respectively. TS is then converted to a -value to estimate the statistical significance of emission from SS 433. As discussed in the main text, the alternative hypothesis assumes two point sources with power law spectra , where the flux normalization is the free parameter of the spectral model.
Wilks’ Theorem is used to convert TS to a -value [7]. In the joint likelihood maximization, there are 2 degrees of freedom for the two separately fit flux normalizations of the hotspots at w1 and e1. Therefore, we calculate the one-tailed -value . Since the positions of the point source fits at w1 and e1 were chosen after looking into the data, and because we are searching for other microquasars in the field of view of HAWC, we must apply a posteriori corrections to the -value to account for multiple-comparison effects.
The X-ray interaction regions w1, w2, e1, e2, and e3 are a priori candidates for the locations of the maxima, as is the center of the binary system, for a total of six potential hotspots. Given the angular resolution of HAWC, it would not be possible to spatially resolve all six hotspots; at best three regions (east, west, and center) can be separately fit with confidence. There are 23 possible combinations of the six a priori locations which can be used to fit one, two, or three hotspots in the eastern, central, and western regions of the source. We add an additional 12 trials to account for the known microquasars in the field of view of HAWC [9, 8, 13]. This trial factor is conservative given that several galactic microquasars are already known TeV sources [9, 10].
Given 35 total trials, the corrected -value is , which corresponds to a statistical significance of .
0.2 Modeling of the Nearby Extended Source MGRO J1908+06
A bright extended source, MGRO J1908+06, is detected with more than in this dataset and is located less than from the -ray hotspots of SS 433 (Extended Data Fig. 1). The region of MGRO J1908+06 contains a pulsar and a supernova remnant, but it is not clear if the observed TeV -ray emission is from either or even both of them. A detailed discussion of MGRO J1908+06 is beyond the scope of this paper. However, the morphology of MGRO J1908+06 must be carefully studied in order to minimize the contamination of the emission due to MGRO J1908+06 on the fluxes of the lobes.
A maximum likelihood analysis is performed that simultaneously fits the emission from MGRO J1908+06 and the hotspots at w1 and e1. An electron diffusion model appropriate for older pulsar wind nebulae [23, 11] is used to describe the spatial morphology of MGRO J1908+06. Given the uncertainty of the nature of MGRO J1908+06, two other spatial models with Gaussian and power law radial profiles are also tested in the simultaneous fit. The choice of spatial model affects the best-fit fluxes from e1 and w1 at the level of . We adopt this value as a systematic uncertainty on the flux from w1 and e1 due to VHE emission from the nearby extended source.
0.3 Contamination from Galactic Diffuse Emission
The e1 and w1 regions are located roughly from the Galactic plane, so the contamination from the Galactic diffuse emission (GDE) is negligible. However, MGRO J1908+06 has a Galactic latitude of . Since the three spatial models used to fit MGRO J1908+06 are radially symmetric, the presence of GDE has the potential to produce an overestimate in the flux from MGRO J1908+06, which could result in an underestimate in the flux measured from w1 and e1. To minimize the effect of the GDE on the fit, the RoI is defined to be a semicircular region centered on the position of MGRO J1908+06 (Extended Data Fig. 1). The RoI is designed to reduce the effect of GDE by excluding the half of the source closest to the Galactic plane.
To estimate the systematic uncertainties associated with the choice of RoI and possible contamination from GDE, a second maximum likelihood fit is performed using a full-disk RoI which includes GDE, emission from MGRO J1908+06, and w1 and e1. The spatial distribution of the GDE is modeled with a Gaussian profile of three different widths of , , and in Galactic latitude, and is treated as constant in Galactic longitude over the width of the RoI. Comparing the results to the fit with a semicircular RoI indicates that contamination from GDE is less than 10% for e1 and less than 20% for w1.
0.4 Fit Results
The fit results are reported in Extended Data Table 0.4. Fitting the emission from w1 and e1 simultaneously, we calculate , which corresponds to a observation () after accounting for a posteriori statistical trial factors. To check the consistency of the results, we also fit w1 and e1 separately, re-defining the alternative model to include MGRO J1908+06 and only e1 or w1. The significance of the VHE excess from these locations is below in the fits, but the estimated fluxes are consistent with the simultaneous fit.
An additional check is made on the effect of fixing versus floating the best-fit positions of the emission from the east and west hotspots. In the original alternative hypothesis, the point sources are centered on e1 and w1. Here, the positions of the point sources are made additional free parameters in the point source fit. We find that allowing the positions of the TeV hotspots to vary does not affect the flux estimates, which are consistent with the fixed-position fits. Moreover, the best-fit positions of the east and west TeV emission regions are consistent with e1 and w1 within statistical uncertainties.
Extended Data Table 0.4 Fits to the TeV emission from SS 433 using nested point source models
Lobe
Position
(RA, Dec)
at 20 TeV
[ TeV-1cm-2s-1]
TS
Significance
(post trials)
Simultaneous fit to E+W hotspots, positions fixed.
E
19:13:37
04∘55’48”
41.2
W
19:10:37
05∘02’13”
Separate fit to E+W hotspots, positions fixed.
E
19:13:37
04∘55’48”
24.3
W
19:10:37
05∘02’13”
20.4
Separate fit to E+W hotspots, positions floated.
E
19:14:11
04∘59’10”
26.9
W
19:10:40
05∘03’40”
23.4
The choice of spectral model also affects the estimated -ray flux at TeV. Extended Data Table 0.4 shows the dependence of the best-fit VHE flux from e1 and w1 on the assumed spectral models, including statistical uncertainties on the flux normalization at 20 TeV. Two spectral models were tested: a simple power law , and a power law with an exponential cutoff . The choice of spectral model can alter the flux normalization by almost a factor of two compared to the default model.
Extended Data Table 0.4 Dependence of Flux at 20 TeV on Spectral Assumption at 20 TeV [] Index: -1.5 Index: -2.0 Index: -2.5 Cutoff Energy East Lobe West Lobe East Lobe West Lobe East Lobe West Lobe No Cutoff TeV TeV
0.5 Summary of Systematic Uncertainties
The systematic uncertainties in the estimated fluxes from the TeV hotspots of SS 433 include the following contributions: detector systematic effects, modeling ambiguities in MGRO J1908+06, and contamination from Galactic diffuse emission. The systematic uncertainties due to the modeling of MGRO J1908+06 and the contamination from Galactic diffuse emission are and () for the east (west) hotspot, respectively, and are discussed in previous sections.
The detector response is estimated using Monte Carlo simulations and then optimized using observations of the Crab Nebula [3], which appears point-like in the HAWC data. Systematic uncertainties which potentially affect the result presented here include the charge resolution and relative quantum efficiency of the PMTs, the absolute quantum efficiency of the PMTs, changes to the detector layout as construction proceeded, uncertainties in the PSF, and systematic differences in the distribution of arrival times of photoelectrons between data and simulation. The total systematic uncertainty on the flux normalization from detector effects is .
All the components of the systematic uncertainties are summarized in Extended Data Table 0.5 and combined in quadrature to estimate the total systematic uncertainty on the VHE flux from the w1 and e1. We note that since the systematic uncertainties due to MGRO J1908+06 and GDE are anti-correlated, the quadrature sum overestimates the total systematic uncertainty. However, the effect is not particularly important, since the detector systematic effects are the dominant source of uncertainty.
Extended Data Table 0.5 Systematic uncertainties on the flux from SS 433
| Systematic | East Lobe | West Lobe |
|---|---|---|
| Detector Systematic Effects | ||
| MGRO J1908+06 Modeling | ||
| Galactic diffuse contamination | ||
| Total | ||
0.6 X-ray Template Fit and Upper Limit on the Extent of the Emission Regions
We performed several maximum likelihood fits modeling the hotspots as spatially extended sources. In the first fit, we generated spatial templates for the eastern and western regions based on the X-ray contours published by ROSAT [12] and then performed a joint likelihood fit with the two -ray hotspots and MGRO J1908+06. This produces no improvement in TS over a point-source fit.
In order to constrain the size of the -ray emission regions, likelihood fits are applied using a Gaussian morphology convolved with the point spread function of HAWC. To reduce the number of free parameters, we first fit MGRO J1908+06 using an RoI with SS 433 and its hotspots excluded. The extended fit from MGRO J1908+06 is then subtracted from the data, and the residual -ray emission from the -ray hotspots is fit using two Gaussian functions. The centers of the Gaussians are fixed to e1 and w1, and their angular widths are estimated in a simultaneous fit to both the eastern and western regions.
The maximum likelihood fit yields an angular width of for the east hotspot and for the west hotspot. We estimate the 90% confidence region on the extent as the value of Gaussian width which produces a decrease from the maximum likelihood value. The resulting 90% upper limits are for the east region and for the west region.
0.7 Upper Limit on Emission from the Central Binary
In the present data set, no statistically significant emission is observed from the center of SS 433. Using the method of Feldman and Cousins [13], we estimate the 90% upper limit on the flux at TeV to be TeV-1 cm-2 s-1 after fitting MGRO J1908+06 and the emission at e1 and w1.
0.8 Upper Limit on Detected -ray Energy
The binning of -ray events into size bins causes us to lose information about the energies of the rays observed from SS 433. To determine the upper energy bound on the flux we observe, we scan over the maximum energy used in the forward-folding analysis. Starting at TeV, we find that TS increases monotonically until TeV. Increasing above this value causes TS to plateau (for e1) or decrease slightly (w1). We infer that the current measurement of e1 and w1 implies a minimum TeV, and report this as a conservative estimate of the highest energy observed by HAWC.
0.9 Study of Residual Emission in the Region of Interest
As a final check of the quality of the maximum likelihood fits, we plot the distribution of the significance values in each HEALPix pixel in the RoI around SS 433 in Extended Data Fig. 2. The significance values are plotted in units of Gaussian . If only random background fluctuations are present, the significance values follow a standard normal distribution, shown by the dashed line in the figure.
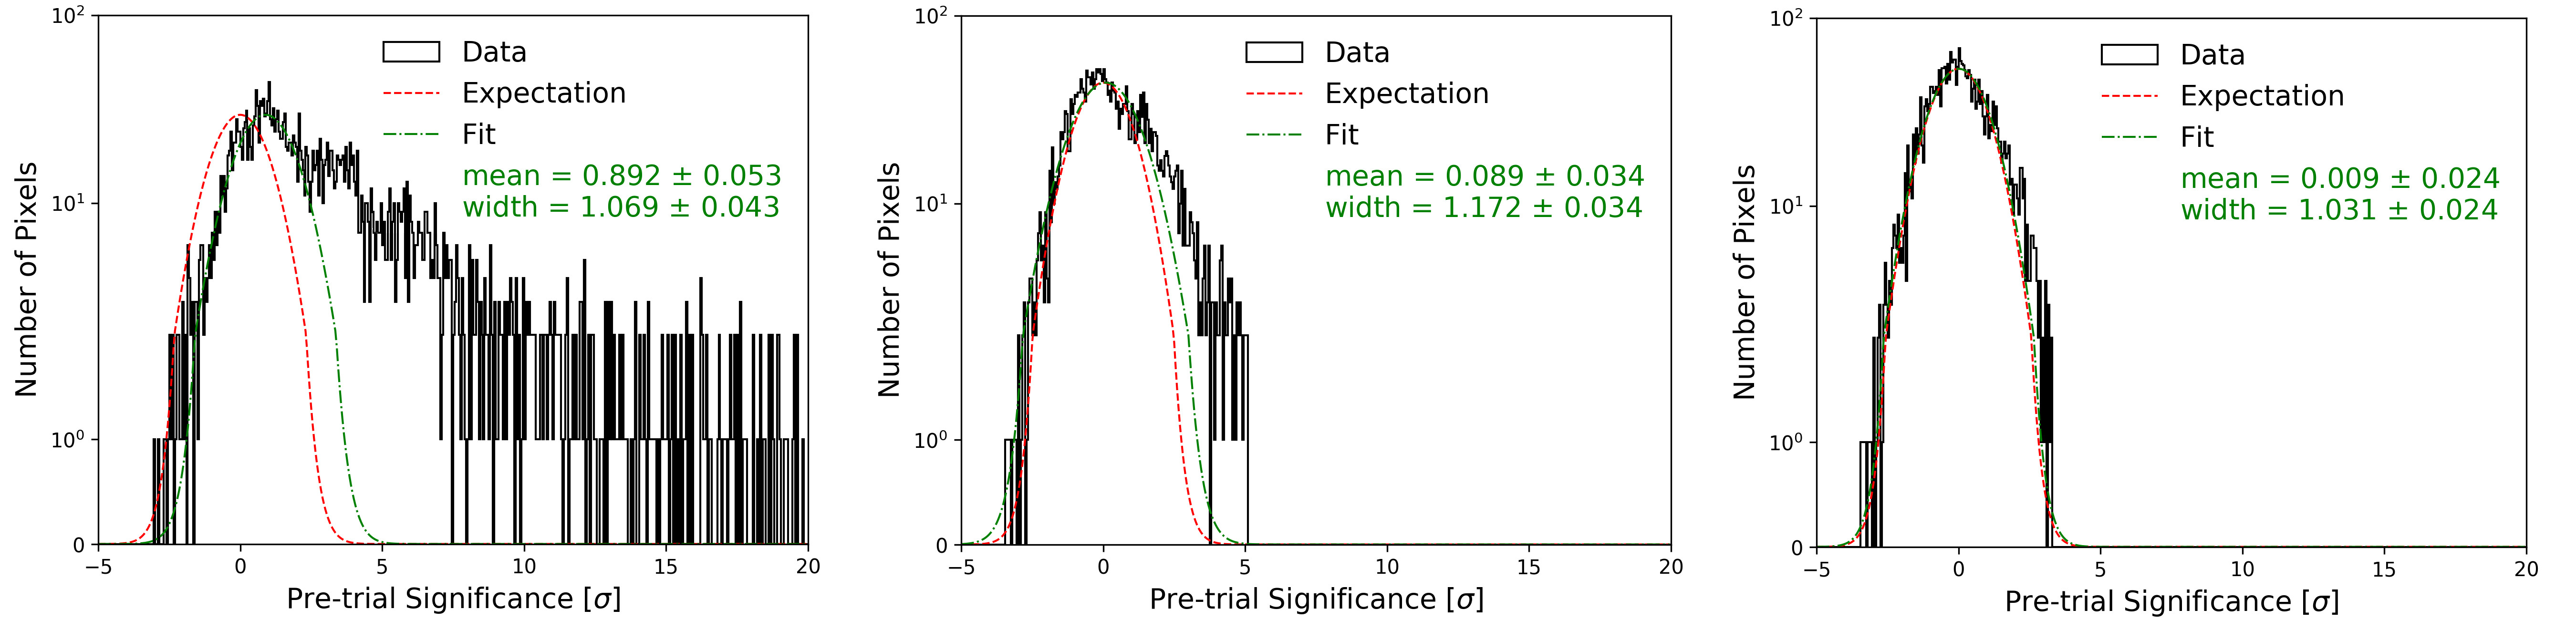
Prior to the maximum likelihood fit, the significance distribution in the RoI is considerably skewed toward positive values due to excess counts above background from MGRO J1908+06 and rays from w1 and e1 (left panel of Extended Data Fig. 2). After the subtraction of the maximum likelihood fit to emission from MGRO J1908+06 (center panel), the skew in the distribution is considerably reduced, though still visible due to excess counts from the interaction regions near SS 433. Finally, subtraction of the maximum likelihood flux from w1 and e1 produces a distribution that, within statistical uncertainties, is equivalent to background fluctuations (right panel).
0.10 VHE Emission due to Leptonic Interactions
In the leptonic scenario considered in this paper, relativistic electrons scatter photons from the cosmic microwave background photons to TeV energies via the inverse Compton process, and produce X-ray and radio emissions by the synchrotron radiation. Although a far infrared background in the lobe may contribute to the production of sub-TeV photons, no appreciable infrared emission has been reported near the -ray emission region [2, 14]. The electron spectrum is obtained by solving the continuity equation, considering radiative cooling [15]. The best-fit values of the parameters of the injection spectrum, including the flux, spectral index, and maximum energy of the electrons, and the magnetic field strength in the source region, are obtained through Markov Chain Monte Carlo [16] sampling of their likelihood distributions when fitting to the multi-wavelength data. The radio and soft X-ray data points correspond to the Effelsberg Telescope [14] and the XMM-Newton (the Mos1 detector) [15] observations of a circle centered on e1. A 30% uncertainty attributed to the unknown shape of the HAWC source is added to the statistical and systematic errors of the observational data, though we find the uncertainty has a negligible impact on the fit. The hard X-ray data points and the sub-TeV upper limits are set by the RXTE, MAGIC, HESS, and VERITAS observations of the e1 region [16, 19, 20].
The VHE flux is determined using the flux from e1 at 20 TeV reported in Extended Data Table 0.4, where separate fits were made to eastern and western hotspots, and the positions were fixed to e1 and w1. The best-fit values of the injection spectrum and magnetic field in the emission region are , , and . Taking the distance to the source to be 5.5 kpc, the fit suggests a total electron energy of erg. This is a small fraction of the total energy deposited by the jets of SS 433 over their lifetime, which is erg assuming a kinetic jet luminosity of erg s-1 [2]. Future multi-wavelength observations dedicated to the VHE -ray emission region will better constrain the magnetic field strength and the properties of the electron population.
We note that the presence of multi-hundred TeV to PeV electrons would challenge the current particle acceleration mechanisms. Successful acceleration requires that the acceleration rate based on heuristic considerations (where is the velocity associated with the notional electromotive force) exceed the cooling rate assuming that synchrotron radiation dominates the cooling processes in the lobes of SS 433. This leads to a maximum electron energy For reference, the Alfvén speed in the lobes is A higher Alfvén speed could be achieved if the acceleration takes place in the central spine of the jet, where the mass loading due to black hole accretion is smaller and the magnetic field is stronger. Depending on the exact electron acceleration mechanisms, could be associated with the jet flow velocity, or with the Alfvén speed. In both cases, using these estimates, it is possible that the maximum electron energy can exceed PeV. However, the timescale of acceleration mechanisms such as second-order Fermi acceleration is proportional to , making the production of multi-hundred TeV electrons less efficient. Future VHE -ray and hard X-ray observations can better constrain the electron cutoff energy, and diagnose the in situ particle acceleration mechanism.
0.11 VHE Emission due to Hadronic Interactions
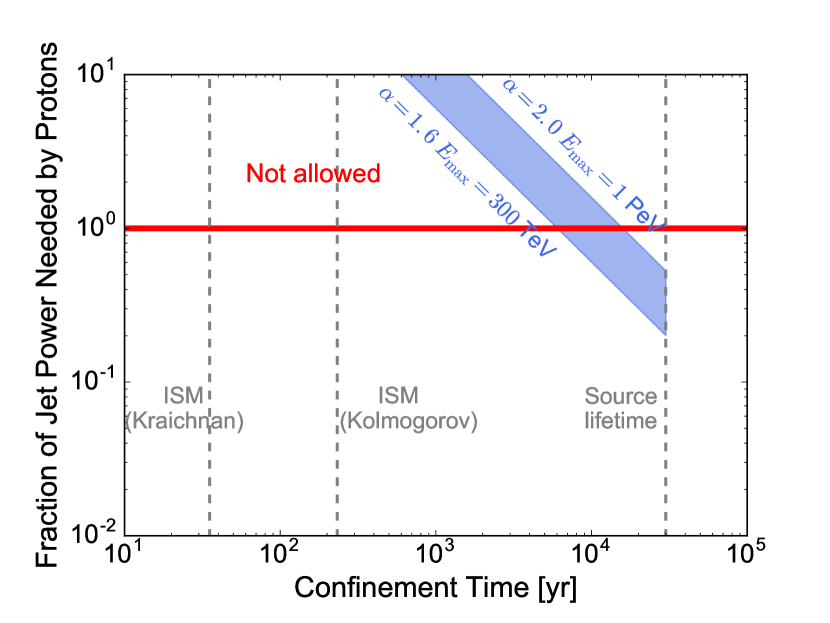
In the hadronic scenario, high-energy protons interact with the ambient gas in the source, and produce rays via the decay . Extended Data Fig. 3 shows the fraction of jet power needed to be converted to protons to produce the observed -ray flux. We assume a proton spectrum , and adopt a proton-proton interaction cross section of [17], and a baryon density of [16, 27]. The total proton energy is obtained by integrating this spectrum normalized to the VHE -ray flux.
If the diffusion coefficient in the source is comparable to that in the ISM, no hadronic models would be allowed, as they would require a proton injection rate that exceeds the total kinetic luminosity of the jets of SS 433. Even in extreme circumstances, e.g., where the diffusion coefficient is extremely small (possibly due to scattering by turbulence generated from the streaming cosmic rays [18, 19]), particles could remain in the jet as long as the jet lifetime of yr [2]. Assuming that protons follow a hard spectrum with , the hadronic scenario would still require that at least 30% of the jet power goes to protons. While a hadronic origin to the VHE flux is possible, it requires rather extreme source parameters and is therefore disfavored.
References
References
- [1]
- [2] Smith, A. J. HAWC: Design, Operation, Reconstruction and Analysis. PoS ICRC2015, 966 (2016).
- [3] Abeysekara, A. U. et al. Observation of the Crab Nebula with the HAWC Gamma-Ray Observatory. Astrophys. J. 843, 39 (2017).
- [4] Younk, P. W. et al. A high-level analysis framework for HAWC. PoS ICRC2015, 948 (2016).
- [5] Vianello, G. et al. The Multi-Mission Maximum Likelihood framework. PoS ICRC2015, 1042 (2016).
- [6] Gorski, K. M. et al. HEALPix - A Framework for high resolution discretization, and fast analysis of data distributed on the sphere. Astrophys. J. 622, 759–771 (2005).
- [7] Wilks, S. S. The Large-Sample Distribution of the Likelihood Ratio for Testing Composite Hypotheses. Ann. Math. Stat. 9, 60–62 (1938).
- [8] Chaty, S. & Delautier, S. Catalog of Microquasars. http://www.aim.univ-paris7.fr/CHATY/Microquasars/microquasars.html (2006). Université Paris Diderot.
- [9] Aharonian, F. et al. Discovery of Very High Energy Gamma Rays Associated with an X-ray Binary. Science 309, 746–749 (2005).
- [10] Aliu, E. et al. Multiwavelength Observations of the TeV Binary LS I +61∘ 303 with VERITAS, Fermi-LAT, and Swift/XRT during a TeV Outburst. Astrophys. J. 779, 88 (2013).
- [11] Abeysekara, A. U. et al. Extended gamma-ray sources around pulsars constrain the origin of the positron flux at Earth. Science 358, 911–914 (2017).
- [12] Brinkmann, W., Aschenbach, B. & Kawai, N. ROSAT observations of the W 50/SS 433 system. Astron. Astrophys. 312, 306–316 (1996).
- [13] Feldman, G. J. & Cousins, R. D. A Unified approach to the classical statistical analysis of small signals. Phys. Rev. D57, 3873–3889 (1998).
- [14] Fuchs, Y., Mirabel, I. F. & Ogley, R. N. Mid-Infrared observations of GRS 1915+105 and SS433. Astrophys. Sp. Sci. Suppl. 276, 99–100 (2001).
- [15] Finke, J. D. & Dermer, C. D. Cosmic Ray Electron Evolution in the Supernova Remnant RX J1713.7-3946. Astrophys. J. 751, 65 (2012).
- [16] Foreman-Mackey, D., Hogg, D. W., Lang, D. & Goodman, J. emcee: The MCMC Hammer. Publ. Astron. Soc. Pac. 125, 306–312 (2013).
- [17] Eidelman, S. et al. Review of particle physics. Particle Data Group. Phys. Lett. B592, 1–5 (2004).
- [18] Amato, E. & Blasi, P. Non linear particle acceleration at non-relativistic shock waves in the presence of self-generated turbulence. Mon. Not. Roy. Astron. Soc. 371, 1251–1258 (2006).
- [19] Malkov, M. A., Diamond, P. H., Sagdeev, R. Z., Aharonian, F. A. & Moskalenko, I. V. Analytic Solution for Self-regulated Collective Escape of Cosmic Rays from their Acceleration Sites. Astrophys. J. 768, 73 (2013).