Detection of a high-mass prestellar core candidate in W43-MM1††thanks: Figures A1 and A2 are only available in electronic form at http://www.aanda.org.
Abstract
Aims. To constrain the physical processes that lead to the birth of high-mass stars it is mandatory to study the very first stages of their formation. We search for high-mass analogs of low-mass prestellar cores in W43-MM1.
Methods. We conducted a 1.3 mm ALMA mosaic of the complete W43-MM1 cloud, which has revealed numerous cores with au FWHM sizes. We investigated the nature of cores located at the tip of the main filament, where the clustering is minimum. We used the continuum emission to measure the core masses and the 13CS(5-4) line emission to estimate their turbulence level. We also investigated the prestellar or protostellar nature of these cores by searching for outflow signatures traced by CO(2-1) and SiO(5-4) line emission, and for molecular complexity typical of embedded hot cores.
Results. Two high-mass cores of 1300 au diameter and 60 mass are observed to be turbulent but gravitationally bound. One drives outflows and is associated with a hot core. The other core, W43-MM1#6, does not yet reveal any star formation activity and thus is an excellent high-mass prestellar core candidate.
Key Words.:
stars: formation – stars: protostars – stars: massive – ISM: clouds – submillimeter: ISM1 Introduction
Despite the large efforts made in the past ten years to improve our understanding of the formation of high-mass stars, two competing families of models remain. In the ‘core-fed’ or ‘core-accretion’ models, a high-mass star forms through the monolithic collapse of a massive, turbulent prestellar core that formed quasi-statically (e.g., McKee & Tan 2003). This preassembled core is in virial equilibrium, similar to low-mass prestellar cores, but supported by some magnetic and/or supersonic turbulent pressure that prevents the subfragmentation of this core. A few high-mass prestellar core candidates have been reported (Bontemps et al. 2010; Duarte-Cabral et al. 2013; Wang et al. 2014) but more examples are needed to support this scenario.
On the other hand, the ‘clump-fed’ models involve the gas mass reservoir surrounding individual cores through dynamical processes in their parental cloud. These models propose the rapid growth of cores via competitive accretion of the common cloud mass reservoir (e.g., Bonnell & Bate 2006) or via accretion streams associated with the global hierarchical collapse of clouds (e.g., Smith et al. 2009; Vázquez-Semadeni et al. 2017). Observationally, there is a growing body of evidences in favor of dynamical, clump-fed models (e.g., Schneider et al. 2010; Csengeri et al. 2011; Peretto et al. 2013; Henshaw et al. 2014; Louvet et al. 2016). In the empirical evolutionary sequence recently proposed for the formation of high-mass stars, the high-mass prestellar core phase does not even exist and high-mass protostellar cores form from low-mass protostellar cores, which accrete further material from their parental massive dense core (MDC) (Motte et al. 2018a).
Imaging cold, high-mass star-forming clouds is needed to reach a consensus on the existence of a high-mass prestellar core phase. W43, located at 5.5 kpc from the Sun (Zhang et al. 2014), contains two of the largest groups of molecular clouds in the first Galactic quadrant, among them W43-MM1 (Nguyen Luong et al. 2011, 2013). This pc2 ridge has a mass and qualifies as ‘mini-starburst’ because its star formation activity is reminiscent of that of starburst galaxies (SFR 6000 Myr-1; Motte et al. 2003; Louvet et al. 2014). Imaged with ALMA, W43-MM1 revealed one of the youngest and richest clusters of high-mass cores in the Milky Way (Motte et al. 2018b).
In the present paper, we characterize two high-mass cores located in the least clustered part of W43-MM1 and report on the possible discovery of one high-mass prestellar core. From the observations presented in Sect. 2, we derive the core characteristics using dust continuum (see Sect. 3.1) and investigate their gravitational boundedness and evolutionary status with molecular line observations (see Sects. 3.2–3.3). Core properties are then used in Sect. 4 to discuss their prestellar versus protostellar nature and the most probable physical process forming high-mass stars in W43-MM1.
2 Observations and data reduction
Observations were carried out in Cycle 2 between July 2014 and June 2015 (project #2013.1.01365.S), with ALMA 12 m and 7 m (ACA) arrays and baselines ranging from 7.6 m to 1045 m. W43-MM1 was imaged with a 53 (2.1 pc 1.4 pc) mosaic composed of 33 fields with the 12 m array and 11 fields with ACA. In the 12 m configuration, the primary beam is of 26.7 (45.8 with ACA) and the maximum detectable scale is of 12 (21 with ACA). Parameters of the four spectral windows used in this study are presented in Table 1. Data were reduced in CASA 4.3.1, applying manual and self-calibration scripts.
We then used the CLEAN algorithm with a robust weight of 0.5 and the multiscale option to minimize interferometric artifacts due to missing short spacings. Core extraction was carried out on the 12 m continuum data providing the best resolution (synthesized beam of 0.37 0.53, 2400 au at 5.5 kpc) and the best sensitivity (0.13 mJy beam on the 1.9 GHz averaged map). For the molecular line studies we used the merged (12 m + 7 m) data with characteristics given in Table 1.
| Spectral | Bandwidth | Resolution | rms | ||
| window | [GHz] | [MHz] | [] [km s-1] | a𝑎aa𝑎a rms in [mJy beam-1]. 1 mJy beam-1 corresponds to 0.12 K at 233.4 GHz. | |
| SiO(5-4) | 217.033 | 234 | 0.48 | 0.3 | 2.5 |
| CO(2-1) | 230.462 | 469 | 0.46 | 1.3 | 3.1 |
| 13CS(5-4) | 231.144 | 469 | 0.46 | 0.3 | 3.1 |
| Continuum | 233.4 | 1875 | 0.43 | 1.3 | 1.9 |
| Cores | R.A. | Dec. | FWHM | a𝑎aa𝑎afootnotemark: | Outflow lobes | |||||
| [J2000] | [J2000] | [au] | [mJy/beam] | [mJy] | [K] | [] | [km s-1] | [pc] | ||
| #3 | 18:47:46.37 | -1:54:33.41 | 1200 | 0.2 | 0.12 | |||||
| #6 | 18:47:46.16 | -1:54:33.30 | 1300 | 0.2-0.3 | ¡ 0.01 |
Virial parameter, , calculated with density indexes of for both cores and for core #6.
3 Result and analysis
3.1 Core extraction and mass estimation
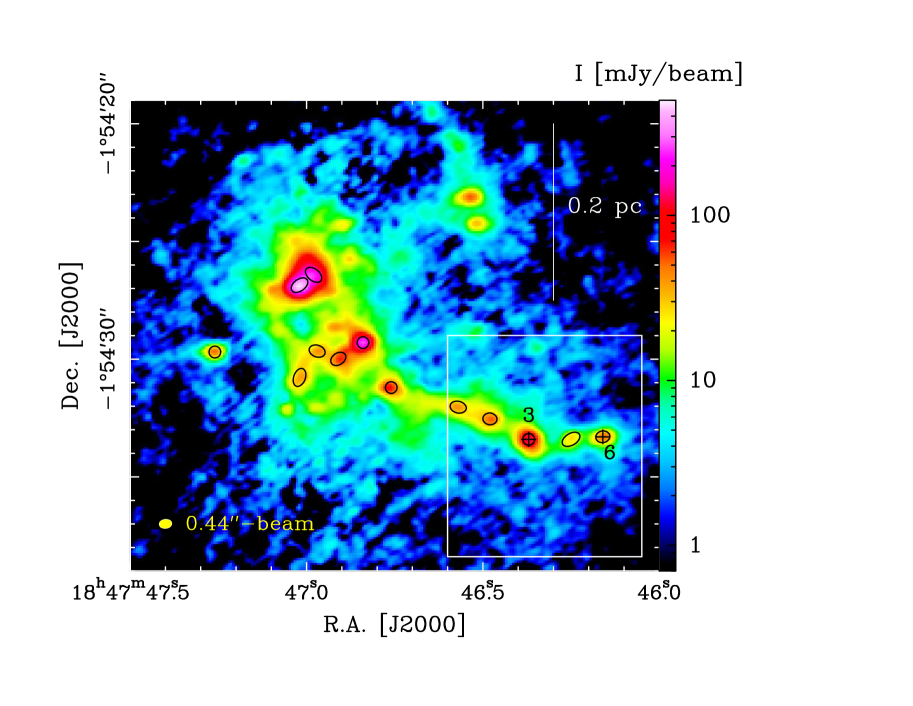
Compact sources were extracted using getsources (v1.140127), a multiscale, multiwavelength source-extraction algorithm (Men’shchikov et al. 2012). The final getsources catalogs of the W43-MM1 cloud contains 131 reliable sources presented in Motte et al. (2018b). Among these sources, 13 high-mass cores with masses from 16 to 100 are expected to form high-mass stars, assuming a 50% core-to-star efficiency for these very high-density cores. They have diameters ranging from 1200 to 2600 au once deconvolved from the 0.44 beam. These cores are outlined with ellipses on the 1.3 mm continuum map of Fig 1. We chose to focus on cores #3 and #6, two high-mass cores located at the western tip of the main filament (see Fig. 1), where the blending associated with clustering is minimum. Table 2 lists their coordinates, Gaussian full width at half maximum (FWHM) sizes, peak, and integrated fluxes.
The (gas + dust) mass of a core, having uniform opacity throughout its solid angle, is given by
| (1) |
where is the solid angle of the beam, kpc is the distance to the core, is the dust opacity per unit of (gas dust) mass at 1.3 mm, and are the peak and integrated fluxes of the core and is the Planck function at dust temperature .
The 1.3 mm continuum flux of a core arises mainly from thermal dust emission, which is generally optically thin. This is no longer the case for the densest, most massive cores. Equation 1 thus includes a correction for dust opacity, which increases the mass of cores #3 and #6 by 20%. Fluxes given in Table 2 are also corrected for contamination by free-free and line emission (see details in Motte et al. 2018b). The mean dust temperature of cores was estimated by applying the Bayesian PPMAP procedure (Marsh et al. 2015) to all existing continuum data of W43-MM1 (see Fig. 3 of Motte et al. 2018b). We adopted as being the most appropriate for the high-density, , cool to warm, , cores. The absolute uncertainties on core masses is estimated to be about a factor of two. Table 2 lists the assumed temperatures and derived masses, and for cores #3 and #6, respectively.
3.2 Virial mass and gravitational boundedness
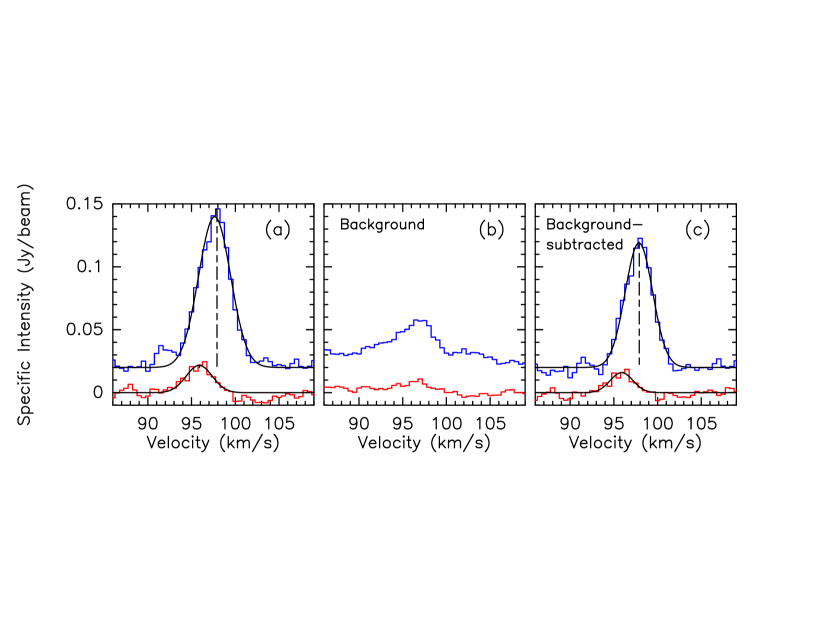
To qualify as stellar progenitors, cores must be gravitationally bound. We characterize the isotropic turbulence of cores listed in Table 2 using the J=5-4 transition of 13CS, a good tracer of high-density gas (critical density ). The 13CS emission peaks toward high-mass cores but is also detected along their parental filament and their outflow. We thus subtracted, from each core spectrum, the contribution of the core parental filament and outflow before fitting a Gaussian (see Fig. A1). The line FWHM given in Table 2 corresponds to the average of the fits before and after this subtraction. The line widths are large, and , for cores #3 and #6, respectively.
The virial mass, , is measured as
| (2) |
where n is the index of the density profile (), is the 1D nonthermal velocity dispersion, FWHM is the deconvolved size of cores, and G is the gravitational constant. We assume a density index of (case of a centrally concentrated protostar) for both cores and (case of a flat starless core) for core #6, whose nature could be prestellar (see Sect. 4). The parameter is derived by subtracting the thermal component from the total velocity dispersion, where is the 13CS molecular weight, is the Boltzmann constant, and is the hydrogen mass. Given that their virial parameters are well below unity, , even with a factor of two uncertainty on masses, cores #3 and #6 are gravitationally bound and could be collapsing if no extra support, such as from magnetic fields, prevents it.
3.3 Search for signposts of protostellar activity
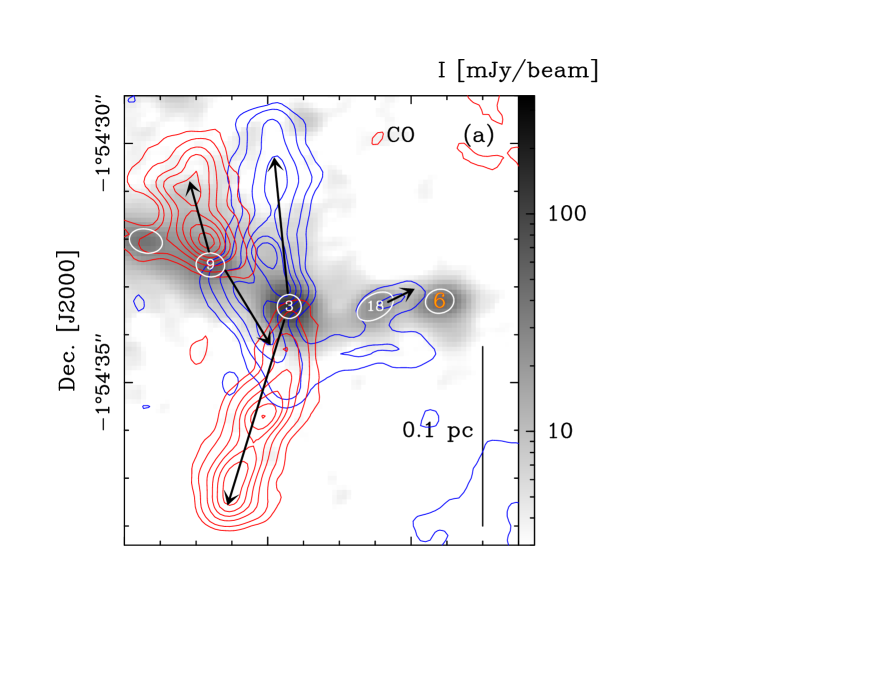
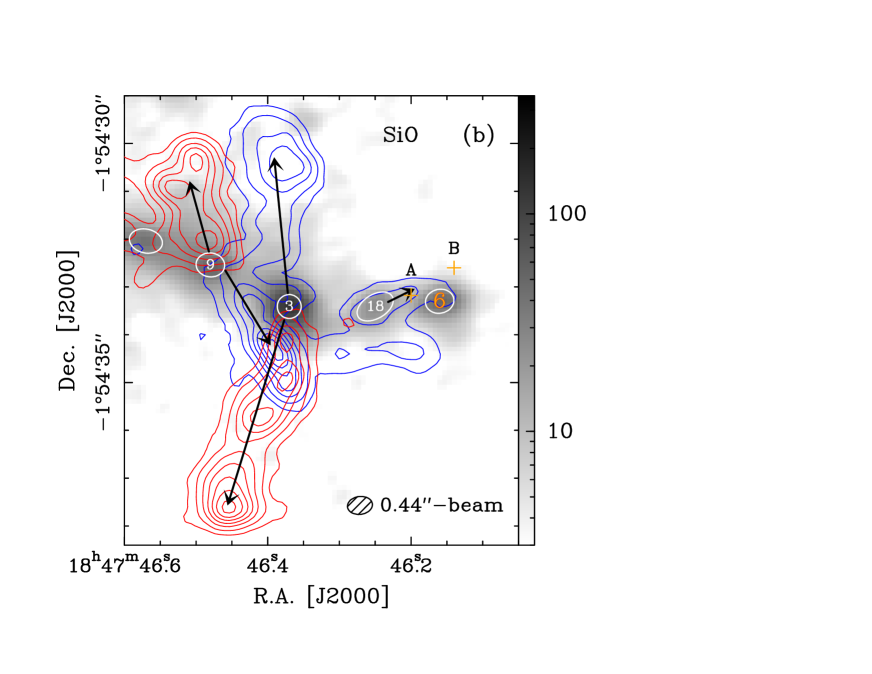
Gas outflows associated with accretion are certainly the best, systematic signpost of protostellar activity. We integrated the high-velocity line wings of CO(2-1) and SiO(5-4) around the systemic velocities for core #6 and for core #3. The resulting lobes of bipolar outflows shown in Figs. 2a–b present an excellent agreement between the CO(2-1) and SiO(5-4) line tracers. While core #3 unambiguously drives a well-developed outflow (see Figs. 2a–b and Table 2), the weak blue-shifted emission detected both in CO(2-1) and SiO(5-4) toward core #6 is probably not associated with this core. As shown in Fig. A2, the SiO(5-4) emission consists of two components. One decreasing from core #18 to location A (see Fig. 2b) is associated with the outflow of core #18. Another component peaking at location B could be associated with low-velocity shocks such as those observed by Louvet et al. (2016). Core #6 thus seems to lack protostellar outflow but more sensitive and higher resolution observations (see Table 1) will be needed to confirm this finding.
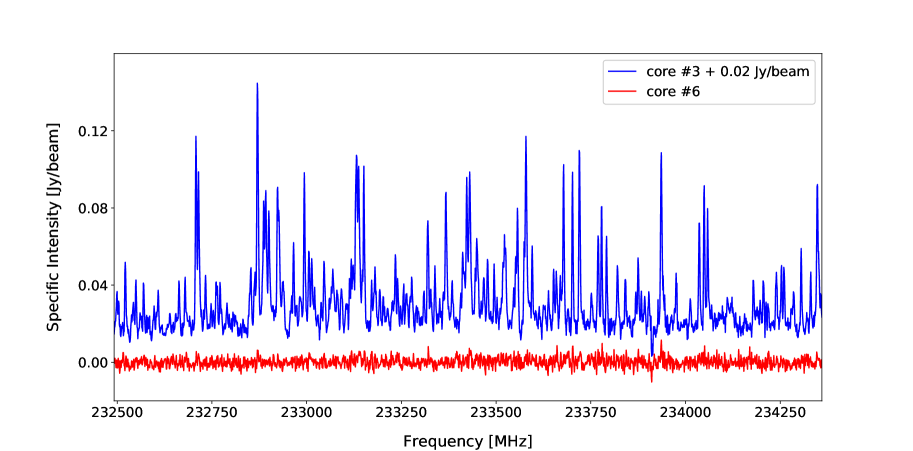
The detection of line forests in spectral bands indicates molecular complexity (e.g., Herbst & van Dishoeck 2009) and is often used to pinpoint hot cores. Figure 3 shows the 1.9 GHz spectral band at 233.5 GHz for cores #3 and #6. Very few lines are detected toward core #6: few transition lines associated with methanol and methyl formate are detected at a 3 level in the continuum spectral window of core #6. A careful analysis and modeling of the peculiar chemical complexity toward this core (Molet et al. in prep.) aims to interpret it in terms of protostellar heating, small-scale, or even large-scale shocks. These features are in strong contrast with the line forest observed for core #3 (see Fig. 3). We also performed a quantitative measurement of the richness of the line forest by comparing the flux integrated over a line-free composite band of 65 MHz with the flux integrated over the 1.9 GHz full band, consisting of the sum of the line-free plus line-contamination fluxes. Line contamination, estimated by its the ratio to the line-free continuum flux, is for core #3 and toward core #6 (Motte et al. 2018b). These results suggest that core #3 hosts a hot core while core #6 may not yet.
4 Discussion and conclusions
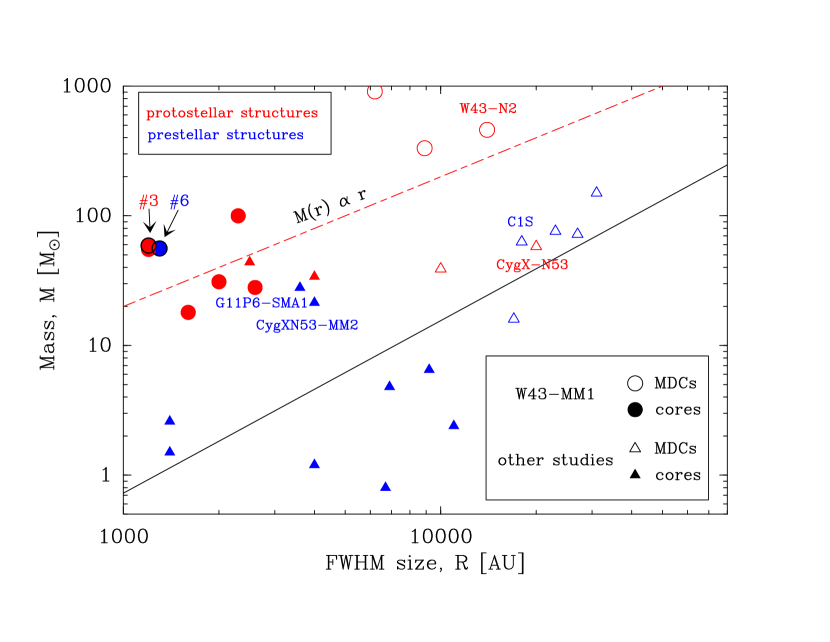
The two cores discussed in this work have remarkably large masses, , given their small diameters, 1300 au (see Table 2), leading to extreme densities, . In Fig. 4, cores #3 and #6 are compared to cores of a few 1000 au sizes found within cold MDCs (0.1 pc). These two cores are among the most massive detected so far at au scales. They have high turbulent levels, corresponding to Mach number , which resemble those observed for ten-times larger young MDCs (e.g., Ragan et al. 2012; Kauffmann et al. 2013) and probably testifies to the high dynamics observed in W43-MM1 (e.g., Nguyen Luong et al. 2013; Louvet et al. 2016). Despite that, these cores have low virial parameters, , which proves they are gravitationally bound and could be collapsing if no extra support such as magnetic field prevents it. Core #3 drives a bipolar outflow (see Figs. 2a–b) and displays molecular complexity possibly associated with hot core emission (see Fig. 3). In contrast, core #6 shows no signs of protostellar activity. We currently cannot rule out the existence of an unresolved outflow and/or a small and embedded hot core, but core #6 is, for now, an excellent high-mass prestellar core candidate.
Core #6 could therefore be among the very few examples representing the initial conditions of the McKee & Tan (2003) model of high-mass star formation. In detail, this turbulent-core accretion model assumes that a core with and is quasi-statically assembled. Observationally, however, most of the cloud structures subfragment in protostars (Bontemps et al. 2010; Tan et al. 2016) or dissolve into low-mass cores (Kong et al. 2017, Louvet et al. subm.). In contrast core #6, with its mass within 1300 au, keeps a large fraction, 12%, of its parental MDC mass (W43-N2, Louvet et al. 2014). This gas concentration tends to follow the relation predicted for gravitationally bound cores such as Bonnor Ebert spheres (see Fig. 4). Core #6 is also twice more massive than the few other high-mass prestellar core candidates, including CygXN53-MM2 (Bontemps et al. 2010; Duarte-Cabral et al. 2013) and G11P6-SMA1 (Wang et al. 2014).
Given that cores #3 and #6 have the same masses but different evolutionary stages, we use these cores to illustrate the evolutionary sequence proposed by Motte et al. (2018a). Core #3 is a high-mass core, hosting a stellar embryo massive enough to power a hot core. This would then correspond to the IR-quiet or IR-bright protostellar core phases, which are steps 4 and 5 of this scenario. Core #6 itself could either be a high-mass prestellar core or a very young high-mass protostellar core, hosting a very low-mass stellar embryo. While the existence of a high-mass prestellar phase is refuted in Motte et al. (2018a), the second interpretation would put core #6 in the IR-quiet protostellar core phase (step 4).
The mass-to-luminosity ratio, often used as an indicator of the evolutionary stage of cores, complies with core #6 being younger than core #3. Motte et al. (2018b) roughly evaluated the bolometric luminosity of cores from the total luminosity of W43-MM1, (Motte et al. 2003), divided between the cores in proportion to their line contamination. These luminosities, for cores #6 and for cores #3, lead to ratios of and for cores #6 and #3, respectively. These decreasing ratios, for cores of similar sizes and masses, indicates an increasing proportion of gas in the stellar embryo relative to the cold core and thus an evolution in time through the high-mass star-formation process.
We have proposed that core #6 could represent the initial conditions of the turbulent-core monolithic-collapse model (McKee & Tan 2003). However, since W43-MM1 is a very dynamical cloud (Louvet et al. 2016), its cores are expected to simultaneously collapse and grow in mass from their surrounding cloud gas. Therefore, core #6 may be more consistent with the earliest stage of the accretion-stream model of Smith et al. (2009) and Vázquez-Semadeni et al. (2017) than with the quasi-static preassembled core taken for initial conditions in the model of McKee & Tan (2003).
Acknowledgements.
We thank A. Men’shchikov for his help on getsources. This paper makes use of the following ALMA data: #2013.1.01365.S. ALMA is a partnership of ESO (representing its member states), NSF (USA), and NINS (Japan), together with NRC (Canada), MOST and ASIAA (Taiwan), and KASI (Republic of Korea), in cooperation with the Republic of Chile. The Joint ALMA Observatory is operated by ESO, AUI/NRAO, and NAOJ. This project has received funding from the European Union’s Horizon 2020 research and innovation program StarFormMapper under grant agreement No 687528. This work was supported by the Programme National de Physique Stellaire and Physique et Chimie du Milieu Interstellaire (PNPS and PCMI) of CNRS/INSU (with INC/INP/IN2P3) co-funded by CEA and CNES.References
- Bonnell & Bate (2006) Bonnell, I. A. & Bate, M. R. 2006, MNRAS, 370, 488
- Bontemps et al. (2010) Bontemps, S., Motte, F., Csengeri, T., & Schneider, N. 2010, A&A, 524
- Csengeri et al. (2011) Csengeri, T., Bontemps, S., Schneider, N., Motte, F., & Dib, S. 2011, A&A, 527, A135
- Duarte-Cabral et al. (2013) Duarte-Cabral, A., Bontemps, S., Motte, F., et al. 2013, A&A, 558, A125
- Henshaw et al. (2014) Henshaw, J. D., Caselli, P., Fontani, F., Jiménez-Serra, I., & Tan, J. C. 2014, MNRAS, 440, 2860
- Herbst & van Dishoeck (2009) Herbst, E. & van Dishoeck, E. F. 2009, ARA&A, 47, 427
- Kauffmann & Pillai (2010) Kauffmann, J. & Pillai, T. 2010, ApJ, 723, L7
- Kauffmann et al. (2013) Kauffmann, J., Pillai, T., & Goldsmith, P. F. 2013, ApJ, 779, 185
- Kong et al. (2017) Kong, S., Tan, J. C., Caselli, P., et al. 2017, ApJ, 834, 193
- Louvet et al. (2016) Louvet, F., Motte, F., Gusdorf, A., et al. 2016, A&A, 595, A122
- Louvet et al. (2014) Louvet, F., Motte, F., Hennebelle, P., et al. 2014, A&A, 570, A15
- Marsh et al. (2015) Marsh, K., Whitworth, A., & Lomax, O. 2015, MNRAS, 454, 4282
- McKee & Tan (2003) McKee, C. F. & Tan, J. C. 2003, ApJ, 585, 850
- Men’shchikov et al. (2012) Men’shchikov, A., André, P., Didelon, P., et al. 2012, A&A, 542, A81
- Motte et al. (2018a) Motte, F., Bontemps, S., & Louvet, F. 2018a, ARA&A, 56 [https://doi.org/10.1146/annurev-astro-091916-055235]
- Motte et al. (2018b) Motte, F., Nony, T., Louvet, F., et al. 2018b, Nature Astronomy, 2, 478
- Motte et al. (2003) Motte, F., Schilke, P., & Lis, D. C. 2003, ApJ, 582, 277
- Nguyen Luong et al. (2013) Nguyen Luong, Q., Motte, F., Carlhoff, P., et al. 2013, ApJ, 775, 88
- Nguyen Luong et al. (2011) Nguyen Luong, Q., Motte, F., Schuller, F., et al. 2011, A&A, 529, A41
- Peretto et al. (2013) Peretto, N., Fuller, G. A., Duarte-Cabral, A., et al. 2013, A&A, 555, A112
- Ragan et al. (2012) Ragan, S. E., Heitsch, F., Bergin, E. A., & Wilner, D. 2012, ApJ, 746, 174
- Schneider et al. (2010) Schneider, N., Csengeri, T., Bontemps, S., et al. 2010, A&A, 520, A49+
- Smith et al. (2009) Smith, R. J., Longmore, S., & Bonnell, I. 2009, MNRAS, 400, 1775
- Tan et al. (2013) Tan, J. C., Kong, S., Butler, M. J., Caselli, P., & Fontani, F. 2013, ApJ, 779, 96
- Tan et al. (2016) Tan, J. C., Kong, S., Zhang, Y., et al. 2016, ApJ, 821, L3
- Tigé et al. (2017) Tigé, J., Motte, F., Russeil, D., et al. 2017, A&A, 602, A77
- Vázquez-Semadeni et al. (2017) Vázquez-Semadeni, E., González-Samaniego, A., & Colín, P. 2017, MNRAS, 467, 1313
- Wang et al. (2014) Wang, K., Zhang, Q., Testi, L., et al. 2014, MNRAS, 439, 3275
- Zhang et al. (2014) Zhang, B., Moscadelli, L., Sato, M., et al. 2014, ApJ, 781, 89